Apple reports second calendar quarter results in about a week. I propose the following estimates:
Fiscal Q3 2017: Rev ($B) 45.321 EPS ($) 1.62 iPhone (units) 41 million iPad (units) 9.8 million Mac (units) 4.35 million Watch (units) 2.5 million Services ($) 7.2 billion Other products ($) 2.6 billion Gross margin (%) 38.4
The revenue estimate is visualized in relation to guidance (revenue between $43.5 billion and $45.5 billion) and shown in the context of previous actual revenues below:p
The estimates are also consistent with additional guidance provided:
Gross margin between 37.5% and 38.5%
Operating expenses between $6.6 billion and $6.7 billion
Other income/(expense) of $450 million
Tax rate of 25.5%
The estimates (and guidance) suggest modest growth of 7% in revenues and 13.7% EPS. The predictability of the quarter suggests that attention will mostly be focused on guidance for the next quarter.
Expectations can vary quite a bit because of the effects of a new launch. The product mix, pricing and timing are all unknown at this time.
What is known however is that the customer base for Apple is increasing and loyalty is higher than ever. What I sense, coming from very few data points, is that there are more iPhones in use than ever before. A few years ago when the market was less saturated it was easy to assume that commodity Android phones and tablets would surge and swamp iPhone/iOS usage.
This has not happened, indeed the data suggests that iOS usage is stronger than ever and that there are many more "switchers" moving from Android to iOS than vice-versa.
This may surprise some but if we look at the PC market, a similar phenomenon has been taking place for years. Mac usage grows and Macs are more visible and valuable than PCs.
It's important to note that in the latter, post saturation stages, the markets for both phones and computers are increasingly driven by brand value. This resistance to commoditization is due to buyers' perceptions of quality moving beyond utility and of the prioritization by buyers of new measures of performance. These new measures defy measurement.
Much of what is therefore required of market analysts is intuition.
From the way Apple reports its revenues you might think that the company has several operating segments. There are the iPhone, the Mac, the iPad for which units and revenues are reported. Then there are Services and Other Products for which we have revenues only.
Services is a collection of all non-hardware revenues and is (finally) being recognized as a non-trivial business. With reported revenues of $26.6 billion in the last twelve months, it's big enough to be a Fortune 100 company and set to double in four years. ((Although a non-zero business, the valuation of Services continues to confound observers who cannot separate it from the hardware businesses it attaches to--which themselves are considered near commodity value--thus paradoxically valuing the overlying asset of Services near or precisely at zero. Incidentally, Facebook is Fortune 98 at $27.3 billion and it is also one of the top 5 largest business by market capitalization.))
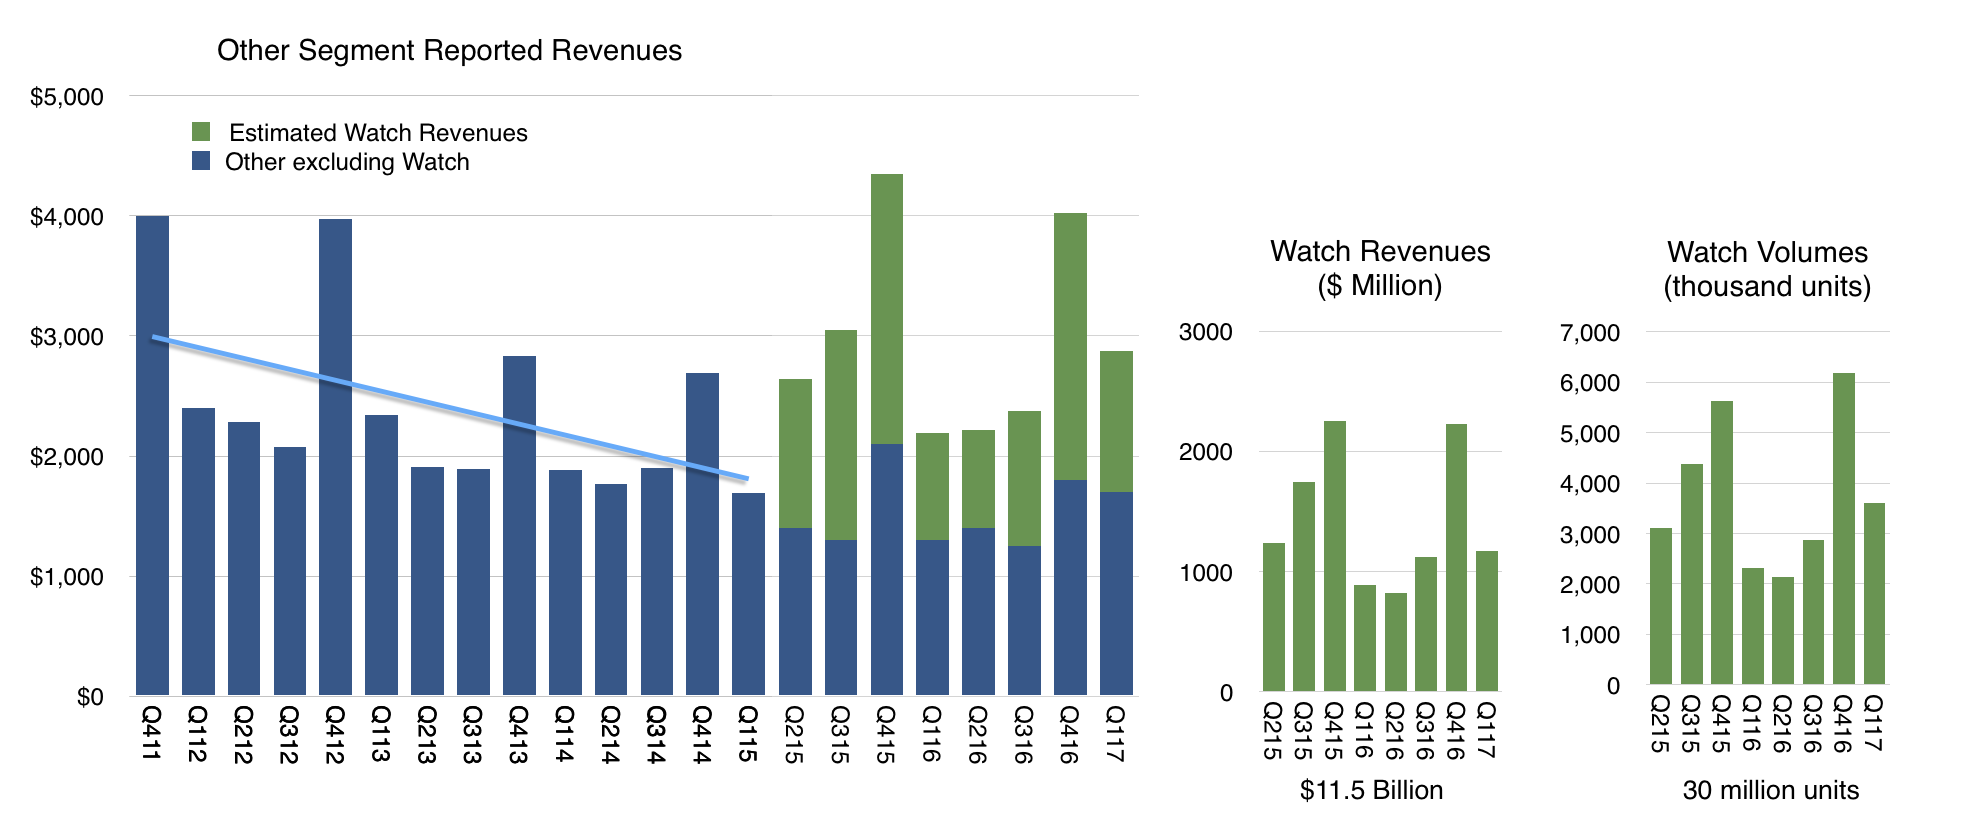
That leaves "Other Products" which now becomes the revenue segment that is "most likely to be ignored." This segment had revenues of only about $11.5 billion in the last 12 months which would place it at only a Fortune 245 ranking, equivalent to a Toys "R" Us or Biogen. How should we value Other Products?
Other includes many hardware products including iPod, Apple TV, Beats, Apple Watch, AirPods and, soon, HomePod. Each is a significant product, with Watch probably the largest single contributor. But since we don't have specific unit numbers, we are left guessing at the contribution of each.
The Watch itself has been a point of scrutiny as it could be initially teased out of the mix through an observation of the before-and-after launch vs. trend-line as shown below:
This separation of Watch became harder to discern after the launch of AirPods. Though they are still very hard to obtain, they might be "moving the needle" by now with a contribution that would muddy the Other category further. Same with updated Beats headphones.
This separation will be harder still with the launch of HomePod later this year. This product is priced at a point similar to the Watch and the quantities sold will be very hard to estimate without Apple's revealing of actuals.
Fundamentally however, all the "Other products" will have a common relationship to the iOS and MacOS hardware: attachment to and integration with a "parent" platform. Apple TV might be stand-alone but I strongly doubt there are many sold into offices or households which don't have iOS usage.
This means that "Other Products" are very similar to "Services" in that there is a dependency on a primary platform and, as it has been argued, they are therefore fragile. If the core platform declines then the Services and Other Products decline as well.
Given this dependency it makes little sense to carve these categories out as separate businesses. They cannot stand alone. They are very much the "children" of the parent platforms.
This is why it's assumed that Services, (a Fortune 100 company) and Other Products (a Fortune 250 company) can be discounted to zero. By focusing attention on the iPhone one can capture all the essential value of Apple. This is in contrast to the "sum-of-parts" valuation that could be applied to a set of independent business units in other companies.
And yet I started this discussion with the point that you might be tempted to look at Apple on the basis of these reported revenue segments. The choice of what Apple reports is arbitrary. It could report no segment revenues at all and publish just one revenue number. This is roughly what Google Amazon and Facebook do. Or it could report segments in some other way. For instance, app store revenues and AirPods could be reported as part of "The iPhone Division". Or maybe it could bundle all iOS devices and services and accessories into another segment called "The iOS Group". Or it could create a "Devices group" and a "Personal Computing" group. Microsoft famously shuffles its revenues into creative segments based on various organizational structures or choice of what it wants to project as its focus.
There is no limit to the ways Apple could slice revenues into segments. The reason Apple does it the way they do is mostly due to historical reasons. The company used to report the iPod separately as a segment but it no longer does. It also used to report Software separately, because, presumably, it charged for it but now it no longer does. It also separated laptops or portables from desktops.
The current reporting system is tempting us to draw certain "business unit" conclusions. These boundaries are illusions because Apple does not have business units. It has only one Profit and Loss statement (P/L) and is organized functionally. There is no "head of iPhone" or "head of Mac" responsible for each siloed revenue and cost structure. Instead, the entire business should be seen as a whole because it is managed as a whole.
This is easily evident in how the products are designed and marketed and how they are engineered. The iPhone may spawn AirPods and AirPods may have no value outside the iPhone but the iPhone is valuable precisely because it has AirPods and Apps and Music and iCloud. And Apple TV, and HomePod and whatever comes next. The reason the iPhone can be sold at three times the price of competitor products is because of the Services and Other Products and iPad and Mac symbiosis. This integration drives the satisfaction, loyalty, price and brand value. There there are the Apple Stores and the launch events and the countless details that make up the ownership experience.
The fact is that you can't slice and dice Apple.
There is one Apple and it must be analyzed as a unitary entity. That analysis is therefore difficult. It is easy to pick up the numbers given and study them in isolation. The iPhone, the iPad, the Mac. We all do that.. However we miss a great deal in doing that.
The lesson is that data we obtain leads us to see something but it also blinds us by taking attention away from what we cannot see. All data lies by omission. That which is left unmeasured may be where all the truth lies.
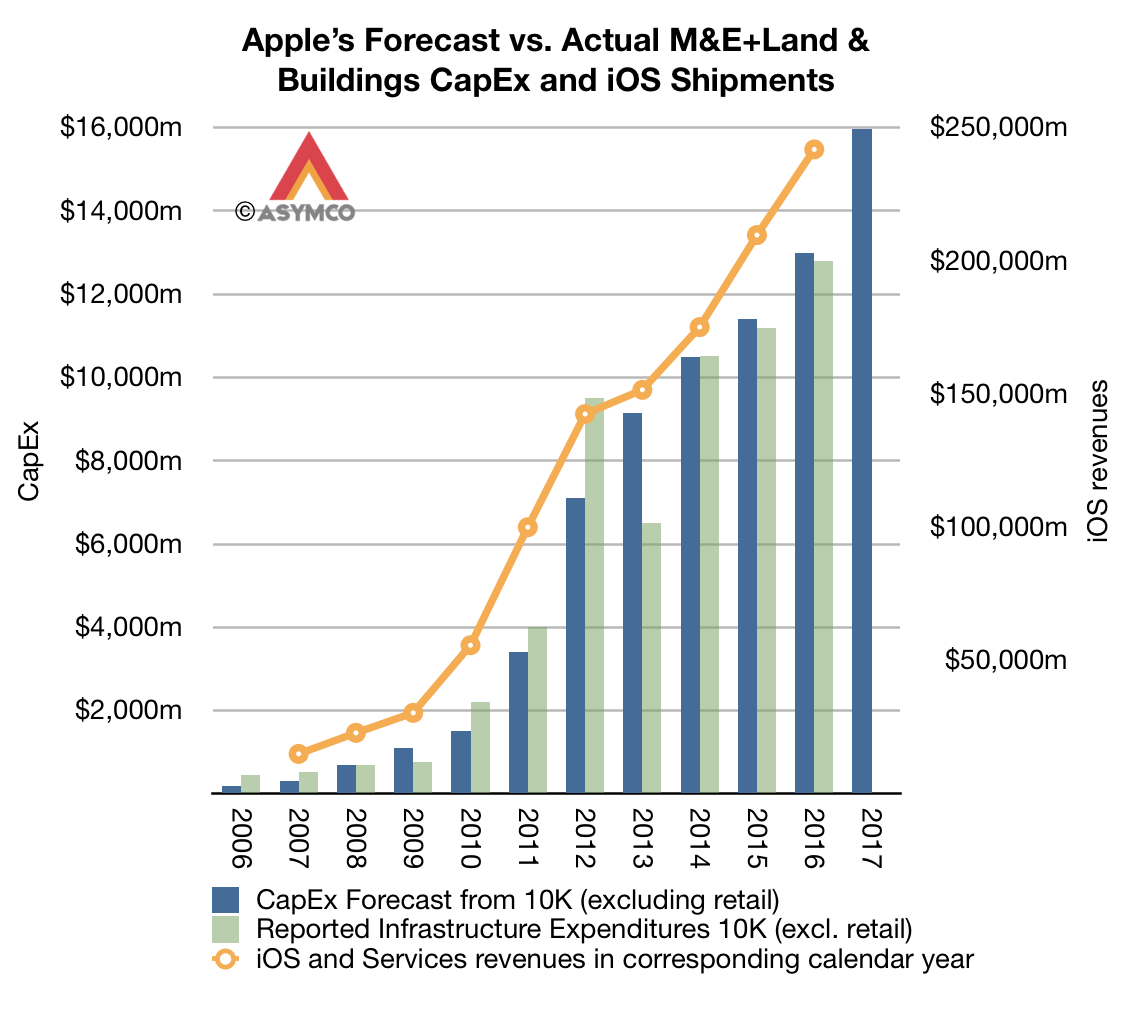
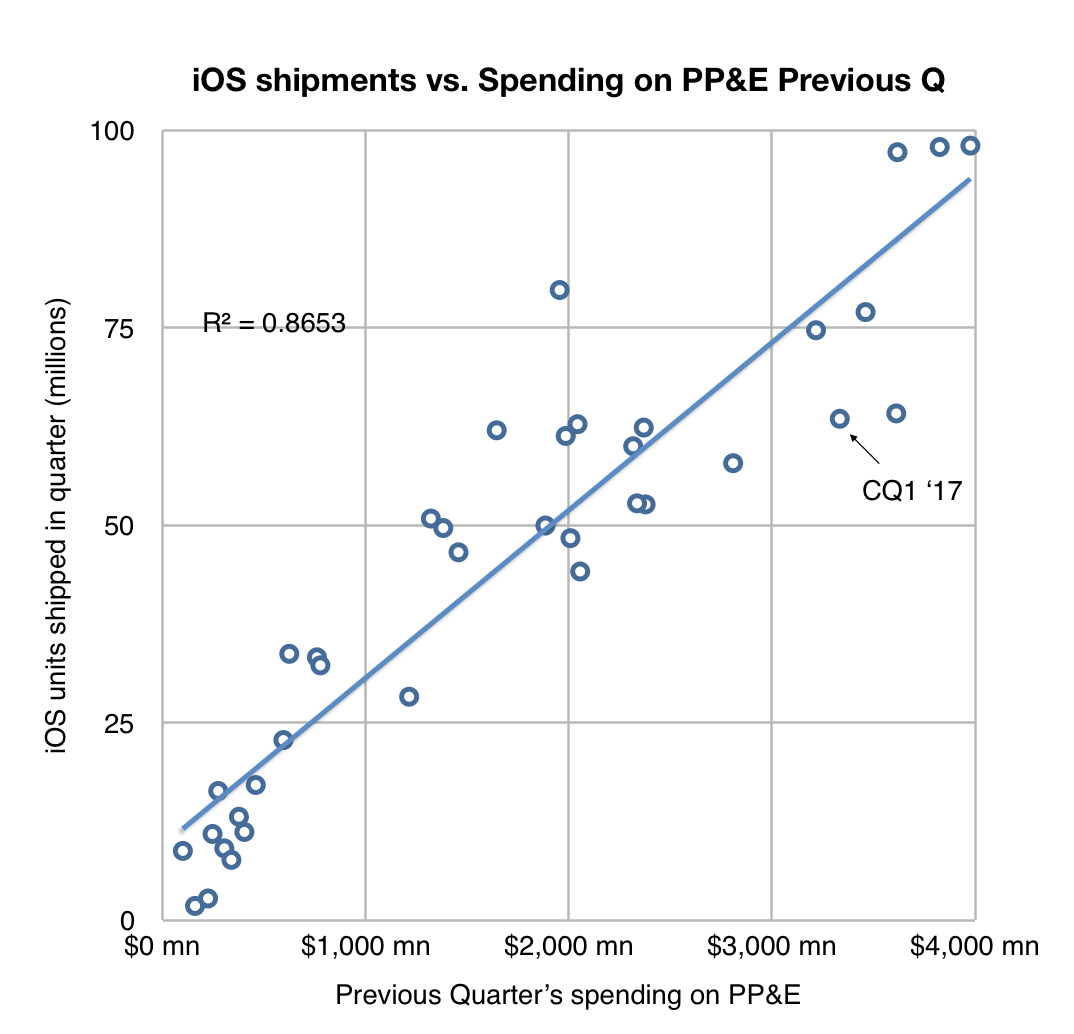
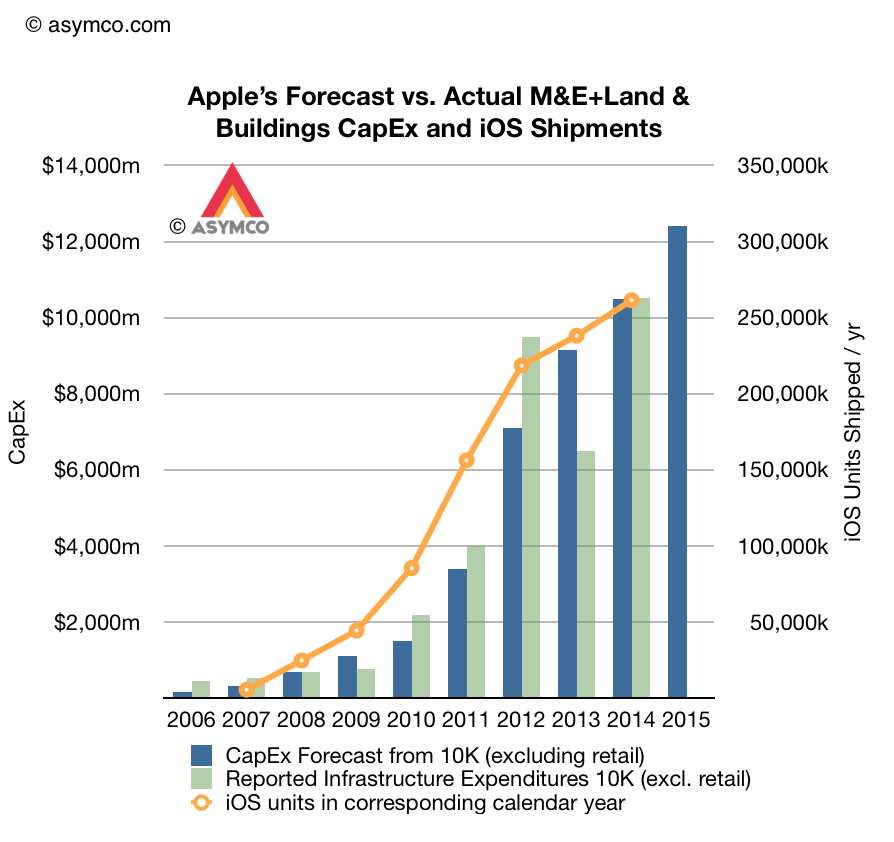
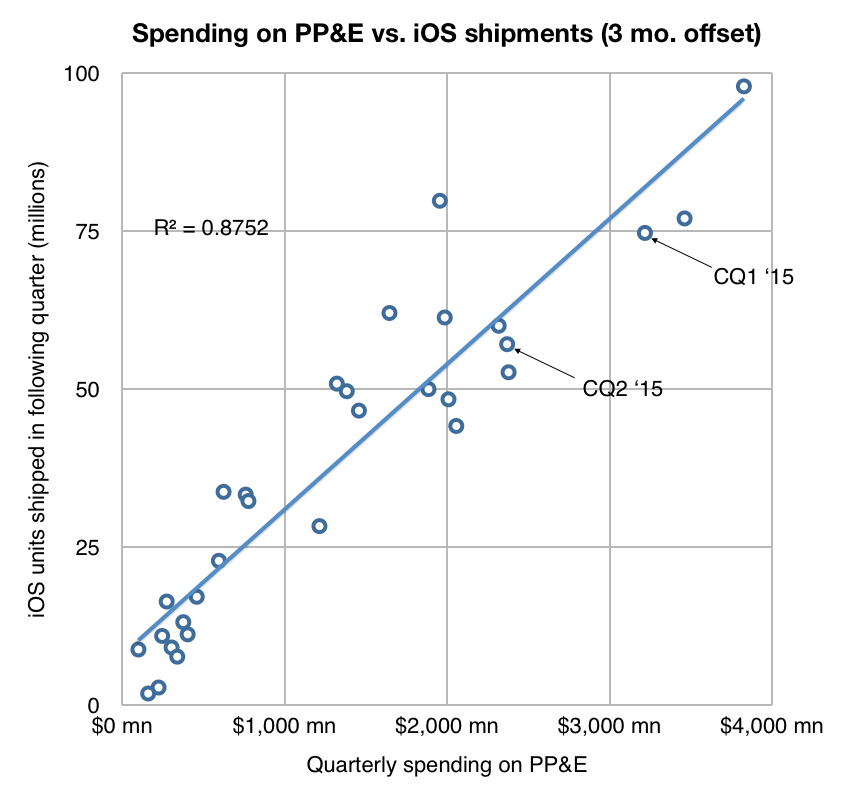
Predicting Apple's yearly revenues has been fairly easy. The following graph shows the relationship between budgeted spending on Machinery, Equipment, Internal-use software, Land & Buildings and the shipment of iOS device revenues.
The company conveniently publishes a full-year forecast of these expenditures every fiscal year so by October we know roughly how sales will be during the following year. This pattern has held for 10 years so there is little uncertainty about the 11th year of iOS devices.
Although the two are not very tightly coupled, there is a causal link between them: spending on machinery and equipment for production leads to more production which leads to more sales (assuming prices are stable--which they are).
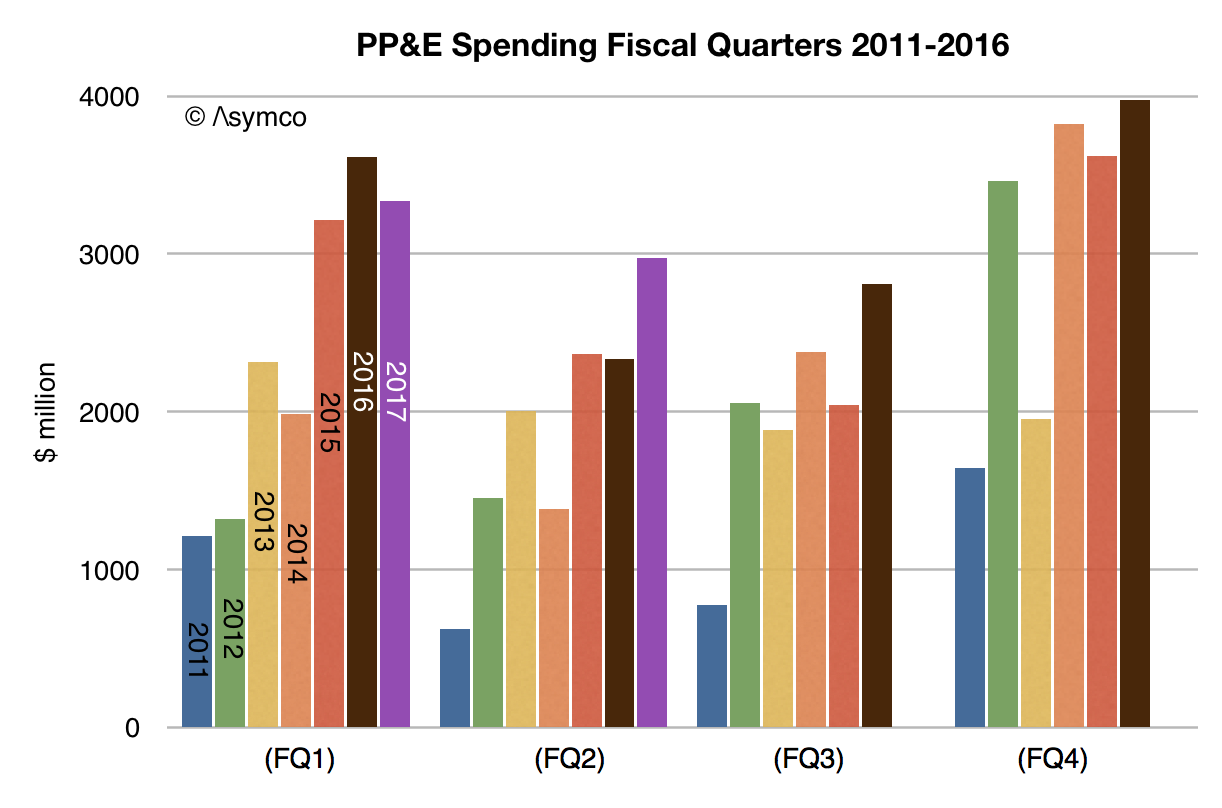
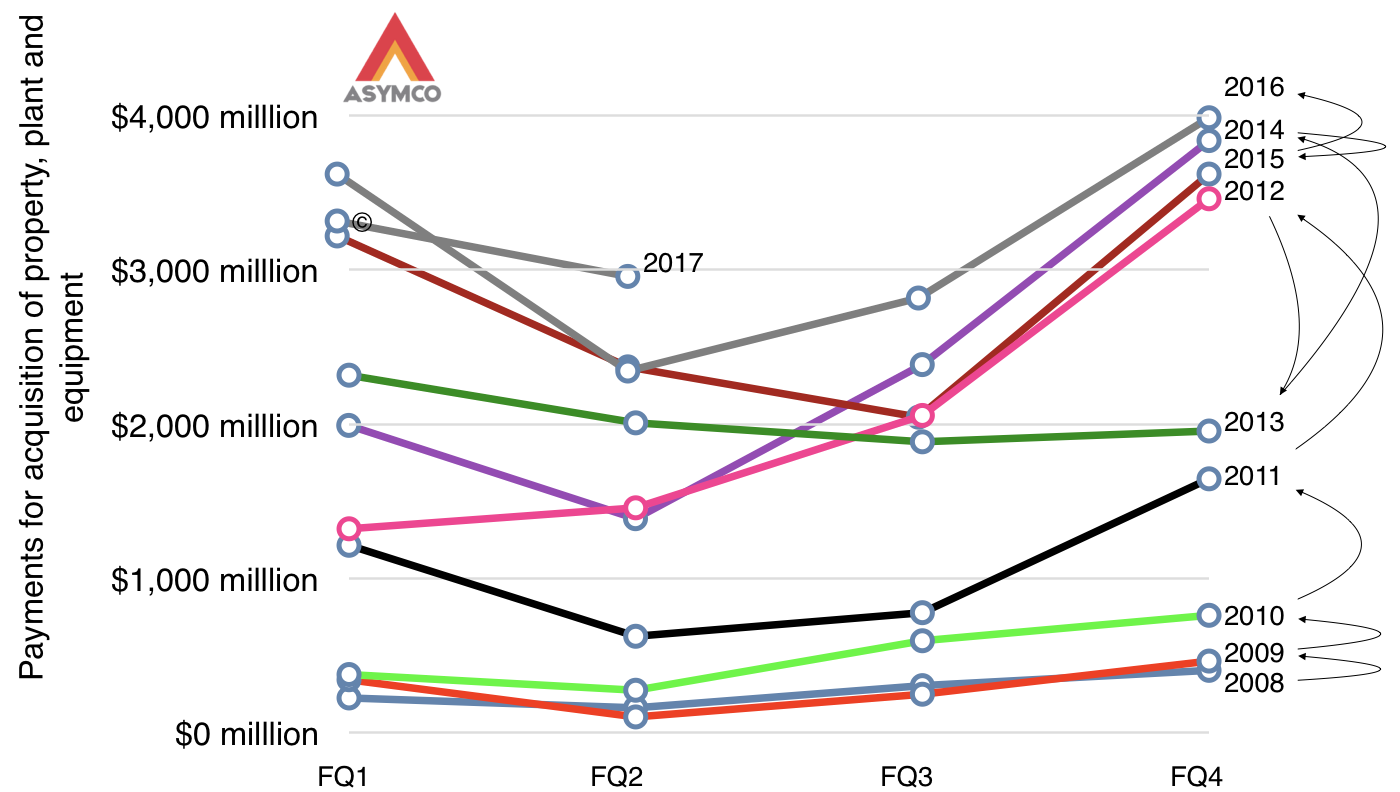
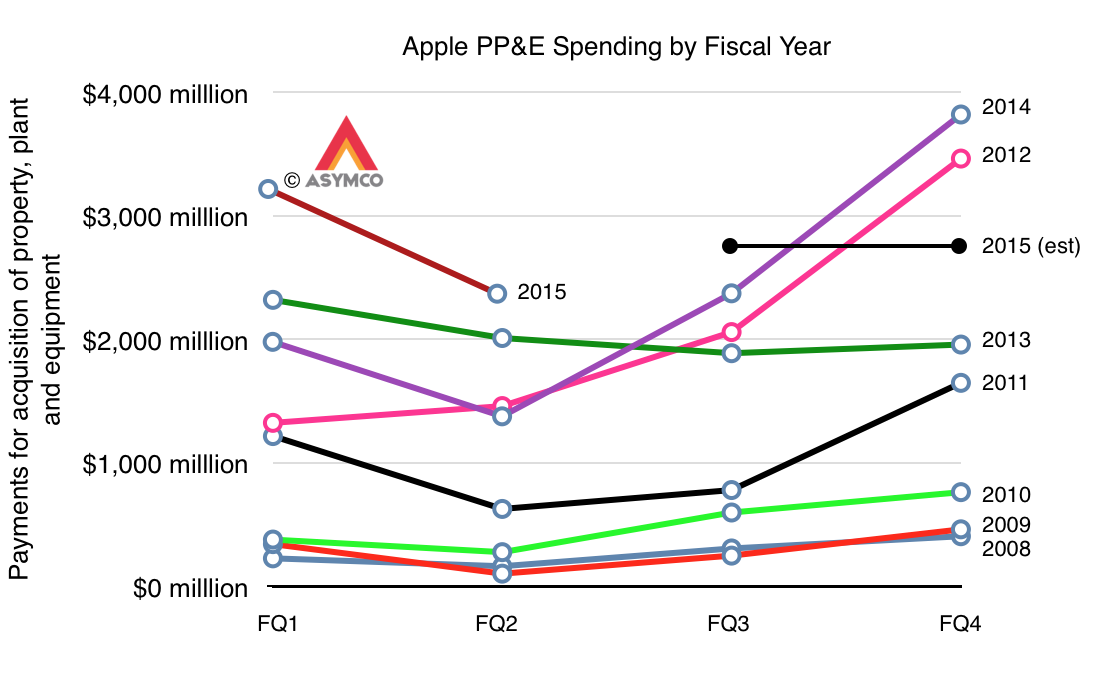
We are, as of the time of writing, half-way through a fiscal year and the quarterly spending can be inspected for any surprises. None are evident as the second fiscal year (first calendar quarter of 2017) shows a new high in capital spending at nearly $3 billion, placing us on track for the surge into the production of the new iPhone (and iPads.)
The quarterly relationship between sales and spending is less precise as equipment buying is "front-loaded" into a production cycle but there is a strong correlation nonetheless.
When looking through the data, quarter after quarter, year after year, there is a consistency and reliability to the spending/revenue relationship which implies, to me at least, a high degree of certainty.
This predictability, however, has not detracted from the volatility in Apple's share price--an instrument designed to embody precisely this prediction.
Apple's share price continues to see swings of more than 70% in any given 52 week period. In the latest 52 week period the shares traded between $89.47 and $154.88, a 73% swing.100% is not unheard of. Incidentally, S&P 500 volatility ranges around 45%. Apple is by far the largest company in the world and fairly old by large company standards. It should attract a certain premium of stability.
And yet it doesn't. Skepticism around the company is continuously evident. It's in the headlines written every day which concoct convoluted reasons to doubt future performance. It's in the conversations I have with investors who question the tiniest of details in the design of a product (like headphone jack or home butto) in order to gauge their impact on the survival of the firm. It's in the continuous parade of "disruptive entrants" or "established giants" ready to knock the company off its perch by virtue of simply existing.
Perhaps the panic it induces in investors with its reliable profits is Apple's most predictable attribute.
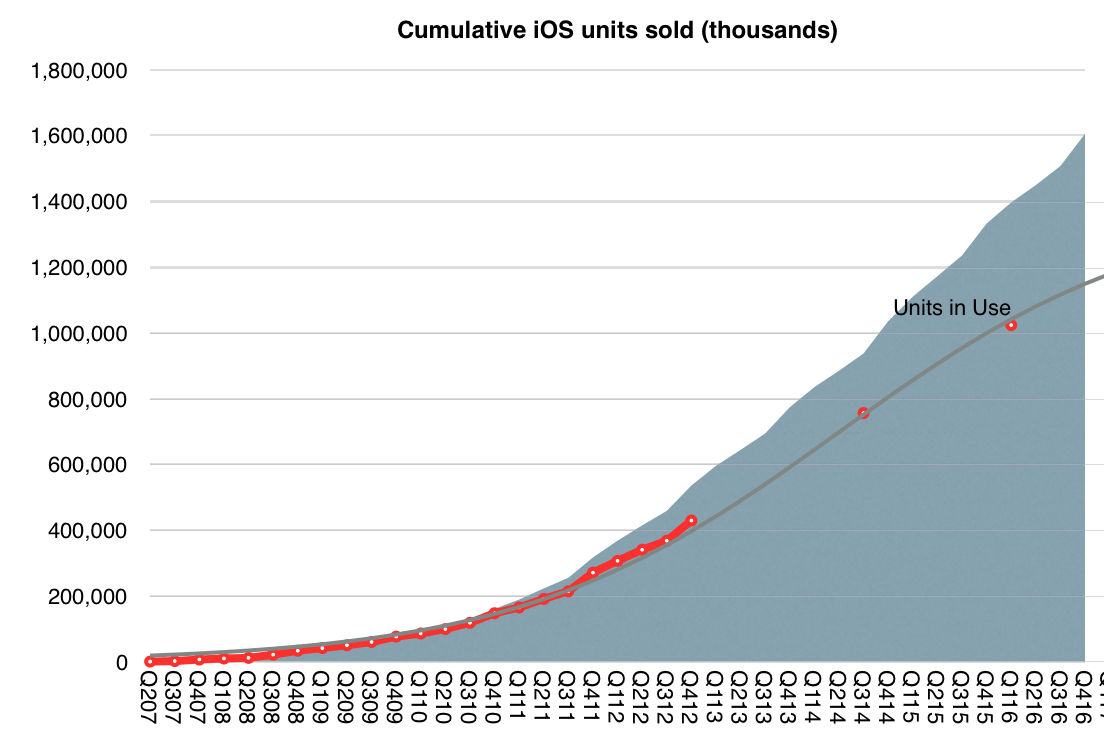
In its first 10 years, the iPhone will have sold at least 1.2 billion units, ((Includes forecast for first six months of 2017)) making it the most successful product of all time. The iPhone also enabled the iOS empire which includes the iPod touch, the iPad, the Apple Watch and Apple TV whose combined total unit sales will reach 1.75 billion units over 10 years. This total is likely to top 2 billion units by the end of 2018.
The revenues from iOS product sales will reach $980 billion by middle of this year. In addition to hardware Apple also books iOS services revenues (including content) which have totaled more than $100 billion to date.
This means that iOS will have generated over $1 trillion in revenues for Apple sometime this year.
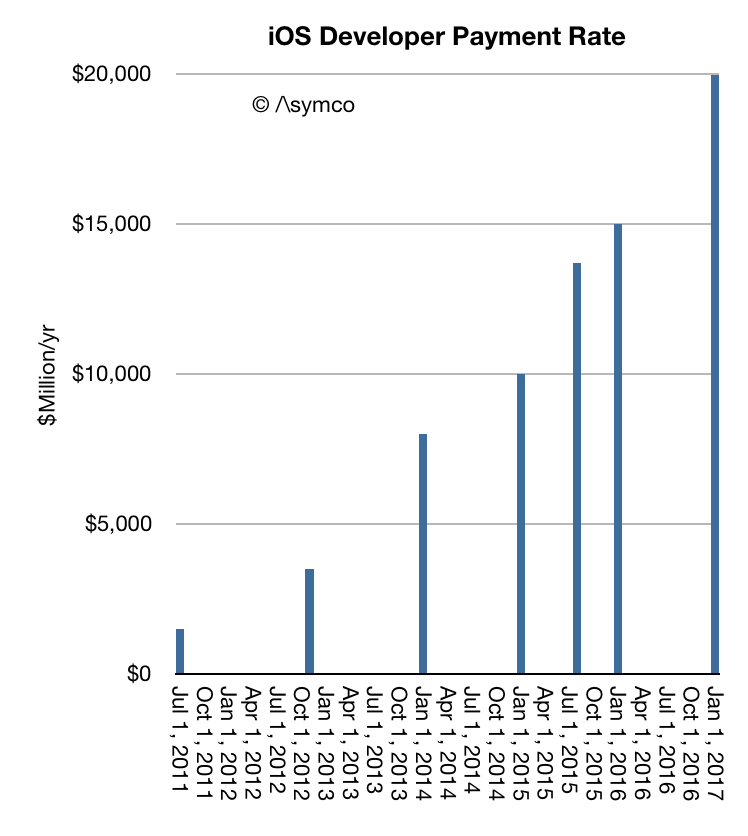
In addition, developers building apps for iOS have been paid $60 billion. The rate of payments has now reached $20 billion/yr.
Not included in this payment total are "mobile-first" or "mobile mainly" businesses such as FaceBook, Twitter, Linkedin, Tencent, YouTube, Yahoo, NetEase, Pandora Radio, Google Search, Baidu, Google Maps, Gmail, Instagram, Amazon, eBay, JD.com, Alibaba, Priceline, Expedia, Salesforce and Other Enterprise Software, Ride Sharing Apps, AirBnB and many other services which monetize independently of the App Store.
I estimate that the cumulative revenues enabled by iOS across these businesses have exceeded $500 billion, with a rate of revenue soon to reach $300 billion/yr.
The revenue numbers can only hint at the change in behavior among users. An iPhone is unlocked 80 times a day. Assuming 600 million devices in use there are 48 billion sessions on iPhones every day. 17.5 trillion sessions every year. It is these instances of interaction and engagement which are desired by all businesses built on top of the ecosystem.
These instances of engagement must be multiplied by the quality of the customers which Apple captures. iOS users spend more and are more loyal than those on alternative platform thus qualifying the platform as "premium" and thus adding to its value in the eyes of developers, content producers and service providers.
As the install base of iOS increases and as users hire the devices to do more and spend more time with them the virtuous cycle of value creation will continue and accelerate.
There is a temptation to think that such a business is fragile and will be disrupted. Challengers appear daily and the number of iPhone "killers" is not measurable. One can cite the billion users of Nokia phones which defected. One can cite the loyalty of BlackBerry users that evaporated. One can even cite the juggernaut of Windows and how it became impotent. One can cite the vast number of Android devices offered at low prices.
But there are reasons to believe that the iOS empire is far stronger and resilient.
Unlike Nokia's phones, Apple's product is an ecosystem with network effects and dependencies on software and services. It's also a monolithic product with a singular interface and form factor.
Unlike BlackBerry, the iPhone does many jobs--too many to count. Indeed the iPhone evolves and changes its core value over time.
Although different in many ways from Windows there are strong similarities in terms of loyalty and persistence of users. iOS even developed a dominant position in enterprises. Microsoft's attempt to become a hardware company is a testament to the confluence of the two business models.
And whereas Android was originally seen as the "good enough" iPhone, potentially disrupting it, it turns out to be the ersatz iPhone. Chances are higher that users will switch from Android to iPhone and not the other way. Again, the reasons have more to do with the ecosystem and quality of users (which are hard to measure) than with the hardware (which is easy to measure.)
As we look toward the second decade of the iPhone, the expectation isn't one of another "big bang" but a process of continuous improvement. The market is nearing saturation so the goals must be to capture more switchers from Android. Apple has achieved this with the Mac: survival, persistence and eventual redemption.
More exciting is the apparent expansion of a network of ancillary "smart" accessories. The Apple Watch, the AirPods, Pencil and possible new wearables point toward a future where the iPhone is a hub to a mesh of personal devices. The seamless integration of such devices is what has always set Apple apart.
At WWDC 2016 Apple offered a set of new data points to illustrate its ecosystem's robustness.
First, the number of registered developers increased by 2 million in the last year to a total of 13 million. That is a growth rate of 18%. To compare this total consider that Oracle claimed in 2014 9 million Java developers and IDC claimed in 2014 there were 18.5 million software developers in the world, of which 11 million were professional software developers and 7.5 million were hobbyist developers. It's therefore possible that Apple's "market share" among developers is close to 70%.
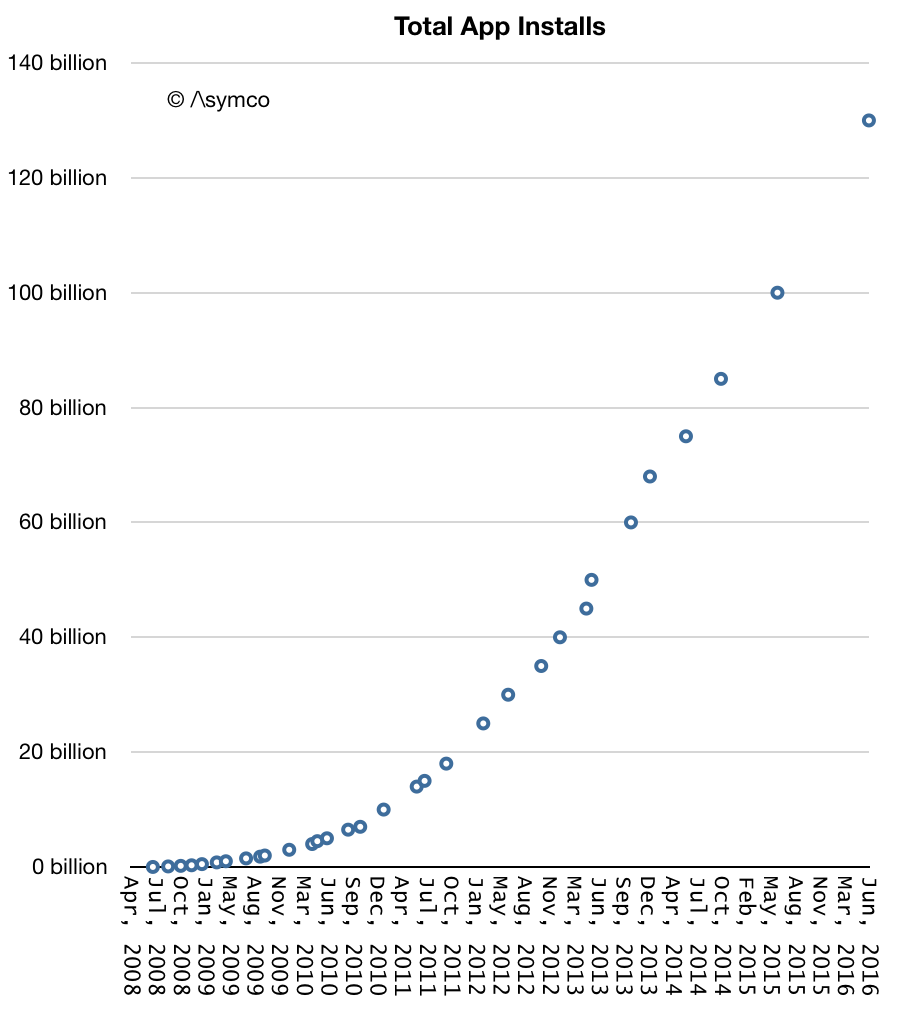
Second, App installs have now reached 130 billion. The cumulative growth is shown in the graph below:
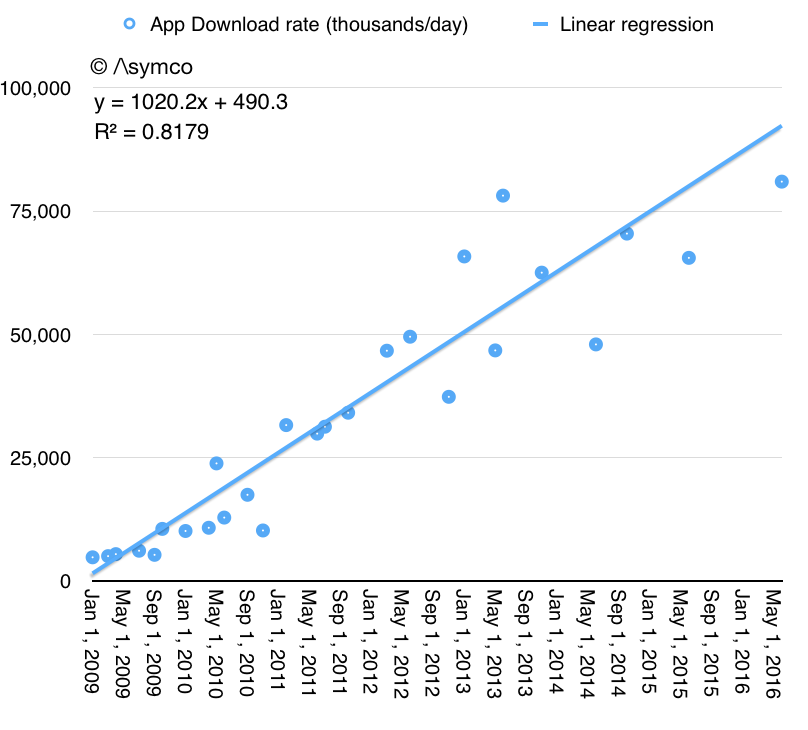
The rate of growth is also shown in the following graph:
Note that the rate of growth continues to increase and is now above 30 billion/yr. It turns out that apps continue to be a popular download item. The size of the audience continues to grow (see graph below) and it's therefore understandable that activity in the store continues to grow.
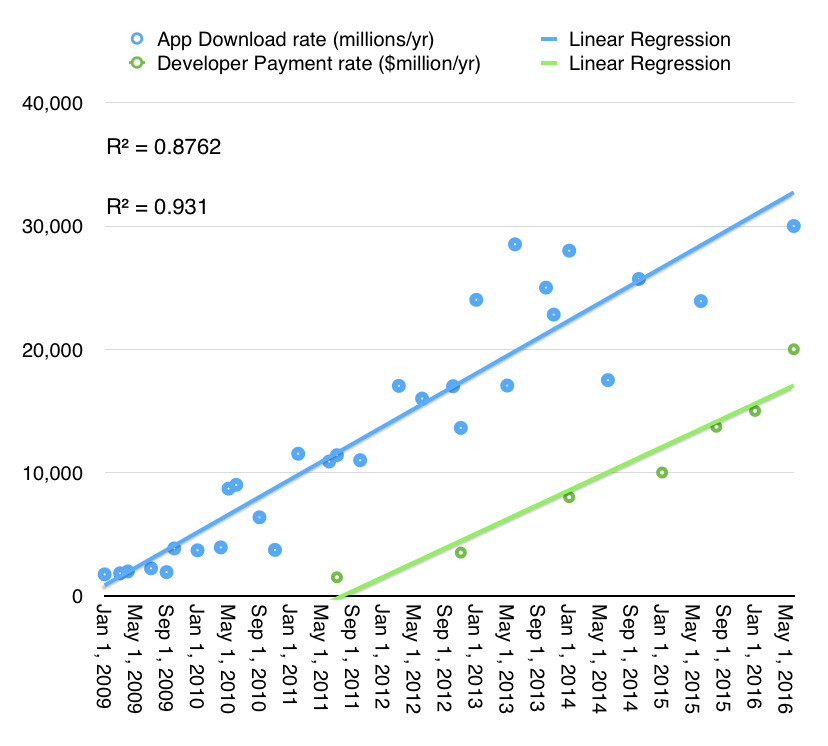
Third, the rate of payment to developers has also increased to over $20 billion/yr., with the total payments having reached $50 billion.
The graph above shows the derived payment rate (in green) relative to the download rate (blue). Although not completely parallel, the overall correlation is plain to see.
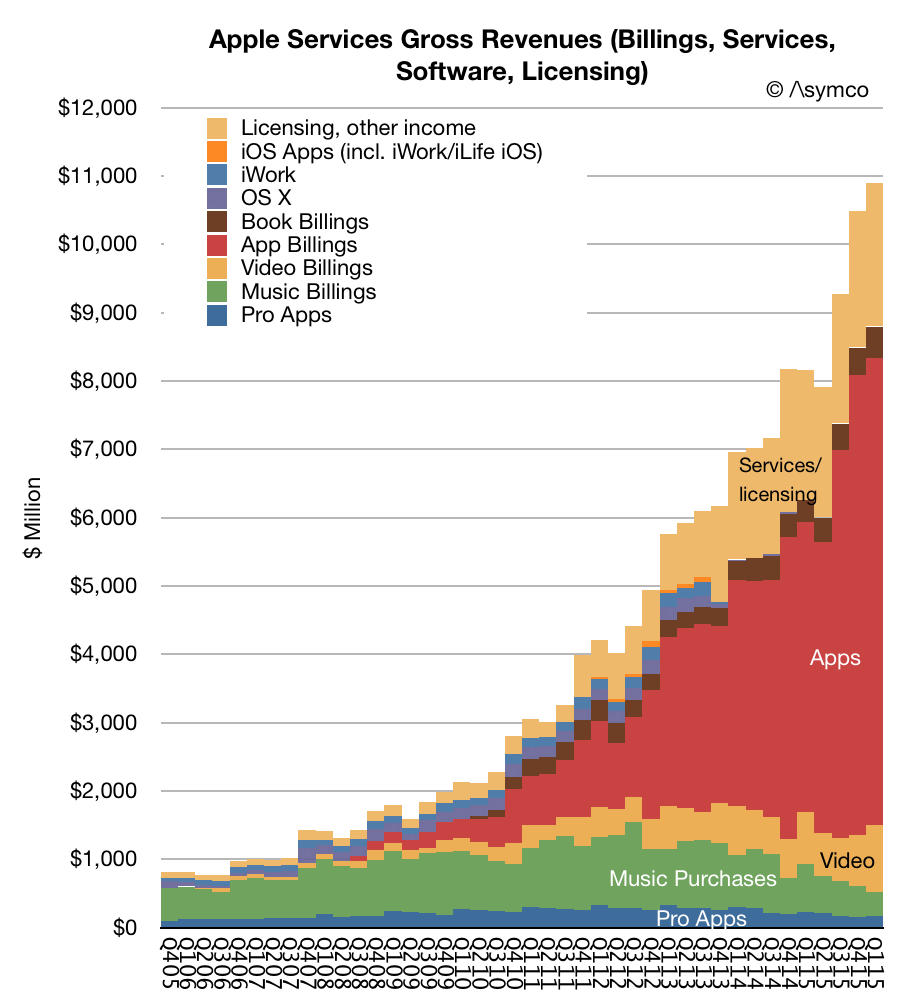
Fourth, there are more platforms than ever (four device and three services). As a result, Apps and services continue to outgrow traditional content revenues. Gross revenues for iTunes/Apps/Software/Services/Licensing is shown below:
Overall, economic activity transacted directly through Apple's platforms is approaching the run rate of $40 billion/yr. It continues to grow at about 20%, so it's foreseeable that it will reach at least $50 billion/yr.
It's hard to compare to other ecosystems as metrics vary but this rate alone places Services as one of the larges businesses in the world (service or otherwise).
There are other ecosystems "on top" of iOS which transact outside the Apple systems (and hence are not reported in the total above). These include Facebook, Google, Uber, Amazon and other economies which use iOS devices to enable engagement. These add up to hundreds of billions of dollars in transactional value. My estimate is that all mobile services are at least $250 billion/yr today and will reach $800 billion/yr in 2020. Apple is and will continue to be the home or enabler to the majority of this revenue.
But the more profound point to be made is that this ecosystem relies mainly on direct payments by the beneficiaries of the service or content. Apple contents itself with the $35 billion it can transact through its own storefronts because it feels that the business models are compatible with its brand.
When it comes to all the ways of "monetizing" platforms, this may be a very conservative strategy but it's one that also avoids the potential pitfalls of social scandal.
When exactly did enterprises become late adopters of technology? We know that they were some of the first buyers of computers. IBM sold tabulating and later computing machines to businesses starting in the 1910s. During the 1980s it was businesses which bought PCs in significant numbers to augment, and later replace, their centralized computing resources. Networking was in use in government and in business long before consumers saw any value in it.
In my talks I often point out that if you wanted to create a near-monopoly in computing in the 1990s all you needed was to convince 500 people to adopt your technology: the IT managers of the Fortune 500. If the largest companies used your product then they would impose the standard on all their suppliers and distributors and pretty soon there would be no alternatives.
So what happened during the last decade or so?
Today IT departments are known as the Information Denial department. I recall that when the DVD first became an option on desktop or laptop computers, IT departments were first to decline the option (presumably because it would be used for entertainment rather than work.) When instant messaging first became available, it was IT departments who blocked the ports. When mobile devices with cameras became available signs went up that no cameras would be allowed on company premises. When USB sticks became available, USB ports started getting glued shut. When iOS became available, no devices running it were allowed on the network. Then came Facebook, Instagram and dozens of social media.
This pattern of not only a refusal to adopt but an outright ban on new technologies by enterprises made them fall off the radar of technology developers. Quite simply everyone outside the supply chain into enterprises stopped developing new markets around them. From venture funds to developers, enterprises fell out of the business plans.
The enterprise stood as a place of "legacy" and "security" which prevented mobile or other forms of computing. Paradoxes emerged wherein an administrative assistant had more computing power in his pocket than the CEO had in her data center; where the same assistant would know what was happening faster than any of the bosses. Homes had better connectivity than offices and productivity at small firms increased faster than at big firms. Incidentally, even the slowest enterprises were faster then the government. The bigger the firm, the slower and stupider it seemed. Were large firms employing dumb managers or did being a manager in a large firm make you dumb?
One resolution to this paradox might be that mobility and the movement of processing onto consumer devices increased the cadence of product development to such a degree that the purchase cycle and dollar amounts involved ran out of the range which companies could absorb.
A simple way to explain it is this: A company takes longer to decide to purchase a device than the device's shelf life. In other words, by the time all the salespeople and committees and standards setting and golf playing and dining and site visits would be completed, the object whose purchase was being discussed would be discontinued.
A more onerous issue is that companies have procedures for accepting technologies (capital expenditures) which require high degrees of interaction and decision making. In order to step though these procedures, the vendors need to have sales people who need to invest lots of their time and therefore need to be compensated with large commissions. If those commissions are a percent of sale then the total sales price needs to be large enough "to make it worth while to all parties". As a result, paradoxically, an enterprise technology must be sufficiently slow and expensive to be adopted.
Mobility was disruptive to enterprise because the new computing paradigm was both too fast and too cheap to be implementable.
This implies that the problem with enterprises is not the stupidity of its buyers. They are no less smart than the average person--in fact, they are as smart with their personal choices for computing as anybody. The problem is that enterprises have a capital use and allocation model which is obsolete. This capital decision process assumes that capital goods are expensive, needing depreciation, and therefore should be regulated, governed and carefully chosen. The processes built for capital goods are extended to ephemera like devices, software and networking.
It does not help that these new capital goods are used to manage what became the most important asset of the company: information. We thus have a perfect storm of increasingly inappropriate allocation of resources to resolving firms' increasingly important processes. The result is loss of productivity, increasingly bizarre regulation and prohibition of the most desirable tools.
Which brings us to the latest announcement of collaboration between the new disruptor of computing Apple and the vendors supplying Enterprises like IBM and Cisco.
Apple was the loser in the standardization of computing during the 1990s but is the winner in the mobilization of computing during the 2010s. The company positioned itself in both cases on consumer computing but it never gave up on enterprises.
The approach of Apple seems to be to enable the larger suppliers of technology to enterprises to bundle iOS as part of the acceptable set of services and products. In essence, Apple is complying with the requirement to be slow and expensive in order to be adopted. It can maintain the cadence of product development while attaching itself to the purchase cycle of the enterprise.
In a way it's like an automatic transmission in a car. Operating through gears, the engine can rev at a different rate than the wheels turn. Occasionally, shifting happens but the fluid coupling keeps both the engine and the wheels from absorbing any damaging shocks.
During the last quarterly earnings call, Tim Cook said that Apple has seen the highest switching rate from Android ever. That there is switching isn't surprising. We've seen many surveys which show higher loyalty with iOS than with Android. But it's been very hard to spot the evidence in the data which is visible publicly. Both iOS and Android are adding users and sales for both platforms are still increasing.
The switching effect is easier to discern when the market is not growing overall. In that situation one platform's growth has to be at the expense of another. However, some markets do show evidence of "churn" in users.
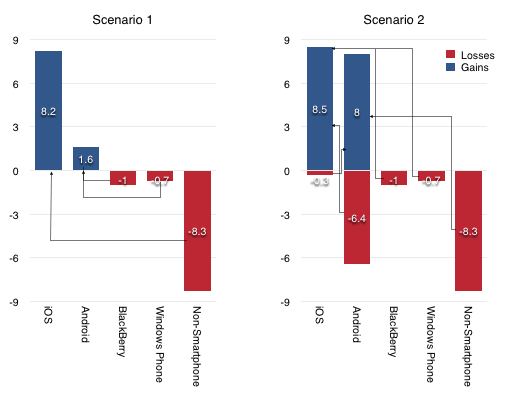
Consider the ComScore data on US platform users (above). If we look at the last six months' data ((these data are actually three month averages)) we can count that there are about 8.2 million more Americans using iPhones than there were six months ago. At the same time, there are 1.6 million Android users. One million users left the BlackBerry platform and about 700,000 left Windows Mobile. The data also suggests that the total number of first-time smartphone users is about 8.3 million.
Now, we could say that Android recruited all the Windows and BlackBerry users that switched (1.6 gained equivalent to 1.7 million lost) and Apple recruited all the new-to-smartphone users (8.2 million gained by Apple vs. 8.3 million non-consumers).
But this is not very plausible. It's much more likely that Apple converts existing smartphone users while Android converts first-time users.
In this scenario, 8 million non-users first started using Android while 1.7 million BlackBerry and Windows users switched to iPhone. But that leaves the question of what happened to the missing 6.3 million that Apple should have gained.
That's where the switching number comes into the picture. This Scenario 2 is shown in the figure above and suggests that although Android gained 8 million new users, it lost 6.4 million to iPhone for a net gain of 1.6.
Apple may have also lost a few users to Android but overall gained switchers from other platforms, mainly Android. This is what would support Tim Cook's comments.
Thinking further ahead, as the markets mature globally, they may well evolve into the way the US market evolves today. Apple's brand promise ensures loyalty while competing platforms slowly "leak" users. If this sounds eerily familiar then you'd be right. This is exactly how the PC market behaves today.
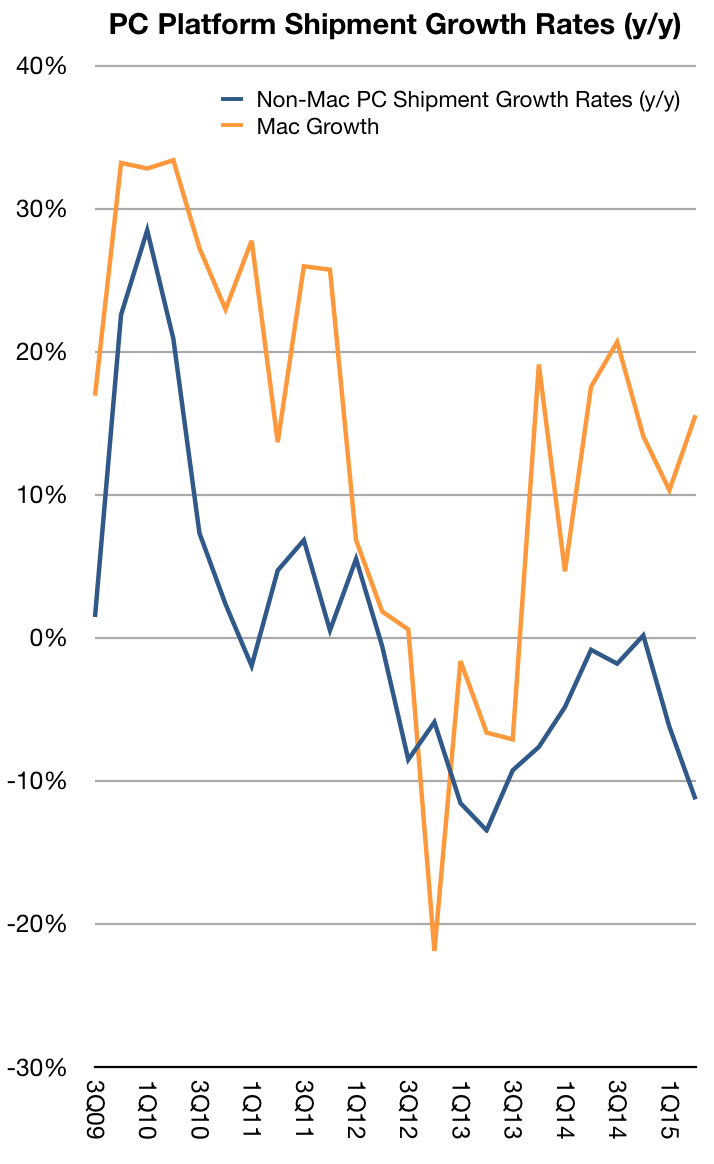
The pattern of Mac growth exceeding Windows PC growth (and overall PC growth which includes the Mac) is old news. It has been observed for at least 40 of the last 42 quarters.
It's a historically interesting contest, but the story of computing has moved on. Starting with building computing, via floor computing, office computing and then to desktop computing and portable computing we are now in the era of mobile computing. ((And as sure as the sun will rise tomorrow we will move beyond mobile computing)). The problem with observing mobility in general is that there are too many mobile computing options. Phones have a wide range of capabilities, tablets and various other form factors are positioned on differing jobs-to-be-done. Platforms and services are also scattered around jobs which have been carved from fixed computing or have been established with no fixed precedent.
So can we pinpoint with any accuracy the moment when the tipping point has been reached? We could point to all mobile phone shipments, or even the vaguely-defined smartphone shipments compared to all PC shipments. We could look at tablets alone. If we could get accurate measurements.
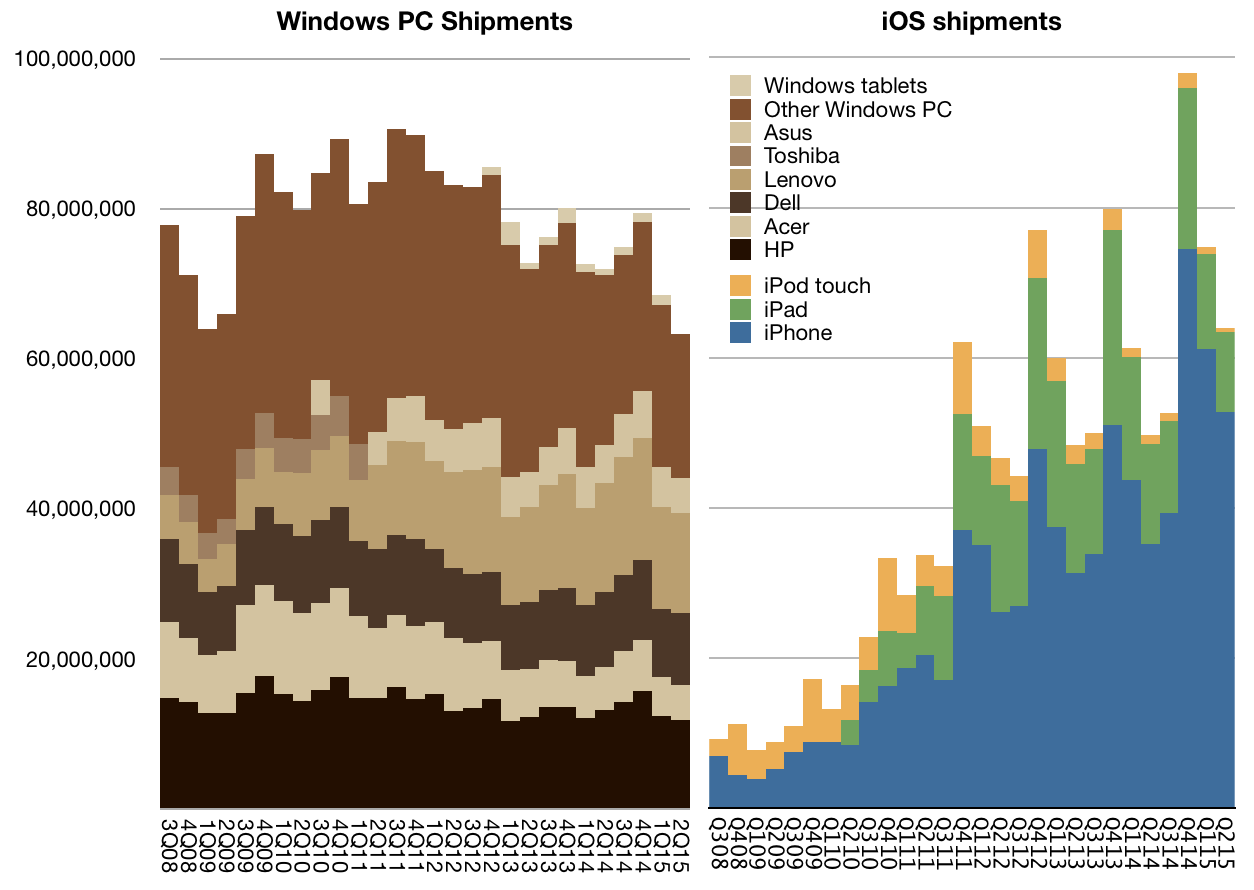
One measurement could be to look at operating systems alone. When comparing iOS shipments (iPhone, iPad and iPod touch) to Windows we can see that combined iOS shipments exceed all Windows PC shipments for all three previous quarters.
Which reminds me. This week Microsoft wrote off the acquisition of Nokia's mobile phone business. The growth of mobile as an alternative to desktop/laptop computing was foreseen by Microsoft a decade before the the data in the graphs above. It began in 1994 with Windows CE development, proceeded with a PDA operating system by 1998 and the Pocket PC brand in 2001 and Windows Mobile in 2004 and Windows Phone in 2009.
After anticipating, predicting and dedicating decades of work why didn't Microsoft participate in its own vision?
The curious thing about disruption is that predictability does not result in immunity. If the new trajectory threatens the current profit formula, the trajectory is not joined with enthusiasm. There is an uncanny unwillingness to self-disrupt.
The exceptions to this rule are so rare that they are seen as magical, enabled only by accident or catastrophe.
At the 2015 WWDC Apple stated that it receives 5 billion requests per week for its maps service. It also said that Apple maps is used 3.5 times more frequently than "the next leading maps app."
These two data points are the total number of data points we have about the global maps market. Neither Google nor Nokia provide usage or share or performance data. Regardless, commentary on the usage, share and performance of Apple Maps has been abundant for the three years since its inception.
The data presented allows us to make a few estimates for the first time and we can hope that additional data can allow a picture to emerge of where maps are going.
With these first two data points we can finally make some estimates. But some assumptions are still needed: We need to assume that the "next leading maps app" is Google Maps. Although there are other maps apps on the iOS platform they are probably insignificant and it's a two-horse race between Google and Apple on iOS.
This means that the 3.5:1 split in usage results in a 78% share for Apple Maps and a 22% share for Google. If we assume that there are about 400 million iOS users of maps ((Note that not all iOS users are maps users. Maps are not used by all users)), it leads to about 90 million Google Maps users on iOS and about 310 million Apple Maps users on iOS. This includes iPad. ((We are excluding OS X use of Maps.))
Given that Google also reported 1 billion downloads in 2014 ((though not necessarily all of these downloads lead to active use, obviously)) we can assume between 25% to 33% Apple Maps "market share" of usage.
At the minimum, 25% share is not insignificant and it's easily sustainable. To understand why, we should note that there is one more data point. In December 2012 I posted an analysis on the the cost of maps. It showed that maintaining maps requires an investment of between $1 billion and $2 billion/yr. With the addition of new features such as 3-D mapping, transit maps and thousands of new cities, the cost is likely to have increased. $2 billion/yr is probably the norm today.
Apple then could be seen as spending about $6.5/user/yr on maps and Google could be spending about $2/user/yr. To be profitable Google would need to find ad revenues of $2/user/yr and Apple would need to find $6 of profit on each phone/yr. Clearly, each of these targets is achievable.
In contrast we can see why Nokia's HERE Maps business is now worth a lot less than it was in 2007. The asset has been for sale for some time and the latest bid has been for $3 billion, making the $5 billion lost in market value and $7 billion of investment since seem like a catastrophe. Without a business model the data is worthless--with only 30 million users the cost per user reaches $66/yr. A buyer needs to find an appropriate model for sustaining a $2 billion/yr burn rate.
So the question of where maps are going depends on the business model for maps. In a world where maps are sustained by device value, 300 million users makes it sustainable. In a world where maps are sustained by advertising, 1 billion users makes it sustainable. What else is there?
How about a world where maps are sustained by transportation services?
Uber's and other auto makers' interest in HERE shows a third business model. Accurate maps are a key to making vehicles autonomous. More so even than the value of the algorithms, precise imaging of roadways enables vehicle autonomy and the value of location gathering systems should grow to meet that future.
It's highly likely that Google's maps efforts are going to continue because they are fueled by a business model. That is also true for Apple's maps efforts, though they are fueled by an entirely different business model. Each of these business models fuels the improvement of the maps product but also of the maps gathering process. As these processes are expensive and licensing options are few there is little incentive to share the data. As a result the processes remain integral to the businesses.
This integrated-while-fueled nature means that maps makers will find it compelling to pursue adjacent business models, i.e. transportation services. It's not a matter of whether they will or won't. It's only a matter of when and where.
Searching for "iPhone killer" returns millions of hits. It's hard to remember any phone/product/service/platform/initiative/merger/startup which was not at some point considered an iPhone killer. A sampling is offered here.
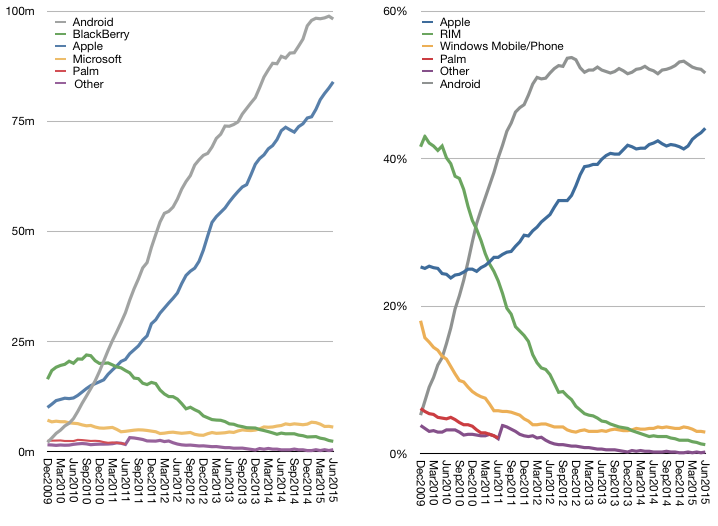
In reality, the killers seem to have all faded away while the iPhone continues. We could just shake our heads and move on, but a deeper analysis is possible. Take a look at the graph above. Note that iPhone's (and hence Apple's) ascent has not caused decline in its nominal competitors. When seen in the context of the graph above, the success of the iPhone has in fact been complementary to those companies who would be its killers.
Consider that the iPhone drives a large portion of Google's revenues as it is the home to many Google services and engagement through the iPhone is higher than any other platform, including Google's own. iPhone users tend to make better customers. In exchange Google pays a great deal for traffic acquisition on iOS devices. The placement of search on Safari is probably the biggest single cost item on Google's income statement ((Estimates are a few billion dollars a year.))
The iPhone example drew Google to build Android as a facsimile and that, coupled with Brobdingnagian spending on marketing, led to Samsung's Galaxy success. That success seems to have peaked and the brand is now a victim of low-end disruptors which copied it and the iPhone in turn. However, Samsung electronics benefits from the iPhone in terms of its semiconductor division. Apple is Samsung's biggest customer and the semiconductor division is now the largest source of operating profits.
The explosion of Android has led to IP licensing revenues for Microsoft and now Microsoft is extending its software applications to iOS, hoping to participate in the iOS ecosystem rather than competing with it. The time may come when Microsoft shows growth from the iPhone.
Finally, although it may seem oblique, Amazon is benefiting from the iPhone. Instead of killing it with the Fire ((presumably as a low-end disruption)), the iPhone and iPad offered much more mobile shopping opportunities to the Amazon store. Data shows that iOS leads in shopping traffic and order size precisely at a time when Amazon obtains its largest volumes. Amazon's AWS also handles a great deal of iOS-originated traffic.
This alternate reality shows that the benefits from the iPhone revolution are broad and deep. It's not just the direct revenues (($25 billion paid so far)) from app sales on the App Store but also the creation of entire new communications modalities (Instagram, Snapchat, WhatsApp) new services (Uber, Airbnb) and the multi-billion dollar accessories markets. These benefits are largely unmeasured and therefore not visible in accounting systems. They are perceivable however.
Users perceive the value, developers perceive the value and, in the end, the only account that matters, the brand, accrues these perceptions to grow in value.
As the brand flourishes, the perception of vulnerability dissipates and the narrative shifts from Apple getting killed to killing it.
It's taken eight years and 500 million loyal users but, perhaps, just perhaps, this change in perception is entering the collective consciousness.
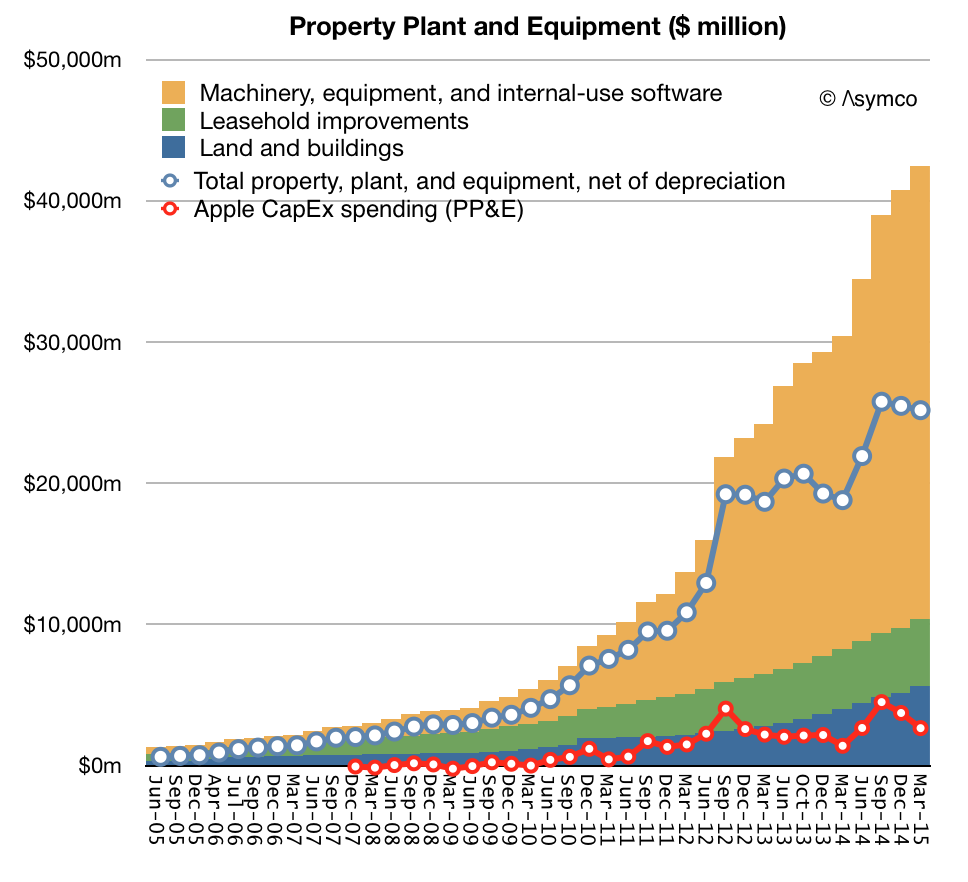
Of the $42.5 billion Apple spend buying capital assets ((Includes land and buildings $5.6b, Machinery, equipment and internal-use software $32.1b and Leasehold Improvements $4.7b)) more than half was acquired in the last three years. Net of depreciation these assets are currently worth $20.1 billion and the spending rate is about $12 billion per year.
This strategy of spending on capital assets is primarily in support of its particularly integrated approach to its product strategy. The purchasing of tooling for product manufacturing gives many benefits, including ability to deliver uniquely differentiated hardware, a predictable ramp and availability of parts throughout the product lifecycle.
One additional benefit (for us) is that we get to inspect the allocation of resources prior to production and therefore we can more easily forecast the product's supply. Spending on tooling happens in advance of production and the company also provides full year predictions of its spending.
The fiscal year forecasts relative to actual spending is shown below. Note the correlation with iOS units shipped one quarter after the spending was booked.
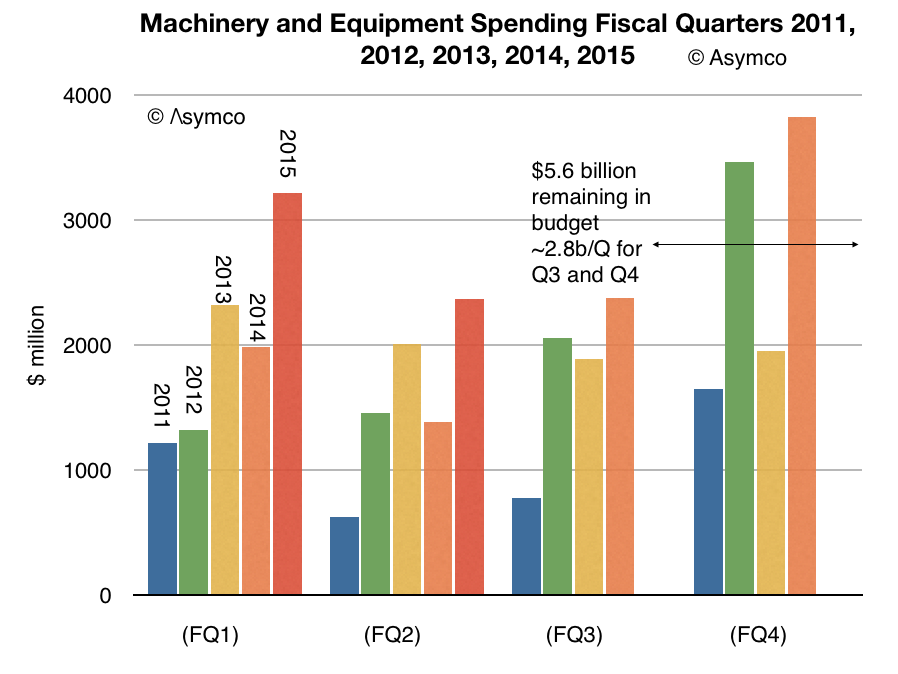
After reporting its second quarterly earnings, we received an update on what amount to half of the full year's spending giving us only two more quarters of variability. The current projections for the next two quarters imply about $2.8 billion per quarter spending.
The pattern from previous years is shown below for comparison. Note the Even/Odd year patterns.
The company also offered revenue guidance for FQ3 and therefore we can even make an educated guess on the next data point (57 million iOS devices) on the following graph:
The result is likely to be 120 million shipped between April and September.