Asymco

Asymmetric Intelligence

iPad

  1. Is Android more efficient than iOS at generating search revenue?

    Research · 63 comments

    Thanks to David Chu for forwarding the data that made this possible and reader Narajanan for spotting the divergence in platform efficiency.

    iOS and Android are both growing rapidly. According to Gartner, during the first three quarters of 2010, about 44 million iOS devices and 36 million Android devices were put into use. That's 80 million devices. An amazing achievement for two platforms that did not exist 3 years earlier.

    But obviously not all devices are used the same way. Devices which have unused capabilities limit network effects for a platform and for the category of product in general. Question is: how can we measure the "smartness" of a device; how much more likely is a device to be used as a mobile computer vs. being a regular phone?

    The best proxy I can think of is a measurement of browsing use. The smarter the device, the more browsing is a joy and the more it is actually done. Browsing leads to more data load on the network and creates a virtuous circle of revenues for the mobile computing value chain.

    If we could measure the increase in browsing generated by each additional phone, we could compare whether one platform is better (specifically, more efficient) at generating value asymmetric to voice.

    Fortunately we have data from Netmarketshare.com (see sources below) which attempts to track browser consumption and hence allows us to measure this variable. What we need to pair that with is the incremental increase in the installed base of devices.

    In the chart below I plotted how much browsing share increased for every phone sold by platform over the first three quarters of 2010.
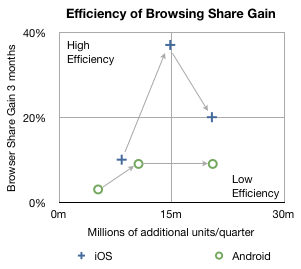
    The arrows indicate the sequence in time from Q1 to Q3. The vertical axis shows gain in share three months after the corresponding number of units shipped in the previous quarter on the horizontal axis. So, for example, the second circle means that in the second quarter approximately 10 million new Android devices created a gain of about 9% in browsing share. In the same quarter, 14.8 million iOS devices created about 37% gain in browsing share.

    In the third quarter approximately the same number of iOS and Android devices shipped (iOS  including iPads and iPod touch) but the browser gain was 20% for iOS vs. 9% for Android.

    A line drawn diagonally from lower left to upper right (0,0 to 30m,40%) could represent the average gain in share per units sold--the sort of measure we're looking for.

    Measuring that slope tells us that, on average, every million devices sold should generate a gain of 0.75% share[1]. I took the additional step of labeling two quadrants which are orthogonal to the expected trend. If browsing increases dramatically faster than 0.75%/million units then I call those devices sold as creating "highly efficient" browsing gain. If browsing increase lags dramatically below 0.75%/million units then those devices added share with "low efficiency".

    So four data points follow the trendline down the middle of the chart, however, there are two notable outliers. Finding the causes for these outliers gives clues to what's happening with the platforms.

    I believe the explanation for iOS's second quarter's extraordinary efficiency is that was the quarter when the iPad launched. It seems to have yielded a very strong spike and the trajectory of iOS improved even into the next quarter as those iPads continued to be in use. iPad seems to be a very effective way to gain browser share.

    I also believe that the cause for Android's fall in efficiency in the third quarter was that it began to be sold in large quantities in the developing world. The third quarter saw a rapid acceleration of sales without a proportional increase in what was measured as sales in the US (and Europe).

    Interpretation

    If this trend continues, and there is no guarantee that it will, then a question could be raised about Android's value to, of all people, Google.

    The core value of Android to Google is the increased use of browsing and hence search. All the other Google services and in-app ads are tiny opportunities in comparison to the potential of search on mobiles. One could argue that the raison d'être for Android since day one was to create browsing consumption. In that regard it's not as good at doing that as iOS is.

    Perhaps Google can justify the under-performance of consumption of browsing (and hence search) on Android devices as benign since there is no marginal cost added to supplying Android to non-consuming devices.

    But I wonder. There is the problem of opportunity cost: Those iOS devices that create more browsing activity are going to take more share. The more they do that the more Google will have to pay Apple for placement as the default search in mobile Safari.

    It may be a stretch, and perhaps the data is wrong, but that's what this exercise is all about: how much can we learn from fragmentary data? Without a hypothesis there is no discovery.

    -----

    Notes:

    1. Since these platforms have very low shares (less than 2% for iOS and 0.3% for Android by November) almost all the gains can be assumed to be against other browsers (e.g. Internet Explorer) and not against each other.
    2. Update: the original Unit estimates excluded iPad and iPod touch which have since been added.

    Sources:

  2. Analyzing the iPad as a computer: from a whisper to a roar

    Research · 31 comments

    [Goldman Sachs analyst Bill] Shope also expects both iPad and iPhone sales to exceed expectations in 2011; he sees sales of 37.2 million iPads next year, “which could potentially make Apple one of the largest vendors in the global personal computing market,” if you include both tablets and PCs.

    via Apple: Goldman Pounds The Table; Sets $430 Target - Eric Savitz - Tech Musings - Forbes.

    Apparently, it's not just the crazy ones who dare to think the iPad is computer.

    My forecast for iPad in calendar 2011 was set at about 33 million since last summer. I may raise it if Q4 units top 6 million.

    Meanwhile...

    He re-launched coverage of the stock for Goldman this morning, setting a Buy rating and $430 price target, while placing the stock on the firms “America's Conviction List.”

    I don't make stock price forecasts as they are based on a random number called 'sentiment'. But by forecasting earnings and assuming a range of P/E multiples between 15 and 20 (essentially in-line or below the S&P 500) values Apple's stock at between $360 and $480 by this time next year.

    Goldman's target of $430 is about in the middle of this range so I don't see it as requiring much in the way of conviction.

  3. Measuring iPad enterprise use

    Research · 25 comments

    I've noticed that there is a lot of speculation on the prospects for iPad use "in the enterprise". Business users could sure benefit from the device and anecdotal evidence does point to many cases of use in business.

    But anecdotes are not conclusive evidence. How can one make a better guess? Based on reader input, I thought I'd test this hypothesis directly on my own stats.

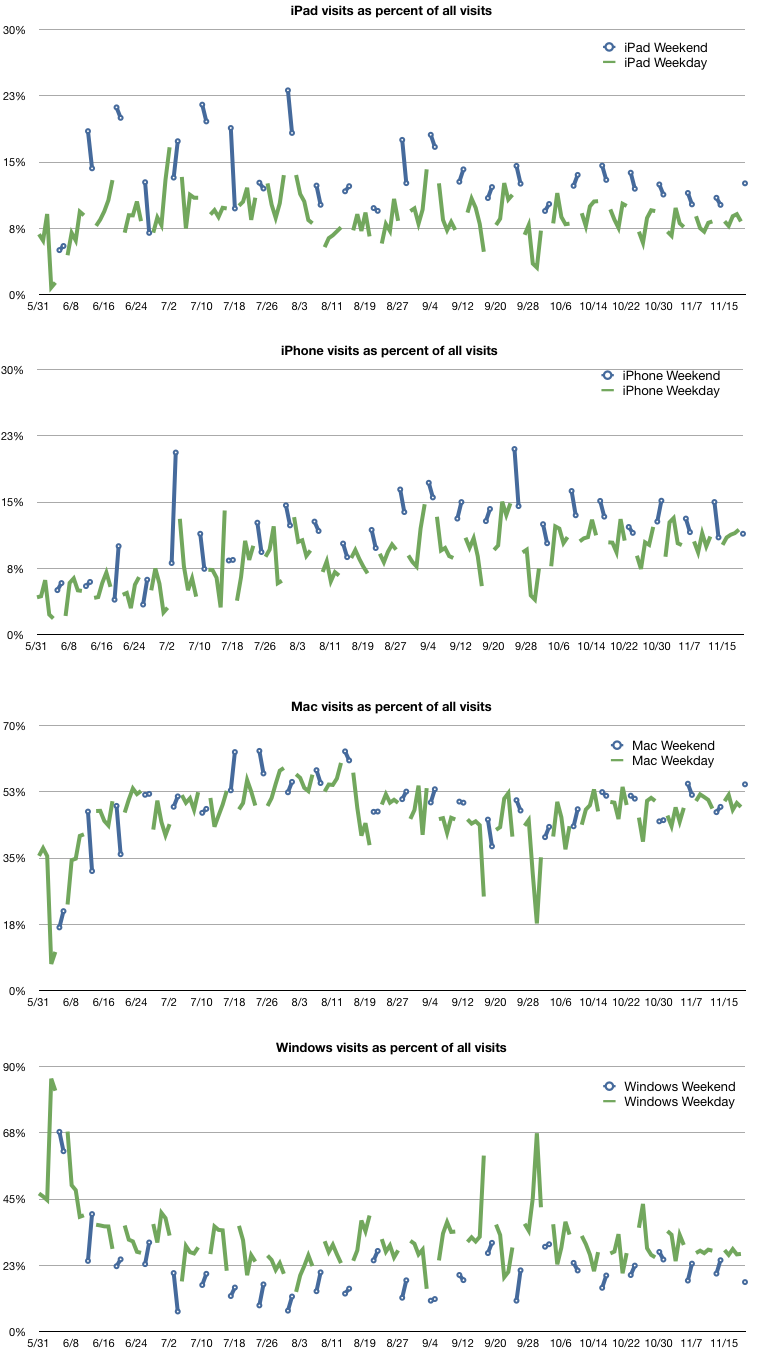
    As pointed out a recent posting on my stats, the iPad has been a popular device in accessing this site. 102k out of 1.06m views came from iPad users. A statistically interesting number.

    One way to check enterprise use is to measure the ratio of use of the product during weekends vs. use during weekdays. The logic being that weekend use is almost strictly consumer use and weekday use is mixed. Any normalized significant difference between the two measures should indicate a bias toward consumer use or vice versa.

    The following charts show the percent of each platform's use with weekends separated from weekdays.

    The larger the delta the more likely the more the bias one way or the other. To that end I measured the average percent of visits from iPad (as a total of all visits) for weekends and weekdays and measured the delta between the two. On the weekend the iPad was accounting for 13.3% of visits. On weekdays it was 8.8%. A difference of about 4.5% in favor of weekend use.

    To calibrate that figure I did the same for iPhone, Mac and Windows use.

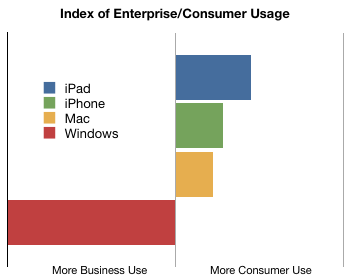
    The following chart shows this ad-hoc index of "enterprise use".

    Essentially the data is inline with assumptions. The iPad is the most likely to be hired by consumers. The iPhone is more than the Mac and they're all far more likely to be consumerized than Windows.

    The average consumption of Asymco.com through Windows was 32% of during weekdays but only 22% during weekends.

    In order to make this measure more meaningful, the evolution over time of these figures should be tracked. If the Blue bar above moves more toward the center then the chances are that iPad will be more adapted by business users, or at least more in use at work.

    Does this seem like a valid method for measuring relative enterprise use?

  4. The integrated iPad news daily: Read all about it!

    Research · 28 comments

    When I wrote my opinion on the future of publishing (Citizen Publisher), I focused my lens on books and magazines. Published works that have relatively low time-sensitivity and hence relatively long shelf life are quite different from newspapers which package material with very brief temporal relevance.

    The print-based news industry has suffered much more than print-based books and magazines. The primary cause is that "print" plays a far larger role in newsprint-based newspapers than in books.

    To give you an idea of how important the printing plant is, consider that a huge proportion of a newspaper's assets are tied up in its printing plant. That plant is so large and so demanding that it ends up causing the whole business to revolve around it: Print runs are done at night to make sure the product is delivered in the morning. That puts a hard deadline on the writers to submit stories before the product is "frozen" into a final edition. Writers and editors and advertisers need to march in lock-step to the cycle time of a big manufacturing operation.

    There are 19 presses and 17 printing plants that print the two million copies of the U.S. edition of The Wall Street Journal. To make changes to the plant require large amounts of capital investment and that capital's depreciation is an integral part of the financial balance of the company. So much so that one wit remarked that a newspaper is nothing more than an instrument that permits the depreciation of a printing plant.

    Costs of manufacturing have been slightly offset by better technology and distributed printing but newsprint itself has soared in price so the dependence on physical product has made the economics worse over time.

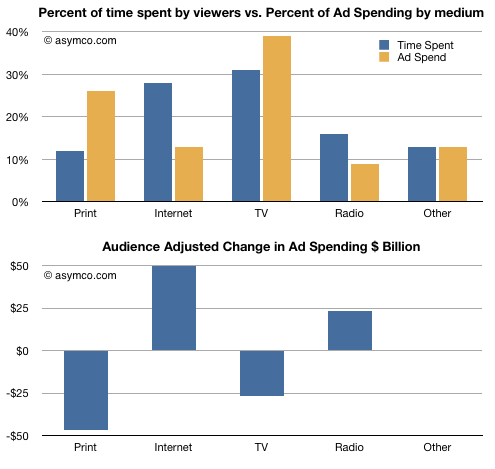
    That's the cost side. But if you keep following the money from the revenue side, you realize that the situation is critical. In the US, a large part of the local paper's revenue base was wiped out by Craig's list. Classifieds are a fading memory. With respect to regular ads, the story is almost as bad. 26% of ad spend in 2009 was allocated to print, while only 12% of time spent consuming media was spent on it. In contrast, Internet use is at 28% of time where only 13% of ad dollars are allocated.

    Source: Morgan Stanley Internet Trends Presentation.pdf

    It's inevitable that advertisers will shift their budgets to follow where the attention is going. Potentially that's a $50 billion shift into Internet advertising. The number nearly matches the $47 billion loss from print.

    This future is not far off. In fact, it's already happening. in recent years the number of newspapers slated for closure, bankruptcy or severe cutbacks has risen—especially in the United States, where the industry has shed a fifth of its journalists since 2001.

    Once the printing plant is taken out of the equation, the raison d'être of the package itself ends. For this reason, the newspaper product cannot survive on-line. Reading news is still very popular, but newspapers aren't.

    So will the iPad save this medium?

    As in Citizen Publisher, I argue that for that to happen, the medium needs its Orson Welles. Furthermore, to have him emerge, the business must be architected as an integrated approach to solve a new job to be done.

    The latest story from The Guardian suggests that Rupert Murdoch is working on just such an approach. In another interview Murdoch explained the project in more detail:

    What is the biggest thing on your mind now?

    ...There are so many disruptive technologies coming all the time! [This in almost a whoop of excitement.] Pretty. Damn. Interesting! Just trying to stay ahead of the technology. I'm starting a paper in six weeks. A brand new paper. It will be a bit like the New York Post . But it will be national. Have that sort of humour and attitude like the Post . It will only be seen on tablets. It will only employ journalists - and maybe eight to 10 technicians.

    What sort of circulation will you need?

    At the price we are talking about, that's $1 a week - not a day, a week - we need 800,000. By the end of next year there will be 30 to 40 million iPads. I believe every single person will eventually have one, even children.

    Via: afr.com

    What's more, it's suggested that an unreformed disruptor is mysteriously involved.  One can only speculate, but the hints of autonomy, dedicated (and incentivized) creative professionals involved in a new (not re-purposed) publication with a low-cost structure bodes well.

    The medium may get its Orson Welles after all.

  5. Why the Mac keeps growing

    Research · 63 comments

    When the iPhone vs. Android rhetorical war heats up, both sides bring up the history of Macs vs. Windows PCs. The commonly held thesis is that Windows triumphed as the PC was commoditized (and modularized). This triumph was at the expense of the over-serving and over-priced Mac.

    This is a largely accurate view of what happened during the 90s. But the problem with this thesis is that (1) the PC's job has been slowly changing in the last decade (2) the Mac keeps growing faster than the PC and (3) Apple keeps capturing a vast portion of the profits in the PC industry.

    These anomalies or contradictions to the thesis imply that something changed. What changed and can these changes turn the tables on the market and create an opportunity for a new computing disruption?

    The PC of the 90s was hired first by companies as a productivity boosting tool and second by consumers as a way to duplicate their work productivity and communications in their personal lives.

    However something changed with PCs when the laptop became "good enough". With portable computing, the job the PC was hired to do evolved. It was more important that the product be well designed (for aesthetic value, usability and reliability) than just fast and spacious. The microprocessors were plenty fast but what mattered more was low power consumption, a low profile and tighter integration with software.

    The product was also purchased in a different way. A desktop could be purchased on specs alone, sight unseen, from a catalog. But a laptop had to be touched, hefted and the screen had to be observed and the whole design contemplated before a purchase decision was made. The product had an integrated keyboard, display, touchpad and storage. It was not easily serviced by end users. It was, in a word, re-integrated.

    You can see how portability changed the job and therefore everything else as well. Consumer tastes became important, retail distribution became necessary and R&D resources had to be applied to solve what was no longer good enough: the whole package.

    Vendors which did not prioritize design, retail and R&D were left flat-footed.

    At the same time, systems software became more commoditized and productivity software became portable. The old measures of performance were being over-shot while the new measures of performance were under-served.

    While this shift was underway on the hardware side, Microsoft continued to improve their product to serve more demanding business productivity jobs. Their software was not getting optimized for this new portable consumer job. They left the new market open to disruption.

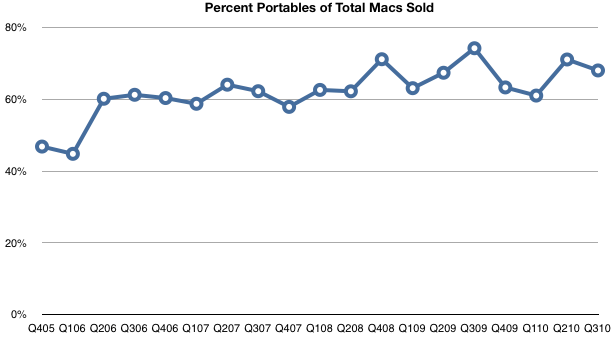
    In stepped the MacBook with good enough (and improving) office productivity. With excellent appeal along the dimensions of performance consumers demand most of all. It was priced higher than other laptops but the price points were affordable and, inflation-adjusted, lower than they'd ever been. It should not be a surprise that Apple was one of the first vendors to see its portables line become bigger than its desktop lines. The market evolved to the point where what Apple had was what the buyers needed.

    The shift to portability is a compelling story for Apple as disruptor in the PC market. It may not result in a complete reversal of the PC hegemony but it allows Apple to grow a product line at triple the growth rate of the market. A market that was considered completely dominated by entrenched incumbents with an unbreakable profit formula.

    But with the iPad Apple is clearly also aiming at disrupting the Mac (and, transitively, the PC as a whole.) The iPad can be seen as an evolution toward seamless portability; the mobile computing paradigm shift.

  6. Citizen Publisher

    Research · 11 comments

    In March this year Richard Stengel, managing editor of Time magazine, was speaking about the iPad.

    For a while many movies were more like filmed plays, until directors really learned to take advantage of the opportunities of the medium. For the iPad “The medium is waiting for its Orson Welles.”

    The idea that a new medium needs a new media is not novel. The implication that the new media needs a new genius to define it also follows naturally. However, the implications of new media for the creative industries that are built around them are more difficult to perceive. How are the structures of these industries shaped by disruptive innovations?

    Disrupting theater

    To see just how disruptive cinema was, consider the plight of acting talent. In the early years of the cinema (1890s–1900s), performers were not even identified in films. In other words, they were not in the "credits" and far from being "billed". The reason was that stage performers were embarrassed to be in film. Silent film was considered pantomime and since one of actors' main skills was their voice, they were concerned that appearing in films would ruin their reputations.

    Early film was also designed for the working classes, not for intellectuals. With peep shows as the original presentation format, followed by nickelodeons, film was seen as only a step above carnivals and freak shows. Clearly not something that an aspiring actor would want to be associated with.

    So here we have a classic disruption: The new medium was of a far lower quality than live theater. Even lower than the Vaudeville and Burlesque shows. It was, as many other disruptions are pronounced, a toy.

    However, it had a market--a profitable market. Over time, the product improved and within a few decades completely drained the profits from theater, leaving it to serve only the most demanding customers willing to pay high ticket prices and satisfying only their high brow tastes.

    So going from Theater to Cinema involved more than technological or technique innovation. It required business model innovation. Specifically, Cinema technology brought about the "Hollywood" industry, or more specifically, the Star System and the Studio System.

    The Star System was a branding technique designed to signal quality to the public. It remains a basic and fundamental innovation: celebrity as product. The Studio System was a production and value chain innovation.

    The integrated producer

    By the 1930s technological change led to a new value chain: vertical integration, ownership and effective control of distribution and theaters.

    During the Golden Age (early 20s to early 60s) eight companies constituted the Hollywood studio system. Of these eight, five were fully integrated conglomerates, combining ownership of a production studio, distribution division, and substantial theater chain, and exclusive contracting with performers and filmmaking personnel.

    The studios’ efficient, top-down control over all stages of their product enabled a new and ever-growing level of lavish production and technical sophistication.

    Readers may recognize this as the "inter-dependent" business architecture model.

    The studio system allowed iteration and innovation and factory-like efficiency in production. This architecture held sway as the technology remained relatively stable and the market for content expanded to cover most of the world's population.

    In the late 60s and 70s, modularity emerged as a more practical alternative and control over production was separated from distribution. (Theater ownership was removed by anti-trust action). The system that emerged gave more power to producers and directors (e.g. Kubrik) and the talent became independent of the studios.

    The new Welles

    Which brings me back to Orson Welles. Welles' masterpieces were the product of an industry that allowed innovation to happen. They were the product of an era. An era defined by integrated innovation and inter-dependent value-creating business with common ownership and control.

    So when print publishers today think about their future in the era of the iPad, they should consider their value chains and business architectures. Could the new Welles create the new iPad genres to jump off the screen if he worked in a regular publishing firm that outsources practically everything? Or will he emerge from a firm that operates an integrated value chain. A firm like Amazon that owns the device, the publishing system, the retail store and maintains direct relationships with readers?

    It's my opinion that before there is an Orson Welles of iPad there needs to be a Studio System and a Star System for iPad apps. The Star System is nearly there with the current App Store, but it needs discovery and a systematic way of promoting talent. The Studio System has yet to emerge.

    This does not bode well for traditional publishing houses aspiring to embrace the iPad. They are not in a position to create these Systems around this new media and hence to nurture the next Orson.

    It's perhaps ironic that Orson Welles' masterpiece "Citizen Kane" (1941) was the story of a publisher.

  7. 14 Percent of App Store apps target the iPad

    Research · 9 comments

    From Distimo (registration required):

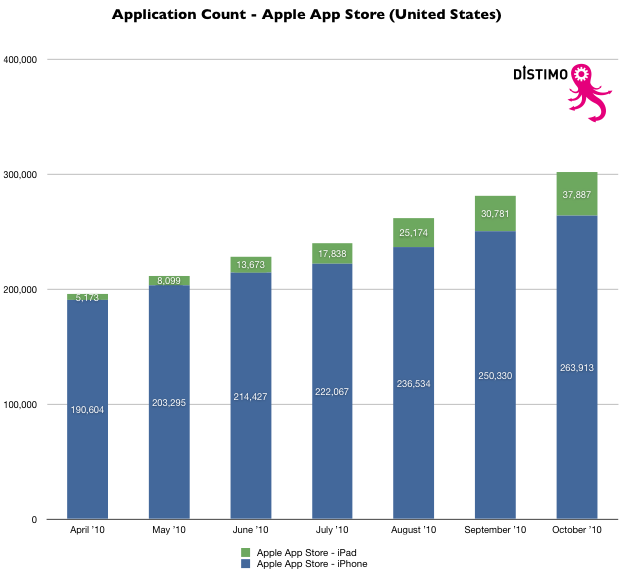
    • The number of applications in the Apple App Store has grown from just under 200,000 in April 2010 to over 300,000 in October 2010.
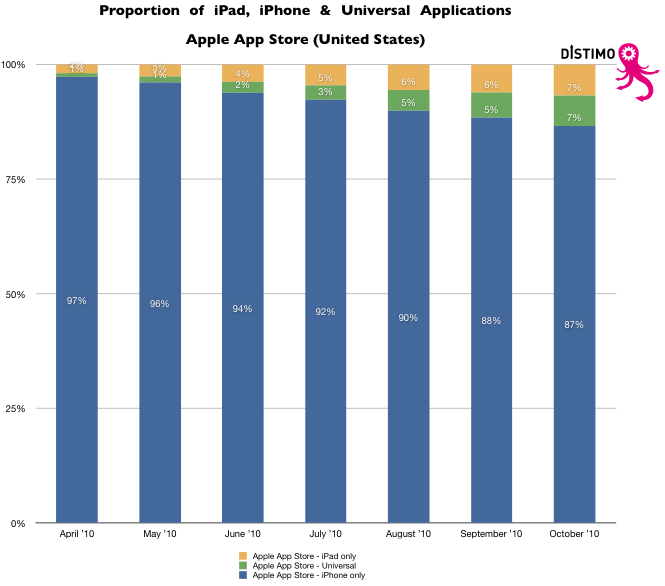
    • The proportion of iPad only applications outgrew the proportion of universal applications during the second quarter of 2010.This trend reversed in July 2010 with the proportion of iPad and universal applications in November being equal (7%).
    • The average price for an application in the Apple App Store for iPad increased from $4.34 in April 2010 to $4.97 in October 2010 (+14.5%). During the same period, the average price of an application in the Apple App Store for iPhone increased only slightly from $3.94 to $4.03 (+2.3%).
    • The average price of the top 100 paid applications in October 2010 is 171% higher in the Apple App Store for iPad than in the Apple App Store for iPhone; $5.80 compared with $2.14, respectively.
    • The lower average price of applications in the Apple App Store for iPhone is due to the fact that a large portion of paid applications are priced at $0.99 (45%), while only 24% of applications are priced at this price-point on the iPad.
    • Angry Birds was the top paid application in both the Apple App Store for iPhone and Palm App Catalog in September 2010. Angry Birds HD was the number three paid application in the Apple App Store for iPad.
  8. Postcards for Asymco: metropolitan distribution of views by operating system

    Research · 26 comments

    Based on a reader query, I tried to find out where, by city, my readership is concentrated. I also sought to break this audience down by operating system.

    Here are some observations:

    For the last 30 days, here are the top operating systems used to reach Asymco.com, with the number of views from each.

    1. Macintosh 153,768
    2. Windows 101,329
    3. iPhone 78,716
    4. iPad 34,878
    5. Linux 7,262
    6. iPod 5,516
    7. Android 4,869
    8. (not set) 1,236
    9. BlackBerry 447
    10. SymbianOS 396

    Looking at each OS, I can list the top cities where readers came from.

    Macintosh 153,768

    1. London 6,513
    2. San Francisco 5,316
    3. New York 5,089
    4. Cupertino 4,293
    5. Austin 2,589
    6. Sydney 2,182
    7. Helsinki 2,131
    8. Los Angeles 1,918
    9. Seattle 1,847
    10. Portland 1,482

    Windows 101,329

    1. London 3,827
    2. New York 3,275
    3. Helsinki 1,598
    4. San Francisco 1,504
    5. Seoul 1,409
    6. San Jose 1,260
    7. Chennai 1,226
    8. Sydney 1,116
    9. Seattle 1,100
    10. Melbourne 1,035

    iPhone 78,716

    1. San Francisco 5,203
    2. New York 4,406
    3. London 4,053
    4. Chicago 2,328
    5. Seattle 1,836
    6. Los Angeles 1,638
    7. Melbourne 1,430
    8. Seoul 1,402
    9. (not set) 1,376
    10. Sydney 1,261

    iPad 34,878

    1. London 1,759
    2. New York 1,060
    3. San Francisco 1,020
    4. Chicago 857
    5. Melbourne 739
    6. Outremont 694
    7. Santa Rosa 585
    8. Seattle 555
    9. San Jose 456
    10. Santa Clarita 440

    Linux 7,262

    1. San Francisco 376
    2. London 233
    3. Helsinki 180
    4. New York 131
    5. Cambridge 126
    6. Bangalore 109
    7. Nantes 109
    8. Sydney 107
    9. Perchtoldsdorf 93
    10. Paris 86

    iPod 5,516

    1. Eau Claire 471
    2. Melbourne 396
    3. Seattle 290
    4. Abuja 248
    5. San Jose 214
    6. Hudson 197
    7. Sydney 195
    8. Budapest 109
    9. Boston 95
    10. London 86

    Android 4,869

    1. Seoul 761
    2. (not set) 325
    3. Dallas 248
    4. New York 169
    5. Amsterdam 148
    6. Calcutta 131
    7. San Francisco 81
    8. London 74
    9. Los Angeles 74
    10. Bergen 72

    BlackBerry 447

    1. New York 121
    2. (not set) 78
    3. Waterloo 56
    4. London 50
    5. Buenos Aires 16
    6. Hong Kong 9
    7. Oldsmar 9
    8. Fairfield 7
    9. Wappingers Falls 6
    10. Boston 5

    Symbian OS 396

    1. Helsinki 216
    2. Kauniainen 23
    3. London 21
    4. Seoul 13
    5. Tehran 10
    6. Frederiksberg 6
    7. (not set) 4
    8. Chennai 4
    9. Krakow 4
    10. San Francisco 4

    The first surprise for me is that Seoul is the most popular source for Android views.

    The second is that London is so prominent. Although the US is the biggest source of traffic by far, London is a very concentrated source from the UK.

    The third is how there seem to be no Blackberry readers in the SF area.

  9. Apple's Growth Scorecard

    Research · 14 comments

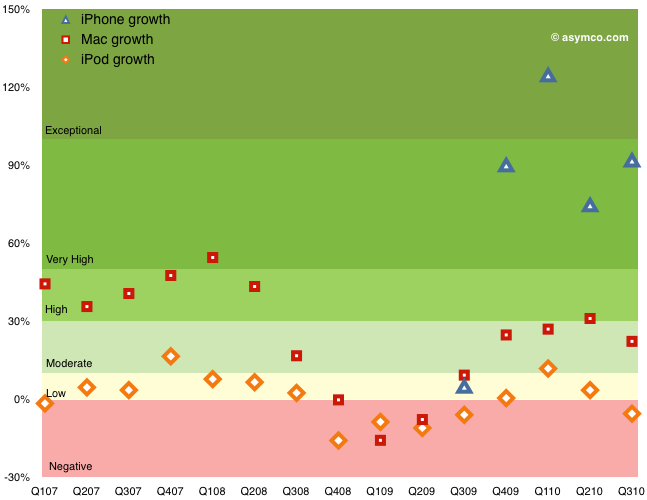
    Every quarter I try to score growth by top, bottom and product lines. As unforeseen growth is the only driver creating shareholder value, it's of paramount importance to measuring a company's performance.

    For Apple, the analysis is fairly straight-forward. There are relatively few product lines (seven including the iPad). I measure y/y sales growth and try to form a picture that is easy on the eyes and mind.

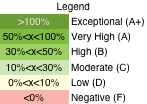
    The method I'm using now is color coding growth for each line according to the legend to the left.

    The table that follows shows each product plus the Net Sales and Earnings lines according to this color coding. I also added an average column for reference.

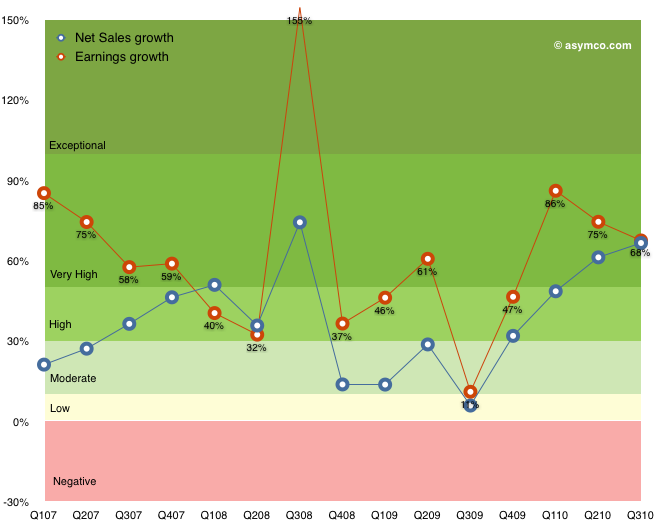
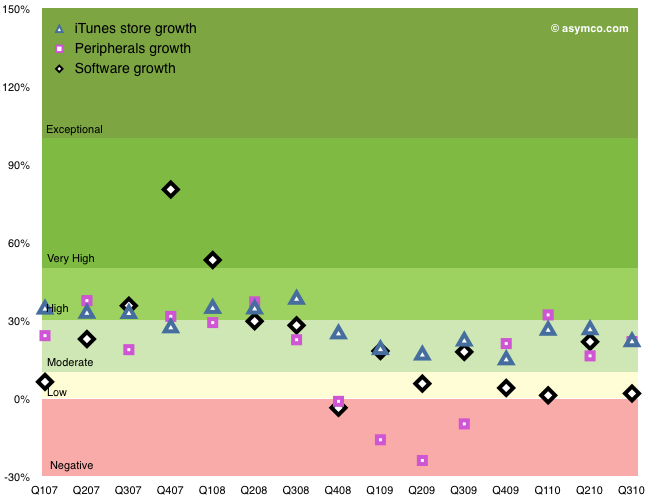
    The following graphs show the same data with color coding for the rates as they change over time. I broke the data into three charts: Top/Bottom lines, Hardware Products, Other Products.

    Discussion

    Hopefully this representation describes the company's growth without requiring too much explanation. Earnings growth, which determines ultimate value created is near all-time highs, well into the "Very High" (A) growth band. Apple have recovered from the Moderate-to-High (B/C) bands during the recession and are near the levels of 2007 when the company was trading at a P/E of 50 (today's P/E for Apple is 20). Sales growth broadly followed earnings growth.

    Within the products, the iPhone again shows exceptional performance. The growth during the first five quarters was (literally) off the scale (above 150%--see table for actuals). The average quarterly y/y growth has been 234%! Last quarter's 92% growth is very near the 100% threshold for exponential growth. This after three years in the market.

    The Mac growth is Moderate (B) and that may be because it was not a launch quarter for portables. The Mac underwent Very High (grade of A) growth for a period of 2008. The iPod shows weakness. The product has been in a Low-to-Negative  (D to F) band of growth since the iPhone launched. Clearly a mature product line but one which has been largely subsumed into the iPhone and iPad. The iPod touch is increasingly a large proportion of the iPod line.

    The non-hardware product lines are Low-to-Moderate growth products. The Peripherals business tracks very closely to the Mac business and dipped negative during the recession.

    Overall, the growth scorecard is in the "Very High" category, or a grade of "A", mostly driven by the iPhone and iPad. Whether this growth will be reflected in the share price is a question reserved for a future discussion.

  10. Visualizing iPad vs Mac

    Research · 23 comments

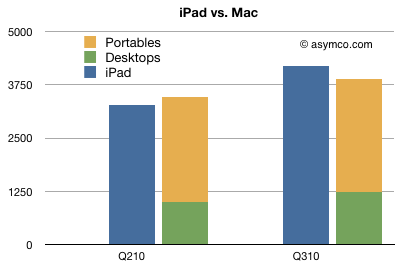
    The iPad outsold the Mac after two quarters in the market. It's important to understand the effect the iPad is having on PCs. Data is trickling in that potential notebook buyers are "postponing" purchases due to the iPad. The netbook market has witnessed a significant slowing which has trickled down to the performance of everybody in the value chain, from Microsoft, to PC vendors, Intel, AMD and retailers.

    So naturally we need to ask how it has affected the Mac.

    The following chart shows how the iPad has outsold the Mac the past quarter. The iPad was on the market for six months while the Mac has been for sale for 322 months--a shocking achievement.

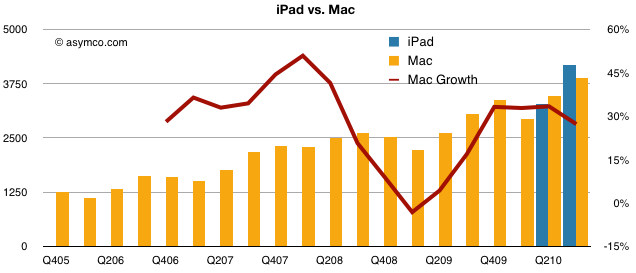
    But the Mac has not slowed down. It grew faster than the overall PC market (units grew at 27.3% and revenues grew at 22%) as it has grown for most of the past 18 quarters.

    The performance is also highlighted in the following chart showing the history of the Mac units by quarter over nearly five years. The Mac had a slowdown during the recession but the dip in growth in the last quarter does not seem significant.

  11. Analysts predict iPad sales (part IV)

    Research · 8 comments

    So far Apple has sold 7.458 million iPads and there is still a quarter remaining in the calendar year. The highest forecast immediately after the launch of the product was 7 million.

    For the record, in January I forecast 6 million units for calendar 2010 (and 10 million in first 12 months of sales).

    All analysts polled grossly underestimated the iPad. My impression is that competitors are still in denial.

    How many iPads will Apple sell? - Apple 2.0 - Fortune Tech.

    Unit sales 2010 (millions)2011
    Brian Marshall, Broadpoint AmTech7.013.0Calendar
    David Bailey, Goldman Sachs6.210.1Calendar
    Kathryn Huberty, Morgan Stanley6.09.0Calendar
    Shaw Wu, Kauffman Bros.5.010.012 mos.
    Gene Munster, Piper Jaffray3.58.0Calendar
    Ben Reitzes, Barclay's Capital2.97.3Fiscal
    Keith Bachman, BMO Capital2.55.5Fiscal
    Jeff Fidacaro, Susquehanna2.13.8Calendar
    Chris Whitmore, Deutsche Bank2.04.0Calendar
    Bill Shope, Credit Suisse1.87.4Fiscal
    Scott Craig, Merrill Lynch1.23.7Fiscal
    Peter Misek, Canaccord Adams1.23.5Fiscal
    Doug Reid, Thomas Weisel1.16.8Fiscal
    Yair Reiner, Oppenheimer1.14.0Fiscal