The problem with getting better is that if you're more than good enough you're actually getting worse. Improving beyond the point where your improvements can be absorbed is not only wasteful but it's also dangerous. It opens the door to competitors who compete asymmetrically.
This is the perverse and pervasive threat hanging over all system vendors. The temptation to "get better" is not coming from incentives and human nature. It's always there as Moore's Law offers an exponential increase in power. People don't naturally have exponentially increasing needs. For them to absorb this new power, it has to be couched in new uses.
What has permitted the absorption of improvements in semiconductor performance (and production) have been other aspects of the system: the software, communications and services innovations have been positioned on more demanding jobs to be done which, once hired for those jobs, saturate the available processing and storage.
This is most easily evident in how digital photography has advanced. The constraints on sensors meant that quality was initially poor and as cameras were unconnected, they were relatively under-utilized. But once software and communications were added (by inclusion in smartphones) digital photo creation exploded. This, in turn, led to more storage needs both on the device and the servers. In a virtuous cycle, more processing power meant video was possible, then high definition video, then slow motion high definition video. The previous storage limits on mobile devices were quickly overwhelmed. Megabytes of storage became gigabytes and then hundreds of gigabytes. Video editing meant processing power was suddenly in demand again. Cores multiplied.
Third party media (music and videos) storage and playback used to be the main job that storage was hired to do ((Which was far more demanding than office-like documents)) but as cameras got better, user-generated content suddenly bellied up to the bar.
That is now the story for phones, which are gobbling up all the storage and bandwidth we can throw at them. But what about the larger form factors? Are iPads (and laptops) growing in their demands? Paradoxically, it would seem that the smaller devices are hungrier than their larger cousins.
The answer lies with the jobs to be done. If highly portable devices are more usable, they will be used more. Large devices are left behind, literally, because their jobs are not as pervasive in place and time. For a large screen like the iPad to increase its attractiveness, it has to be the stage for a set of jobs that only it can perform.
The new iPad has the horsepower. It has more portability (thinner, lighter) and it has the touch ID convenience. It even has a better camera. But for it to succeed it needs to be hired for a set of jobs as expansive in usage as the user-generated photo/video jobs that the iPhone has been called to do.
I hire my iPad for one such job: to persuade audiences small and large. I use it across a dining table and across an auditorium to appeal with a visual language. I use Perspective to create stories that have to be seen to be believed and once seen, create belief.
The tool is demanding however. As the stories are fed by data and the visualizations are rendered algorithmically and not as stored images it is hungry for processing power. I also need it to record performances which taxes storage. I need to transmit those performances both in real-time and as recordings, tasking the WiFi and cellular bandwidth. I need as much screen as I can get to be able to interact with the elements on screen, of which there may be hundreds. I need to export video versions of performances and thus I need a video studio with all its extravagance. I need it to run for all-day workshops connected to a projector, sometimes through AirPlay, under stage lights, which pushes the battery.
Consider my last padcast. It was recorded in one take lasting 18 minutes. I then exported the results to a video that was uploaded to Vimeo and viewed by thousands. However it took over one hour to render it and due to that constraint I did not have the luxury of editing it. I could not easily add, subtract or annotate the video production. This was done on an iPad Air and I was happy to get it done at all.
But if I had an iPad Air 2, not only would production time be shrunk ((To about half the time)) the things I could attempt to do with a presentation suddenly expand. It's not just about more efficiency but an expansion of scope. More power means more work I choose to do.
So is the new iPad better? As far as the jobs I hire it do do, the new iPad is better. It is in fact not good enough. Which is the best thing to be.
Q: Do you expect to see a sapphire cover on the new iPhone(s)? Is that material significant?
I expect Sapphire will become a signature feature across many products. I don’t know if they will have capacity to deploy on iPhone this year but on a watch it’s essential. Here’s a clue: if the screen has any curvature, especially around edges, it needs to be sapphire as glass can’t take strain in that shape. The scope of the plant they are building with GT implies that they will have massive volume potential with at least one major iPhone model using the material. It’s a significant material because it allows design freedom in new directions, especially curved (concave) touch surfaces that retain a jewel-like feel. This has Jony Ive all over it.
Q: Is it fair to conclude now based on the 5C and 5S that Apple will never launch a “cheap iPhone”?
Oscar Wilde said a cynic is someone who knows the price of everything and the value of nothing. When I see the word “cheap” I never know if it refers to price or value. And even when we talk about price, an iPhone is cheaper than buying all the things it replaces so it’s always been a low end disruptor in my mind. (I saw a tweet with an image of a Radio Shack ad from the 1980s and every single item available on that page is now a part of the iPhone. It would have cost thousands to buy all those things back then–and dollars were worth a lot more.) Furthermore, I think Apple holds a black belt in pricing. They seem to define their position in the market by anchoring certain prices and “owning” them. Given all that I would say that Apple is not going to move their price points much. They will expand the portfolio and offer some iPhones at $300 but they will be older models. The average selling price (ASP) I expect to remain constant on a year-long average.
Q: In the past, Apple critics were quick to dismiss the new iPad and 5C iPhone as failures upon their introduction. You never judge. You just report the facts and data. That said, is there anything about past new Apple products launches that we should look at as a predictor of how a new iWatch might be received by customers?
When the iPad was imminent the great debate was over whether it would run iOS or OS X. Many imagined a touch-based Mac rather than the “big screen iPod touch”. It was a tough call and one which Microsoft could not and still does not make. Therefore, the interesting question for me with respect to iWatch is: What OS it will run? I will be shocked to the core if it does not run iOS. It is my opinion that making iOS work on it is the entire reason Apple is sweating this segment. They are in it because they are trying to make a platform product with a novel user experience and all the power of an ecosystem run on a wrist. It’s as big a problem as getting a phone-sized device to run a touch UI was in 2007. That is the crucial contribution that Apple is making to this next generation of computing. Now you might ask what users are asking for in this segment. The answer is nothing. Nobody is asking for this. As nobody asked for the iPhone (or the Mac or the iPad). It’s a new computer form factor and how it will be used will be determined by the apps written for it. But it will work and be magical out of the box in version 1. This is in contrast to the single purpose or accessory model of wearables we see to date.
Q: As a student of disruption, where is Apple most vulnerable to being disrupted?
Apple is a new market disruptor but much of what is put forward as a threat to it is low-end disruption. I think Apple knows enough about how that happens that it can manage its way around it. The strategy they employ is one of attrition. If you wait long enough a low-end threat tends to wear itself out as it starves of profit and is constantly gnawed-at by alternatives. (You see, if the disruptor cannot manage a profit then they cannot climb up the trajectory to get on top of the incumbent. Being profitable is a key requirement for successful disruption in the long term.) The attrition strategy works as long as you have the fortitude to hold out and the deep pockets to keep improving your product as alternatives flame out. It is my belief that Jobs made sure that thinking is inculcated in the company. So if not low-end is the company vulnerable to new-market disruptors? This is more subtle and the threat here is what Google/FaceBook/Amazon and the other ecosystems are all about. It’s creating new usage models and shifting where consumers place brand value. I think this is more what keeps Apple’s management awake at night. They are not standing still however. iTunes and Software and Services (now with Beats on board) is the way they are staying on top of that threat.
The Re/Code conference begins this week, and Apple executives Eddy Cue and Craig Federighi will be answering questions from Kara Swisher and Walt Mossberg.
Here are some questions I hope they ask:
For Eddy Cue:
Why is there no app store for Apple TV? Even though the product is running essentially the same hardware and software as the iPhone and iPad and iPod touch and even though it connects to the iTunes stores, there is no option for developers to build apps for it or for consumers to use their TVs to run iOS apps. I might add that it’s been seven years since the platform launched and that’s a long time to wait.
As Amazon has been granted a monopoly on the distribution of ebooks by the US federal government, why not compete by selling ebooks as apps? Apps were used as ebook containers well before the iBookstore launched and there were tens of thousands of “book apps”. Why not encourage authors and publishers to build apps by offering tools which make it easy to do so? I might add that if you do this for authors, why not do it for musicians and video producers? Why have separate stores for different media when they are all just content?
YouTube is becoming the TV of choice for millions. Before it becomes that choice for billions, what are you doing to encourage user-generated video content distribution through your ecosystem?
Apple’s Services revenues are growing remarkably quickly. The number of users is over 800 million. Do you see an opportunity for services to become a more independent business at Apple? In other words, why not bring iTunes to Android?
For Craig Federighi:
Marc Andreessen uses the phrase “Software is Eating the World” to describe the disruption that software-enabled businesses are having on those who don’t depend on software. You are the head of software at Apple; what’s on your plate? In other words, what do you see the opportunity for software at Apple beyond enabling device sales? I might add that although you are leading Software Engineering at Apple, Software and Services are part of Eddy’s organization. Does this separation make sense?
It’s likely that iOS will be used by more people than Windows in the near future. What do you see as the obstacles to iOS replacing Windows for what most business users use daily?
If you believe that iOS can replace Windows (at least in some tasks), do you think the iPad will ever replace the Mac?
This was originally posted on LinkedIn on May 28th.
iPad sales were unexpectedly slow in Q1. Tim Cook explained it as follows:
iPad sales came in at the high end of our expectations, but we realized they were below analysts' estimates and I would like to proactively address why we think there was a difference. We believe almost all of the difference can be explained by two factors.
First, in the March quarter last year we significantly increased iPad channel inventory, while this year we significantly reduced it.
Second, we ended the December quarter last year with a substantial backlog of iPad mini that was subsequently shipped in the March quarter whereas we ended the December quarter this year near supply demand balance.
We continue to believe that the tablet market will surpass the PC market in size within the next few years, and we believe that Apple will be a major beneficiary of this trend.
Tim Cook went on to say "over two-thirds of people registering an iPad in the last six months were new to iPad"
In a later discussion, Luca Maestri said:
As Tim explained earlier, our iPad results and the comparison to the March quarter last year were heavily influenced by channel inventory changes. Specifically, this year we sold 16.4 million iPad into our channel and sold through almost 17.5 million, reducing our channel inventory by 1.1 million units.
Last year, we sold over 19.4 million iPads into our channels and sold through 18 million, and therefore increased channel inventory by 1.4 million units. As a result, the year-over-year sell through decline was only 3% compared to the sell-in decline of 16%.
We exit the March quarter with 5.1 million of iPad channel inventory which left us within our target range of four to six weeks. iPad continues to lead all other tablet by far in terms of user engagement, size of ecosystem, customer satisfaction and e-commerce.
In a later Q&A:
Steven Milunovich - UBS Securities: Tim, I understand that the iPad is not as weak as it appears on a sell-through basis, but still it's relatively flat over the last year in terms of sell-through. What are your thoughts in terms of why that is and can that accelerate with Office on the iPad going forward?
Tim Cook - CEO: It's a good question. Let's talk about iPad a little more than we did in the comments.
When I backup from iPad, here is what I see. It absolutely has been the fastest growing product in Apple's history, and it's been the only product that we've ever made that was instantly a hit in three of our key markets, from consumer to business including the enterprise and education.
And so, if you really look at it in just four years after we launched the very first iPad, we've sold over 210 million, which is more than we or I think anyone thought was possible at that period of time. It's interesting to note that that's almost twice as many iPhones that we'd sold in a comparable period of time, and over seven times as many iPods as we'd sold in the period of time.
So, I think it's important to kind of to put that in perspective. We've come a long way very, very quickly. Looking at it by market a bit, which I think is important. I think Luca mentioned a little bit of this in his comments. In the education market in the U.S., we have a 95% share. So the focus in education is on penetration, is on getting more schools to buy and my belief is the match has been lit, and it's very clear to the educators that have studied it is that student achievement is higher with iPad in the classroom than without it. So I'm confident we've got a really great start in education far beyond the U.S. now. This is happening in many, many parts of the world.
In the enterprise market, we're seeing virtually all, 98% of the Fortune 500, they're using iPad. We're seeing – according to Good Technology who looks at activations of tablets – the latest data we have from them is that 91% of the activations of tablets in enterprise were iPads. So this is also an astonishing number and many of those enterprises are writing apps that are key proprietary apps for running that business, and this is great for that company because they're more productive as a result of that. So once again, just like in education in a way, what we have to do in enterprise is focus on penetration, it has to be deeper and broader.
But in terms of having people begin the process, beginning writing apps, we're doing a pretty good job of that. In the retail market, if you look at the U.S. as a proxy, the NPD numbers for March just came out a few days ago and we had 46% share and embedded in that 46%, there's a lot of things in there that I personally wouldn't put in the same category as iPad, and that are weighing the share down. It's certainly a market we wouldn't play in and in a type of product you would never see an Apple brand on. So, we feel like we're doing well there.
Office; I believe does help. It's very unclear to say how much. I believe if it would have been done earlier, it would have been even better for Microsoft frankly, there is a lots of alternatives out there from a productivity point of view, some of which we brought to the market, some of which many, many innovative companies have brought. But I do see that Office is still a very key franchise in the enterprise, in particular. I think having it on iPad is good, and I wholeheartedly welcome Microsoft to the App Store to sell Office. Our customers are clearly responding in a good way that it's available. So, I do think it helps us particularly in the enterprise area.
The other things you look at on iPad that are just blow away its customer [satisfaction], is 98 [percent]. There is almost nothing in the world with a 98% customer sat and the intention-to-buy numbers look good with two-thirds of the people planning to buy a tablet or planning to buy an iPad. The usage numbers are off the chart, far and exceeding Android tablets, four times the web traffic of all Android tablets combined.
So, when I backup from all of these, I feel great. That doesn't mean that every quarter, every 90 days is going to be a number that everybody is thrilled with. But what it means to me is that the trend over time – over the arc of time, that things look very, very good, that iPad has a great future. And of course the thing that drives us more than any of this are the next iPads if you will, the things that are in the pipeline, the things that we can do to make the product even better, and there is no shortage of work going in on that nor any shortage of ideas.
So when I backup from all of this, I can't help but still be extremely excited about where we are. I think we did a reasonable job of explaining what we think the disconnect was between what we had expected, which we hit it at the high end of our expectation and the street's view of this one. I believe the vast majority of it is that first thing was just channel inventory that maybe we should have been even clearer on last quarter to take into account. But I'm very bullish on iPad.
That's quite a long set of explanations for was essentially was a flat quarter for the iPad. I can't add more to this, but I do want to focus on the bold part of the quote above. "But what it means to me is the trend over time – over the arc of time, that things look very, very good".
How can we see the long arc of time?
The tool I've used for this is the measure of penetration. Historically products which become "mainstream" or widely adopted follow an S-curve during that adoption. The curve is remarkably predictable given a limited set of points. I've discussed how the adoption of smartphones is predictable in the US, EU5 (( And UK specifically and several broader global regions)) and how even particular platforms might be predictable in the context of rates of adoption.
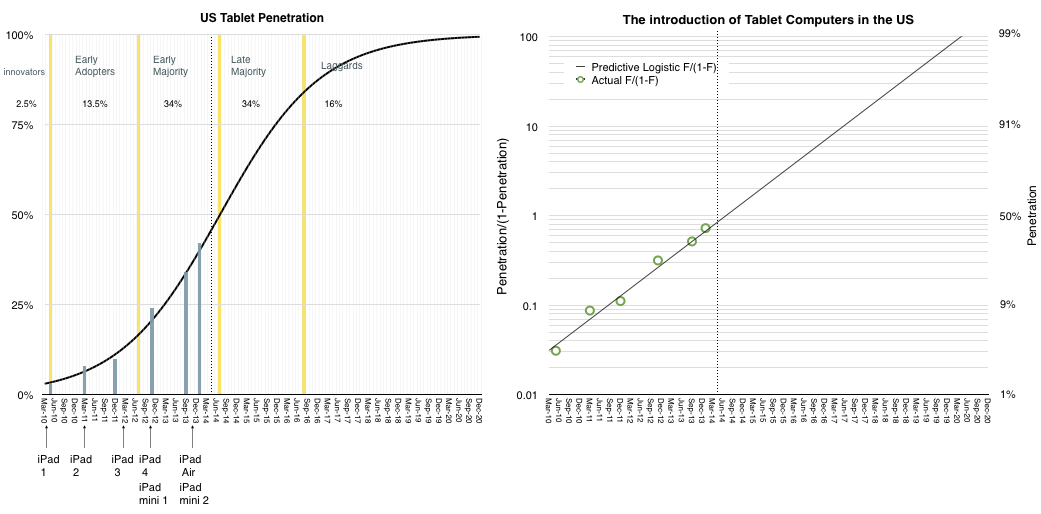
We are fortunate that data also exists for tablets. The Pew Research Center's Internet & American Life Project has published a short history of tablet adoption in the US. I've plotted this data and imposed an S-curve on the data which fits it rather closely.
The results are shown below:
In the graph on the left, the blue bars represent actual measurements of penetration (18+) while the black curve represents a best fit for the adoption rate.
Note that I've added the launch dates of all the iPad models and sectioned the curve into adopter categorization on the basis of their willingness to adopt.
I've also drawn a dotted line on the point where we are in the present.
In the graph on the right I've also duplicated the data using the transform of penetration to log scale penetration/(1-penetration). This shows the relative fit of the data in a more visually comfortable way.
The usual caveats apply:
This is US only
These are adults only
The iPad is not the only competing product
Nevertheless, this is a fairly strong proxy for the market. First, because the US has been leading adoption of almost all consumer product categories in history. Second because adults are a representative sample of users and third because iPad is market share leader.
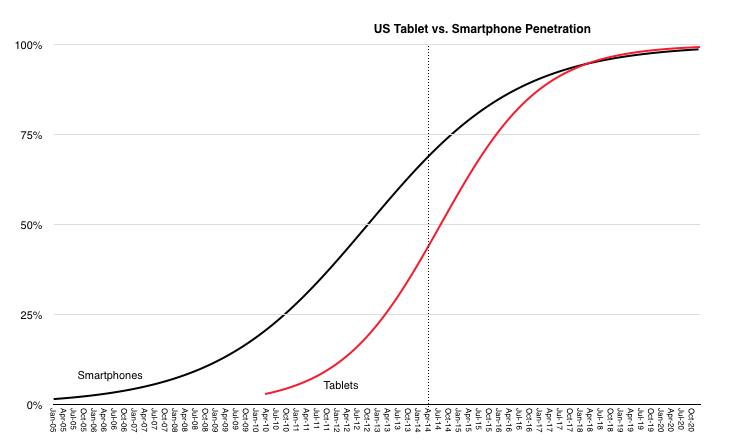
What the penetration data shows is an extremely rapid rate of penetration. In comparison with the smartphone, the tablet is rising much faster. This is shown below:
They are likely to saturate at around the same time but the tablet started much later.
So how does this explain the slowing iPad sales?
It's possible that saturation for tablets could come well below 100% and that we are on a different curve than the model above. However, the ubiquity of the product and broadness of appeal, even within non-consumer (i.e. education and enterprise) makes it difficult to reconcile. In addition, the penetration data is self-evident. It's improbable that penetration goes to 42% as it just did, and then stops suddenly. These decelerations of adoption have been observed historically but they are usually explained by cataclysms such as wars and economic contractions, neither of which are affecting the US right now. If a product solves an important "job to be done" then it gets adopted in a predictable way by a given population.
The anecdotal evidence provided by the company and others coupled with the survey data collected for the population of US users implies that the iPad is solving numerous important jobs and is therefore continuing on a predictable trajectory and that a discontinuity has not occurred.
Management started by saying the iPad sales volume was not surprising to them and that they have not changed their long-term expectations. The penetration data seems to support their confidence.
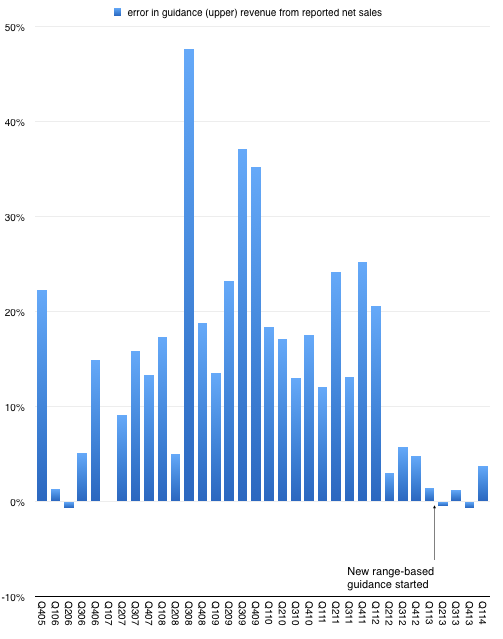
After n quarters of predictability, Apple surprised with sales performance that was 3.74% above the top of their guidance. This may not seem significant but since instituting a new range-bound guidance method in Q1 of last year the company reported revenue within about 1% of the top of the range.
This is in stark contrast to the wide variance in prior years. The following graph shows the "error" in guidance as the percent difference between reported sales and guidance ((Upper end of range in quarters where a range was given.)).
So prior to last quarter we were lulled into thinking that guidance was very nearly perfectly predicting the company. As I tweeted, it took the "sport" out of trying to do any forecasting. All an analyst had to do is tweak the main product growth figures to hit the sales target and then subtract the (generously provided) operating expenses and (also provided) tax rate to get the earnings. Only unknown to getting to an estimate of EPS was how many shares would still be outstanding. ((The company itself would not know shares outstanding as their buying was opportunistic during the quarter.))
Knowing Apple also means that average selling prices are also very rigidly set in stone so the degrees of freedom in analysis were becoming highly constrained.
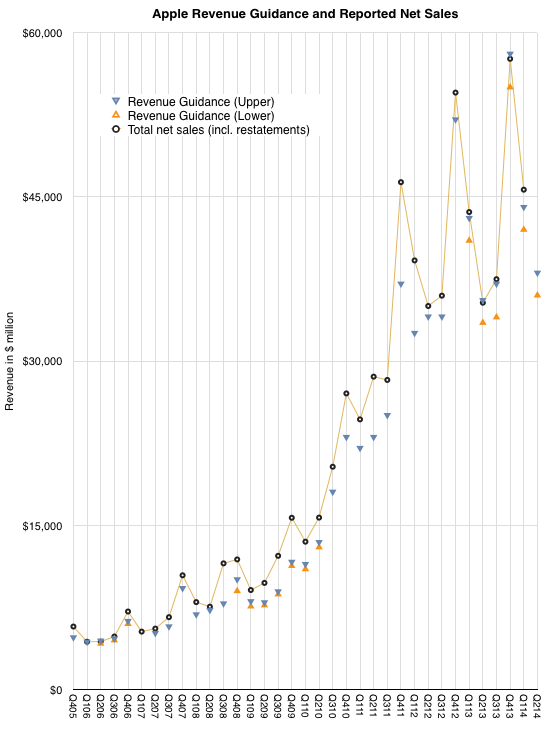
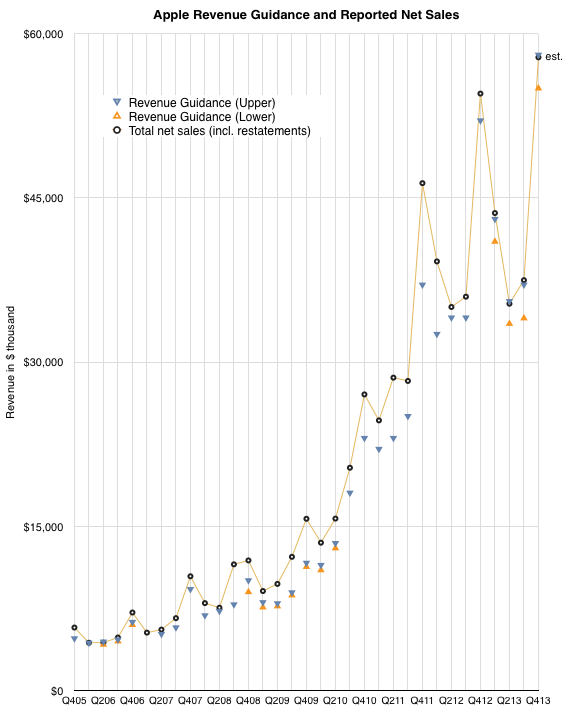
But just when you think you spotted a pattern, it changes. The company surprised with performance outside the band. The following graph shows the estimate ranges it has given and the actual revenues delivered. ((Next quarter is also pencilled in.))
So what happened?
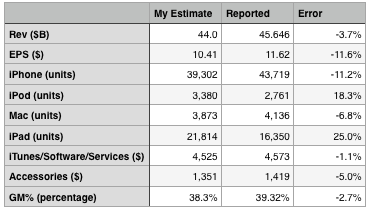
The answer seems to be better iPhone performance. The following table shows my expectations, which were tuned to return revenues exactly at the top of the guidance range.
On product shipments/sales I underestimated the iPhone and Mac and overestimated the iPad and iPod. I estimated iTunes accurately and underestimated accessories by 5%. I also generally got the blend of margins fairly close, being 1 point too low on gross margin.
The bottom line was that the Revenue and Earnings surprise could be accounted for through a significant outperformance on iPhone which offset a less significant underperformance on the iPad.
The iPhone grew sales by 14% which more than offset a drop of 13% in iPad sales and was enough to allow net sales to grow by 5%. Since the company guided nearly flat growth, that 5% was a big surprise.
Now one could ask whether 14% growth in the iPhone revenues is a meaningful change in the long-term evolution of the category. This is a difficult question. The way the iPhone is positioned makes it a great success in the premium segment of the market but it does not place it in competition with the perhaps 80% of the market which seems to be defined by a lower price point.
However let's not forget that pricing is correlative to the market but it may not be causal. Purchase decisions are complex and price is one aspect of that decision. But there are many others. Availability, channels, service, brand all play parts. The error of many analysts is to conclude that price and price alone is causal to behavior. That may be so with commodities, but let us not forget that these products and their uses are newly created and how value is perceived has been changing rapidly. Buyers follow a learning curve in terms of discovering the uses and value of products. These learning curves can be modeled and usually show several years (sometimes decades) for most populations between early and late adoption.
We don't know where the iPhone is on the learning curve for any particular region and that means we can still be surprised by how it grows.
When trying to assess the success of an ecosystem, the primary measure is the size of the user base or the "audience" for the product. Companies like FaceBook and WhatsApp and Twitter are measured first and foremost on this metric. Companies like Google, Amazon, Apple and Microsoft are less so. When revenues are firmly attached to products the focus shifts to "follow-the-money" rather than "follow-the-users" metrics.
That's as it should be, but for the sake of understanding the competition between ecosystems, they should be compared on some similar basis. If the basis of competition in this day and age is ecosystems ((As Microsoft, Apple and Google seem to agree it is.)) how does one evaluate Facebook's vs. Microsoft's? Or, more poignantly, how does one compare WhatsApp's valuation with that of iMessage?
It's common to value a company which aggregates audiences at a multiple of that audience size. The implication being that each member of the audience returns a certain cash flow to the aggregator and the discounting of those flows is the net present value. Which is why, for example, a newspaper is valued in terms of its subscribers. As is a TV network and as might be a social network. Using this metric, a WhatsApp (i.e. free messaging) user is worth $40 and the average social media user may be worth around $100. ((The degree to which a user is actually worth the sum of all the subscriptions she may have made is a good topic for discussion.))
The implication is that users/subscribers/audience members are loyal and will stay with the programming for some time. There is also a second implication that businesses which are not measured by audience size don't have this loyal and recurring revenue base. The absence of an "audience" implies transience and impermanence and results in deep discounting of long-term viability.
Which is why ecosystems are the desired business construct for technology companies. They allow a more consistent and repeatable transaction model and offer predictability which is sorely lacking in the rapidly changing technology industries. It allows a company to define itself on its customers rather than on its products.
However, old habits die hard. Regardless of the exhortations of product companies, the notion of being valued on audiences is reserved for the service-oriented. Hence the outburst from Tim Cook at the latest shareholder's meeting. Reports have him saying that:
Apple now has 800 million iOS users and has handled over 16 trillion push notifications, with 40 billion new ones occurring every day. Apple also delivers several billion iMessages and FaceTime requests every day. Cook added that iPad now accounts for 78 percent of all tablets used throughout the enterprise.
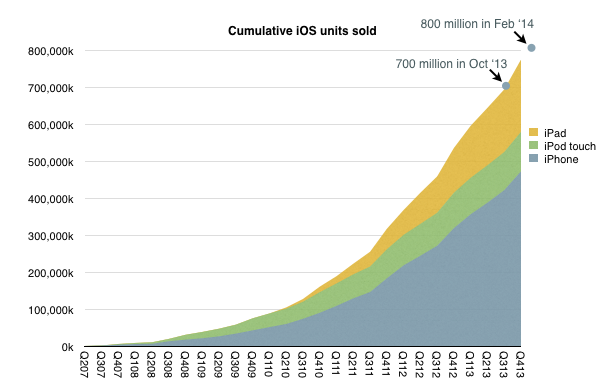
Trillions of push notifications aside, the claim that Apple has 800 million iOS users seemed way out of line. This is because the number of iOS devices (excluding Apple TVs) shipped through to the end 2013 was exactly 774,336,000. One could easily imagine another 25 million or so since, giving us about 800 million sold, but I cannot see the number in use being the same, and even if they were, the number of users being the same.
The following graph shows the claim in context of shipments.
Note that last September Cook made the claim that 700 million iOS devices "by October", which did indeed happen. The 800 million claim in February is certainly believable in that context.
Determining the total number in use is a very speculative exercise. Assuming useful life of 9 quarters for iPhone and iPod and negligible iPad retirements yields about 560 million iOS devices in use. Obviously this can be very inaccurate as also there can be multiple users per device but the claim of 800 million users seems very hard to reconcile.
Perhaps he was mis-quoted or he mis-spoke but the real question isn't the exact number but rather the implication that Apple should be seen for its users rather than its quarterly shipments.
Them's fighting words, Mr. Cook.
[Update: Thanks for Philip Elmer-DeWitt's investigation, Apple clarified that Tim Cook referred to 800 million as the number of iOS devices sold not users of iOS. He was mis-quoted.]
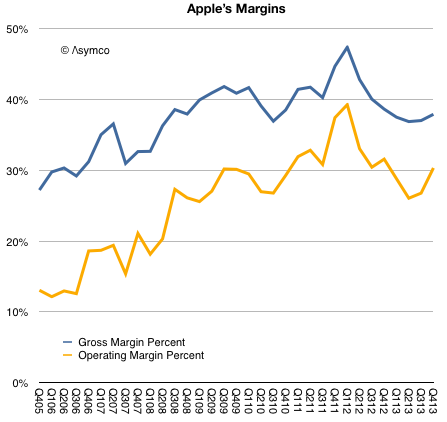
Prior to Apple's earnings report I read at least one article suggesting that the most important indicator to watch was Apple's margin. I suppose this was due to a recent decline in margins from a peak gross margin of 47.4% in Q1 2012 to 36.7%.
As the graph below shows, margins began to recover by Q3 2013 and are nearly on par with year-ago levels.
The guidance for the present quarter is a gross margin between 37% and 38%. This would imply a flat q/q GM line (blue line above.)
This is not quite catastrophic.
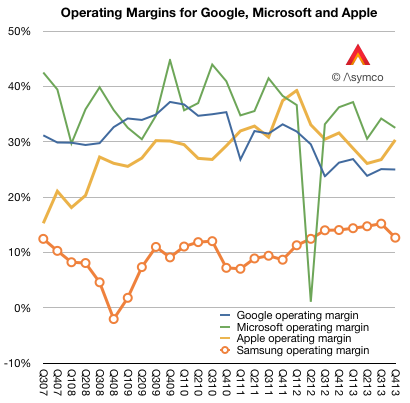
To better understand margins, it helps to compare them with other companies. When Apple reached that peak of near 50% gross margin I noted that such a level was higher than Microsoft's and Google's. The irony being that Apple was nominally an (implied) low-margin hardware company while Microsoft was an (implied) high-margin software company and Google was an (implied) high-margin internet services company.
Here is the picture with the last two years added:
In the last two years Apple's margins have declined but so have Google's. And although Microsoft's fell, they fell less than Apple's and thus overtook it to remain slightly more profitable (32.5% vs. 30.3%) into Q4.
I also added Samsung Electronics' operating margin. ((As a large conglomerate, Samsung will have a lower blended average. Separating the Telecom group's operating profit shows a 16.14% divisional operating margin.))
So although Apple stabilized, it did so at an extraordinarily high level, well out of band for a hardware company. Thus the question remains: Are Apple's margins a fluke? Is the recent rise of margins to levels far above those of a comparable hardware company and into the realm of software and services sustainable?
The simple answer is to assume that the iPhone and iPad, which make the bulk of revenues and which explain much of the rise, enjoyed a temporary buzz which allowed them to be priced at a premium but as that buzz wore off, the pricing and margins would decline. This is common with fads and fashions.
But the situation is far more nuanced. If the margins were due to mere novelty, the effect should not have persisted over so many years. Pricing data shows that the iPhone remains exceptionally valuable and that the iPad, excluding line extensions, has also held the line on pricing.
The missing piece in the puzzle is that the iPhone and iPad and iPod touch and Apple TV are pieces of an inter-dependent network of assets. The iTunes stores, Apple's services and Apple Retail are easily ignored because they are not "profit centers" but I believe they are a key component to the sustainment of these margins.
In other words, the iPhone and iPad enjoy margins not just because they are new and well designed. But also because they form part of a ecosystem. The key word is 'system'. The user buys into a system not just what the device embodies.
This is why I've always said that the iOS product businesses should be thought of as "hardware as a service". The inspiration comes from the notion of "software as a service" which posits the idea that software purchases should be thought of as services and thus recurring revenues.
iOS devices are part of a service matrix: the user experience in the stores, the after-sales support (including the easily ignored Applecare), the broadband supplied through operator service (which is part of a trillion dollars of value), the apps and content that can be purchased (which add up to a mountain of money), the network effects of iMessage and iCloud and now iRadio and Match and Siri.
These services attachments are well understood as great business models and underpin some of the most celebrated businesses to emerge in the last decade including Google, Amazon, Facebook, Box, Dropbox, Windows Live, etc.
It's curious therefore that whereas these other businesses are highly valued as services, in the case when the service is a component within a larger system, the value is missed. In an integrated context the connection between services and high margins is not understood. The reason may be the absence of robust systems analysis and a preference for the facile explanation.
Apple revenues grew at the rate of about 6% in Q4, while earnings grew at 5%. These were improvements over Q3 and Q2 but the rate of top line growth is has not been this low since 2009. The bottom line is also slower than it's been for the entire "epoch" or era of the iPhone.
The components of sales growth are shown in the following table:
The company delivered performance inline with its own guidance so there should not have been surprises in the top and bottom lines. However, the disappointment might be in the low growth for iPhone (at 6%) and iPad (at 7%). The Mac and iTunes grew at moderate rates (16% and 19% respectively) while the iPod continued its decline with -55% growth and Accessories remained fairly flat.
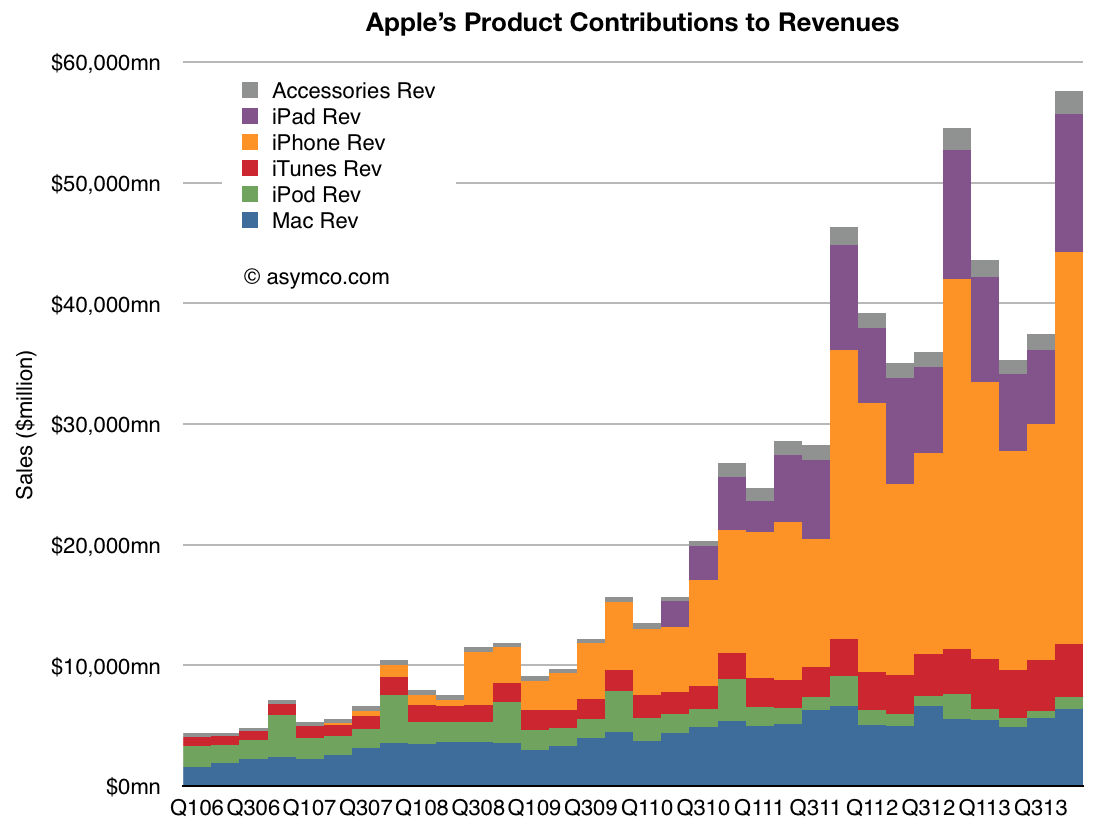
As the graph below shows, the iPhone and iPad are the bulk of the business so their performance is a large part of what is observed.
The speed with which products are introduced and scaled is phenomenal so it is more important than ever to see beyond the trajectory of existing products into the pattern of the introduction of new product categories.
Markets are effective in anticipating the path of a technology as it ascends into the hands of users, especially if it is destined for ubiquity. But markets are completely incapable of anticipating the emergence of new technologies.
In this regard markets are a reflection of common sense rather than uncommon wisdom.
As Philip Elmer-DeWitt is still interested in my estimates I provided the following:
Revenues ($B) 57.8 EPS ($) 14 (908m shares) iPhone (units) 56.4 million iPod (units) 7.6 million Mac (units) 4.14 million iPad (units) 26.5 million iTunes/Software/Services ($) 4.2B Accessories ($) 2.2B GM% (percentage) 37.1%
I arrived at these estimates without looking at anyone else's (except for Apple's own published guidance). Soon after sending them I noticed that Daniel Tello published his own.
In the same format as above, I quote them for comparison. Please visit his post for additional detail.
Revenues ($B) 59.0 EPS ($) 14.92 (895m shares) iPhone (units) 56 million iPod (units) 9 million Mac (units) 4.65 million iPad (units) 25.5 million iTunes/Software/Services ($) 4.3B Accessories ($) 1.8B GM% (percentage) 37.8%
The graph below shows the history of revenue guidance vs. revenue reported. The last quarter shows my estimate for net sales.
Note that the company achieved at or slightly above its upper guidance ever since they started offering a range for guidance (i.e. since Q1 2013). My estimate for sales is therefore very near the top of guidance. The figures for units earnings and margins all result from this assumption.
Exactly one year ago, on January 7th, 2013, Apple announced that the App Store reached 40 billion downloads ((Unique downloads excluding re-downloads and updated)). Here are additional data points from that release:
20 billion downloads in 2012
2 billion downloads in December 2012
500 million active iTunes accounts
775,000 apps
sold in 155 countries
300,000 native iPad apps
over $7 billion in developer payments
This year, on January 7th, 2014, Apple announced a new set of data points:
$10 billion spent on the App Store in 2013
$1 billion in December 2013
3 billion app downloads in December 2013
1,000,000 apps
sold in 155 countries
500,000 native iPad apps
$15 billion in developer payments
The obvious:
225,000 apps were added in 2013
200,000 native iPad apps added in 2013
App download rate for December increased by 50%
No new countries were added in 2013
$8 billion was paid to developers in 2013 (more than in all previous years put together)
The less obvious:
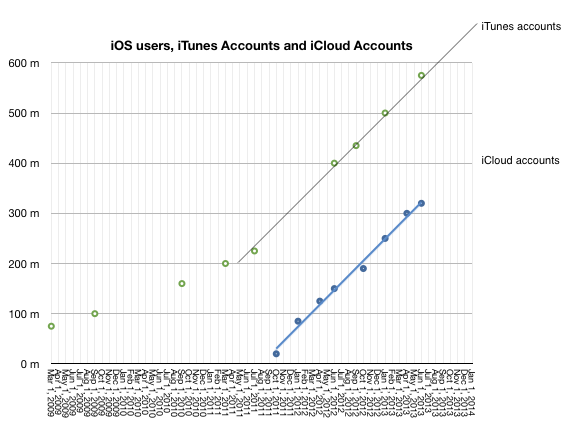
No update on iTunes accounts this time but there was a mid-year update (June 10th) which put iTunes accounts at 575 million. iTunes accounts have grown linearly since mid 2011 so it's quite probable that the current total is above 650 million.
Given mid-year updates to earnings/revenue and the October 22nd update that 60 billion total apps were downloaded and the May 15th update that 50 billion total apps were downloaded it's possible to estimate with confidence that there are now 68 billion total apps downloaded and that were about 27 billion app downloads in 2013. This is an increase of 35% in the yearly download rate. As noted above, the December growth alone was 50%.
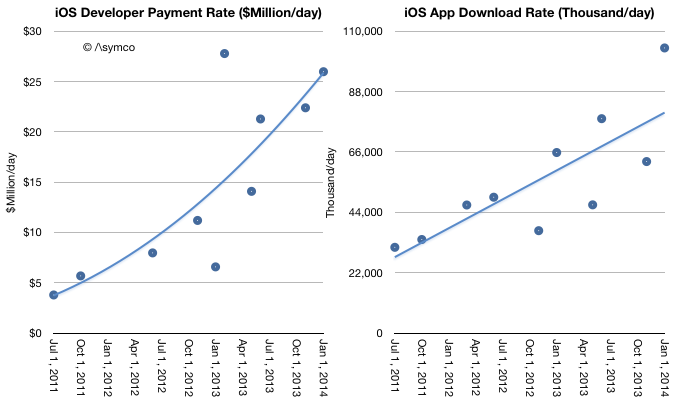
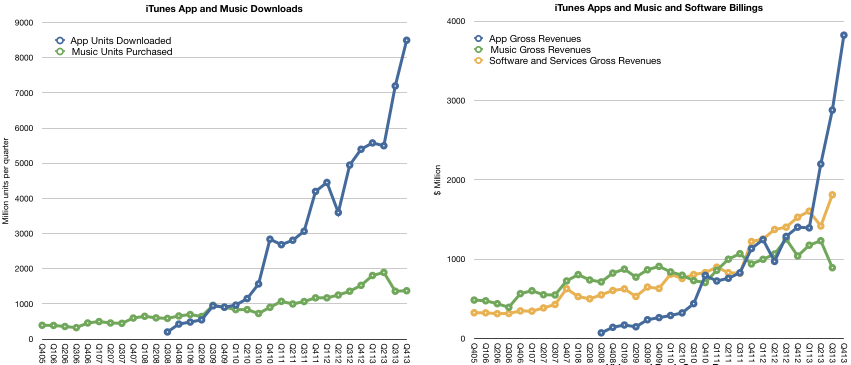
Given mid-year updates on developer payments, and download rates we can estimate revenues per app have increased. As in-app purchasing has taken off it's no longer meaningful to assign a "purchase value" to each download. The rate of payments to developers is increasing faster than the download rate. Currently $26 million is paid out every day while about 100 million apps are downloaded daily. Note that the trend lines below are arbitrary:
As other reports have noted, there was a decrease in music downloads in 2013. This is also evident when backing into a download total for music given the earnings data and the above evidence of app growth. My estimates below may be overly generous for music unit downloads as they also assume lower pricing. Overall gross music revenues through the iTunes music store ((Excluding new iTunes radio and revenues from services such as Match)) are flat for the year and may even have begun declining precipitously. App revenues are more than compensating for this.
The iTunes content economy is grossing about $17.5 billion/yr. Apple's own software and services (reported as part of the iTunes segment) add another $6.2 billion/yr. The combined total of $23.7 billion/yr. is slightly lower than what Apple net sales were during its fiscal 2007 year or what Amazon sold in 2009.
A complete report on the iTunes economy and pro-forma iTunes income statement is available for purchase at store.asymco.com.
So much for the data. What is really happening?
First, it's tempting to look at music and suggest that music downloads are suffering from streaming, just as it was tempting to suggest that CD buying was suffering from piracy (and later, downloads.) But this is falling into the trap of defining a product's use by the metrics used to measure transactions. These metrics are but a proxy for what consumers are actually doing with their time.
Consumers have a fixed time budget, a more rigid constraint than their spending budget. Competition for a slice of a consumer's time budget is far tougher than competition for a slice of a consumer's wallet. So what's amazing is that apps have successfully grabbed a share of this time budget. I believe that the reason they succeeded is that they initially fit into niche time slices that were previously unoccupied. ((Interestingly, this was how music, especially digital music as enabled by the iPod, gained traction))
Downtime or "boredom" was filled with app interaction. This includes some social media consumption. These are not immersive experiences. They are "casual", inconsequential and trivial. At first anyway. And that's the rub. As apps enter a consumer's world they initially take on non-consumption, which is easy to beat. But as the experiences become increasingly compelling they "move upmarket" and compete more aggressively with existing media consumption patterns.
For instance, one might allow casual gaming to take root in non-consuming contexts such as commuting, waiting, and escaping time niches. But if the experience becomes addictive, the gaming takes over time previously spent watching TV or using console games. The same can be observed for app-based experiences of social media, shopping and chatting.
This is the insidious march of a disruptor. It gains a foothold in a context where it has no competition and then relentlessly gets better, eventually displacing the far better suited alternatives. This is what I believe is happening with apps. They are asymmetric in their competition with established media and as a result they are easily ignored and brushed off as irrelevant competition. That is until the incumbent media sees a sudden drop in consumption. Even then, the culprit blamed is not the upstart but some structural issue.
Music would appear less vulnerable to this app-based substitution because it's an eyes-free experience and can be easily consumed concurrent with another activity. There is however, a subtle de-emphasis and hence devaluation of the experience as it fades into the background. The "job it's hired to do" changes.
Second, and relatedly, the other meta-observation is that apps are media. They are produced, marketed and priced in ways analogous to other media types. This has implications for the artist/producer/creator. For them movement into apps is natural and effortless. It's how developers moved into them without thinking twice. Trouble is that this transition is not at all simple for those who distribute media.
I tweeted that the media industry deplored the shift of "digital pennies for analog dollars" ((Original quote was made by Jeff Zucker, president of NBC Universal, in 2008 in reference to the future of TV)) as the packaging of their product changed. The angst and trauma suffered by the media industry when dealing with what could be seen as a trivial change in the encoding of content are the stuff of lore and legend. Moving to apps could be even more troubling. Mainly because there is already a distribution channel in place. And it's owned by a set of companies whose motives and business models are completely different.
The app economy shows that there are big opportunities in "digital pennies" and that the figures are beginning to match even the "analog dollars". In fact, I suspect eventually digital pennies will dwarf analog dollars. The trouble is that these pennies will not be earned at the same control points. Bits are already big bucks. They're just not the bits we are used to.