IBM Digital Analytics Benchmark (report is here) has published, for the fourth year in a row, US online shopping traffic data with a split between mobile and fixed online traffic. It reveals a pattern of consumer behavior which is quite startling: people seem to prefer to shop using mobile devices.
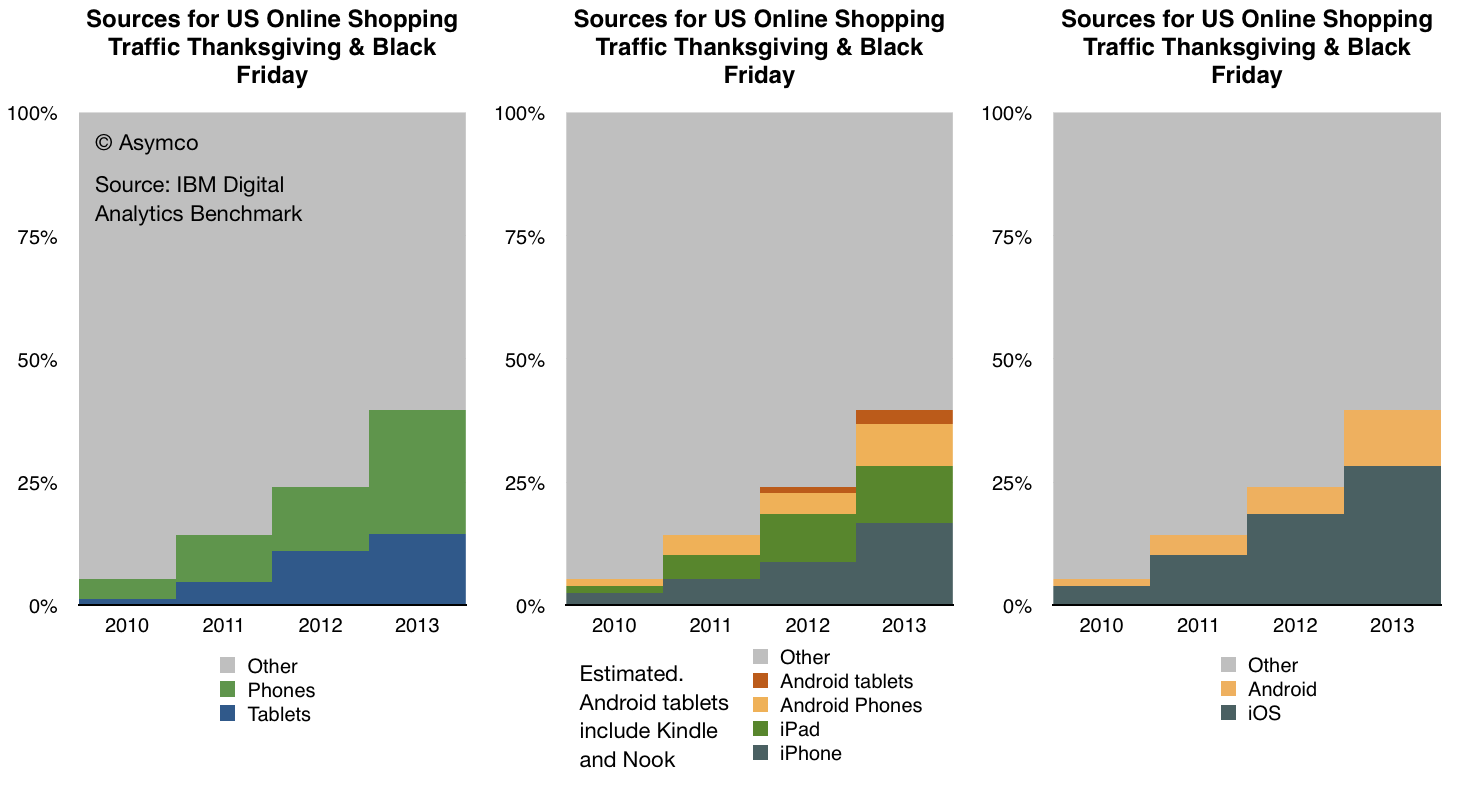
The data is shown below:
In terms of sources of traffic, mobile devices (including tablets) have increased from about 5% of all online traffic to 40% in four years. Last year the volume was 24% implying that 16 points of share were gained in one year. If that is extrapolated to next year then more than half of holiday shopping traffic in 2014 will be on mobile devices.
Put another way, next year less than half of users will hire a PC for the job of online shopping.
If this conversion from PC-based shopping to device-based shopping follows a logistic substitution curve then the conversion to devices will probably be 90% complete in another 5 years or by 2018 or 2019. I see no reason why this particular job to be done (shopping) should not be considered a proxy for other jobs as well. Therefore it's not a stretch to imagine that the transition to post-PC consumption will also be practically completed by 2020.
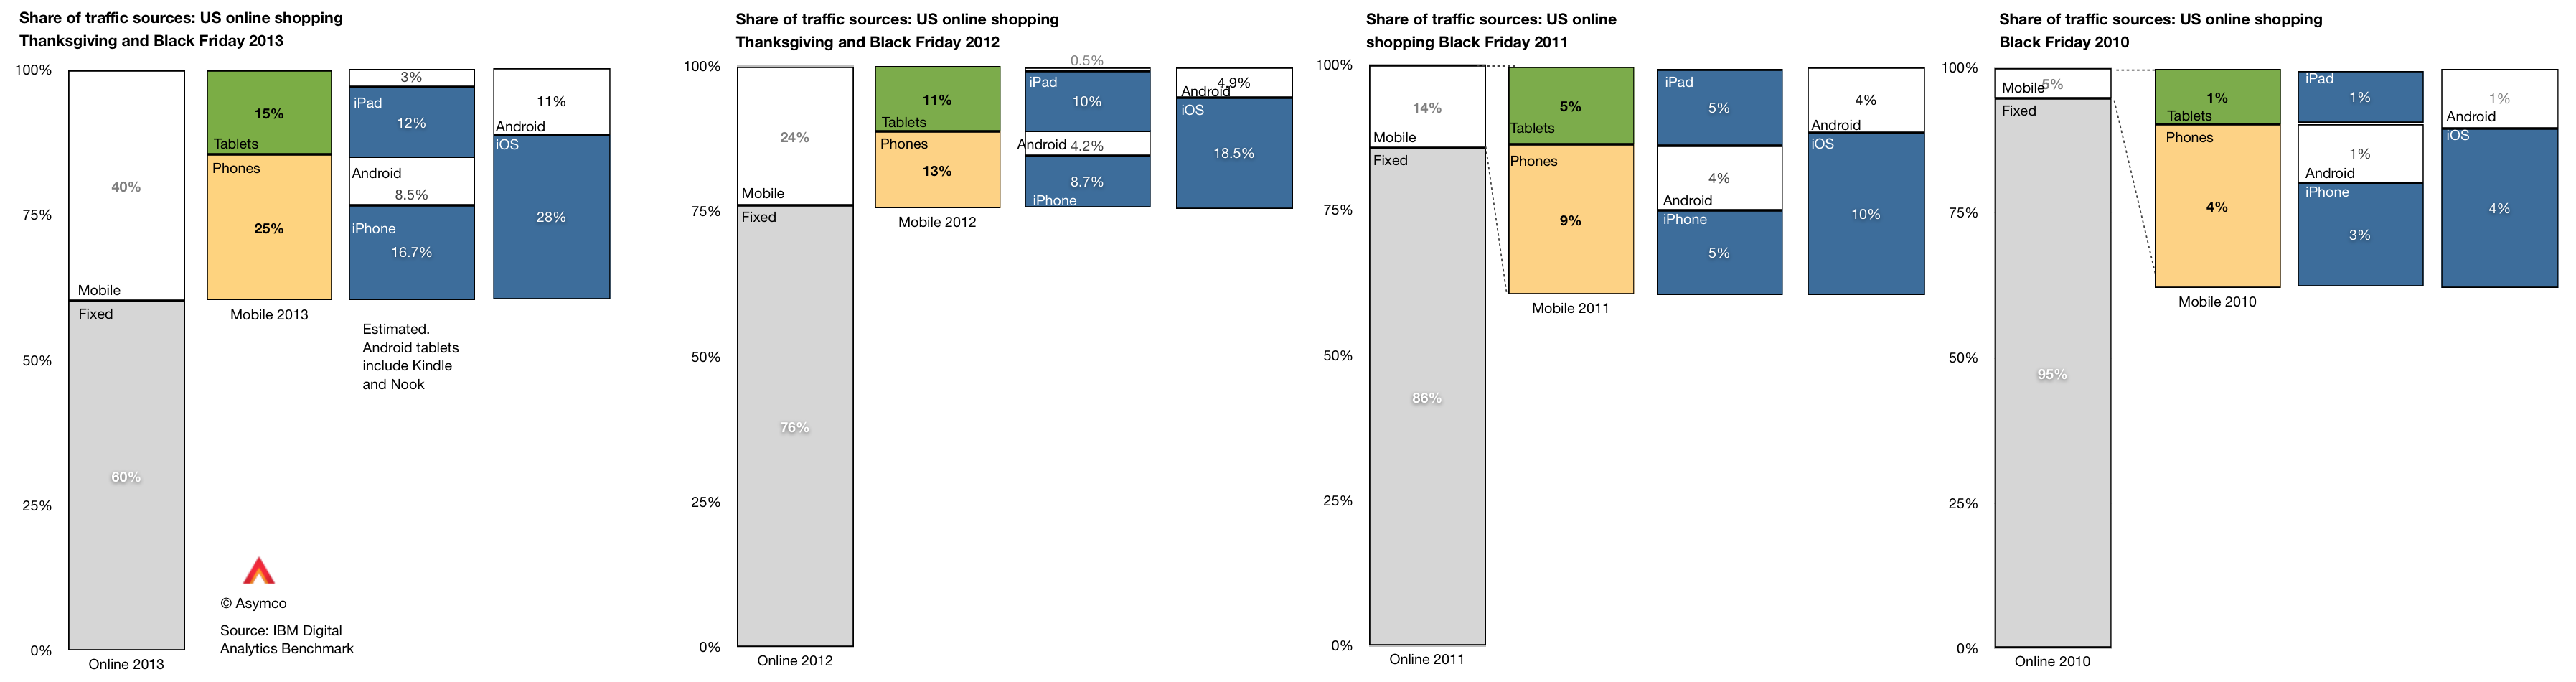
Within the data there is also a significant amount of detail beyond the mobile/non-mobile split in behavior. There is a distinction drawn between tablet and phone traffic and a further distinction between Android and iOS devices. ((The split between Android and iOS for tablets and phones was not published for 2013 but I extrapolated from previous years and assumed that 80% of tablet traffic was sourced from iPads vs 88% in 2012 and 99% in 2011. Note also that non-iPad traffic is assumed to be Android but that includes the Kindle and Nook products which are using partial and unsanctioned versions of Google's Android.))
This more detailed view of the traffic is shown in the following diagram:
A few observations:
The pattern of slowing tablet growth is likely due to the slowing growth in iPad sales. This itself is due to the lull in product launches as the shift to fall only iPad releases took place in 2012.
The consequence is that iPad traffic contribution only increased by 2 percentage points, from 10% in 2012 to 12% in 2013. Compare this with the doubling the previous year (from 5% to 10%).
Among phone users, both Android and iOS grew their contributions to traffic by roughly 100%. Android phone traffic increased from 4.2% of all traffic to 8.5% and iPhone traffic increased from 8.7% to 16.7%.
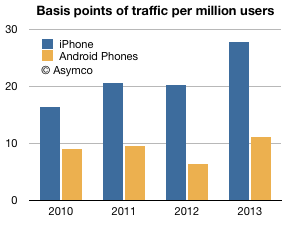
As we also know the approximate number of phone users for each platform (via comScore) then we can also determine the per user contribution of traffic of each platform. ((Note that this is phones only.))
The measure is "basis points of traffic per million users" and it is the result of taking the traffic data (in percent of total online traffic) and dividing by the population of users of a particular platform. The result is shown below:
The way to read it would be that each million iPhone users generated about 28 basis points of traffic while each million Android users generated about 11 basis points of traffic.
A way to compare these audiences would be to define the ratio between traffic usage by platform user. That ratio was
1.83 (iOS:Android) in 2010
2.16 in 2011
3.15 in 2012
2.51 in 2013
So, as far as phones are concerned, US iPhone users are about 2.5 times more likely to shop online than US Android phone users. The data is reliable: with the US population now over 65% penetrated with smartphones, these populations of users (totaling over 130 million) are vast and representative. As the technology is reaching deep into the late adopter segments the difference in behavior between iOS and Android usage is becoming easier to explain. We have to eliminate quirks of demographics or income or other possible causes.
The platforms themselves are becoming the last remaining suspects as causes for differences in the behavior of their users.
It may seem preposterous to suggest that a platform can affect shopping behavior but let's remember that the PC, the subject of this article, is a platform in itself. The migration of usage away from the PC to alternatives can only be explained by the alternatives being superior at the particular job that needs doing. The argument is naturally extendable to each alternative individually.
Benedict Evans explains well the problem with measuring Android tablets. There are no reliable data collected because many of the devices are invisible through the regular, measurable channels:
There are no firms which report their shipments
They are not sold through retail chains which normally are sampled in the US and Europe (NPD and GfK respectively.)
They don't show up in browsing or ad transaction data
Google Play statistics are missing most of the activations since they are not sold as bona fide Google-sanctioned Android.
The only measured statistic happens to be component shipments. Items such as screens, CPUs or perhaps memory might be visible to market analysts. It's therefore tempting to add up tires manufactured to determine what's getting sold in auto dealerships.
But it's also hugely problematic.
Before we go into that rat's hole, I want to re-visit my original criticism for market analysis based on device attributes. When the iPad was new it was famously labeled a "media tablet" by Gartner and excluded from being counted (and hence compared) with PCs. This created an implicit signal to the analyst's clients to ignore the entrant as irrelevant.
That actually accelerated their demise (and the revenue prospects for the analyst).
In contrast to that exclusion--of a clear and present danger based on an arbitrary definition of form factor--the analyst who defines categories of products purely on the definition of their components is guilty of the same sin.
Snowing the audience with irrelevant comparisons is just as bad as withholding relevant comparisons. This is explicitly asked of witnesses: to tell the truth, the whole truth and nothing but the truth. The "nothing but the truth" means the exclusion of irrelevance.
The correct approach is to identify which devices are comparable (and thus in the same category) based on the jobs they're hired to do. If a tablet overlaps considerably in the work it does with a PC (e.g. browsing, email, media play, and other applications) then they should be considered comparable. If a tablet does nothing that a PC does or nothing that an iPad does (e.g. no browsing, email, apps or ecosystem activity other than piracy) then they should not be considered comparable.
Which brings me back to the question of what these dark matter "Android tablets" actually do.
To answer I want to recall another "dark matter" technology that seems to have gone largely unnoticed but was exceptionally popular. This was the VCD or Video CD. It was an alternative to the DVD without the licensing and DRM overhead it entailed. It was extremely popular in Asia as a way of not only buying but also sharing video content. The cost of content was a fraction of sanctioned versions, essentially taking the role that mass-copied VHS had in previous years.
The "job to be done" was to enjoy video content cheaply and conveniently for the equivalent of pennies a day. A job very similar to what we think of as cable TV today.
These devices and discs were largely invisible mainly because they did not exist in economies which adopted protected DVDs and because the content consumed did not hit against any databases that tracked consumption. Nevertheless there might have been hundreds of millions of these devices sold and billions of discs viewed.
Now we are in a situation where devices whose primary purpose is to watch video content (cheaply and conveniently) are being counted. By their counting, their implicit competitiveness is asserted. But it means nothing if they are not hired for the same jobs. In fact it misdirects attention.
Sometimes these "low end" devices do grow up to swamp the higher-powered alternatives with good enough functionality. That is the innovator's dilemma for low end disruption. But in some cases they don't because other factors are at work. Because ecosystems have complex multi-sided markets and because regulations and channels and consumer behavior conflict with the technical specification.
For this reason the VCD did not "disrupt" DVD or grow up into a Blu-Ray equivalent that caused Hollywood to crumble. It faded away as an anomaly.
Whether the dark matter Video-only Android device will come to swamp the iPad will depend not on just volume shipments in select geographies. It will depend largely on the ecosystems built around it. The ecosystems of VCD were largely unsustainable because there was no value placed on the content itself. The value chain did not strive to sustain the technology. When something better came along, it got dropped.
In contrast, content-based value chains sustain technologies which keep the revenues coming. And we can measure this revenue.
You don't need to look too hard for that in tablets. Apple states it quite frequently: total payments to developers.
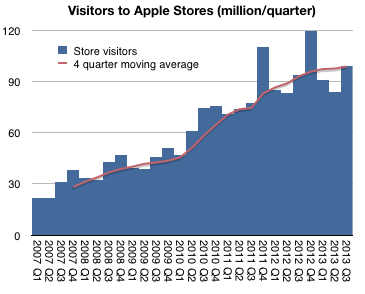
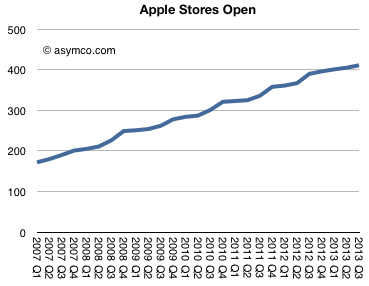
In fiscal 2013 there were 395 million visits to Apple retail stores. In 2012 there were 372 million.
The difference is approximately the population of Australia. This was in addition to the population of the US and Canada already passing through. Although this is a fun way to think about total traffic, it does not reflect performance of the stores themselves since new stores are always being opened. 21 new stores in 2013, to be precise.
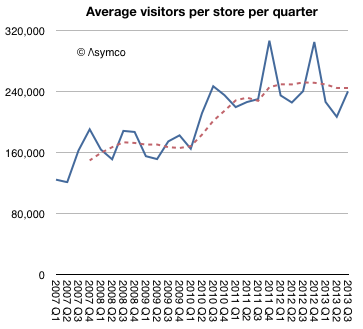
The better benchmark should be the number of visitors per store.
This shows that, except for seasonal peaks, the visitors per store per quarter has been a fairly steady 240k since mid-2010. What's more, this rate was also remarkably steady at around 160k/store/quarter from 2007 to 2010.
So what caused this quantum jump (("Quantum leap" is often used to mean "giant leap" but in the original usage it meant a specific, discrete jump)) in traffic? Was it due to a re-design of the stores? Was it a change in product mix? Or was it due to a change in staffing rules?
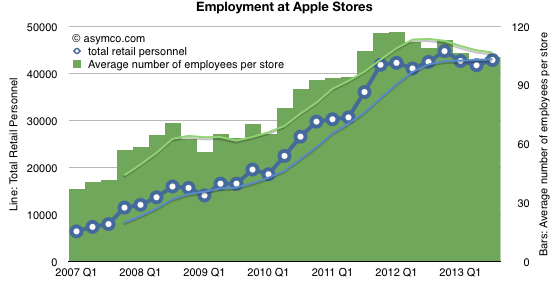
I think we can rule out staffing changes. The data shows that staffing ramps with visitors and there was no specific "quantum" increase in employment (on a per-store basis or otherwise).
Re-design as a cause has some more merit. On one hand, we have seen bigger stores opening and many more flagship stores. We have also seen specific renovations of existing stores. We have also seen re-designs where the layout was changed to allow for more traffic. The only problem with this as a cause for the quantum leap is that these changes are constantly under-way and have been for some time. It's hard to point to a specific "big bang" redesign across the board in early 2010 as possibly a cause.
That leaves product. Here we have a clear suspect. The iPad launched exactly at the point in time when the visitor count leaped. In my opinion this is the best explanation.
Let's remember also the comment from Ron Johnson at the time of the iPad launch. He said that it was as if the stores were designed for a product like the iPad. In other words, the iPad is something that needs to be discovered with a retail experience. You can sense this when you visit the stores and the placement of the iPads within.
It all points to a something more profound: that the stores are brand ambassadors. Apple products create a purchase decision by speaking directly to the users. For the type of product Apple makes, that conversation can only happen face-to-face. The place where this meeting happens is the store.
Airshow New York was our best Airshow ever. We sold out to an audience who engaged and challenged us to our best performance. We are learning more each time and after three shows we have honed the show to a fine performance.
Due to the demand met in New York we decided to return there in December 5th but to also present in my home town of Boston on December 3rd. We are also presenting in my second home town of Helsinki in November.
To explain how to present rich data in a compelling and emotionally engaging way.
To explain the principles of visual persuasion.
To offer hands-on training with the tools of persuasion: iPad and Perspective.
The method we devised borrows heavily from the techniques of Cinematography and screenwriting to impart meaning to the audience beyond the literal words spoken or images shown on screen.
This includes:
Framing
Light and Color
Depth
Motion
The Reveal
Texture
Establishment
Characterization
Point of View
These techniques are demonstrated with "feature presentations" and then deconstructed in interactive lectures. Throughout we also weave Aristotelian rhetorical tips and present from the Asymco repertoire of stories.
The day ends with a hands-on exercise. iPads are required.
At the end of the seminar you should be able to:
Understand how data can be used to persuade through an appeal to logic as well as through empathy.
Understand the basics of "data cinematicism" including the techniques analogous to cinematography and direction.
Understand story development techniques including how to facilitate the audience's entry into the story.
Publicly, Mr. Lazaridis and Mr. Balsillie belittled the iPhone and its shortcomings, including its short battery life, weaker security and initial lack of e-mail. […]
Internally, he had a very different message. “If that thing catches on, we’re competing with a Mac, not a Nokia,” he recalled telling his staff.
The whole article is worth reading, detailing as it does the decision process inside BlackBerry during the painful disruption of its core business.
What struck me most however was how similar their decisions were to those of Nokia at about the same time. Consider:
The engineering priorities placed on optimization around constrained hardware. Although engineers knew how to build the right products, the business priorities caused them to be deployed in the wrong direction.
The delays these misdirected efforts caused. Mobile phones have narrow windows of opportunity but long lead times. A strategic mistake is very costly and most probably impossible to remedy. In the case of BlackBerry, buying QNX came too late while for Nokia the deprecation of Symbian was catastrophically managed.
The feedback loop from network operators which shut down any initiatives for improved user experiences. Your best customers provide all the wrong information when the market is being disrupted. Ignoring them is impossible while complying is a strategic mistake.
The demand from network operators to develop "killers" to competing platform-based products ((Ironically, Nokia was asked to do a BlackBerry killer)) and the subsequent "jumping at the opportunity".
Listening to large buyers at the expense of users. While BlackBerry was guided to omit consumer features from its enterprise buyers, Nokia never secured enterprise buyers of any significance ((though they tried very hard to get them)). Nevertheless it created the "E series" business-friendly phones which suppressed features like cameras and music.
The celebrity sponsorships and wasted promotional efforts in the face of structural failures. This is manifested today by HTC as well.
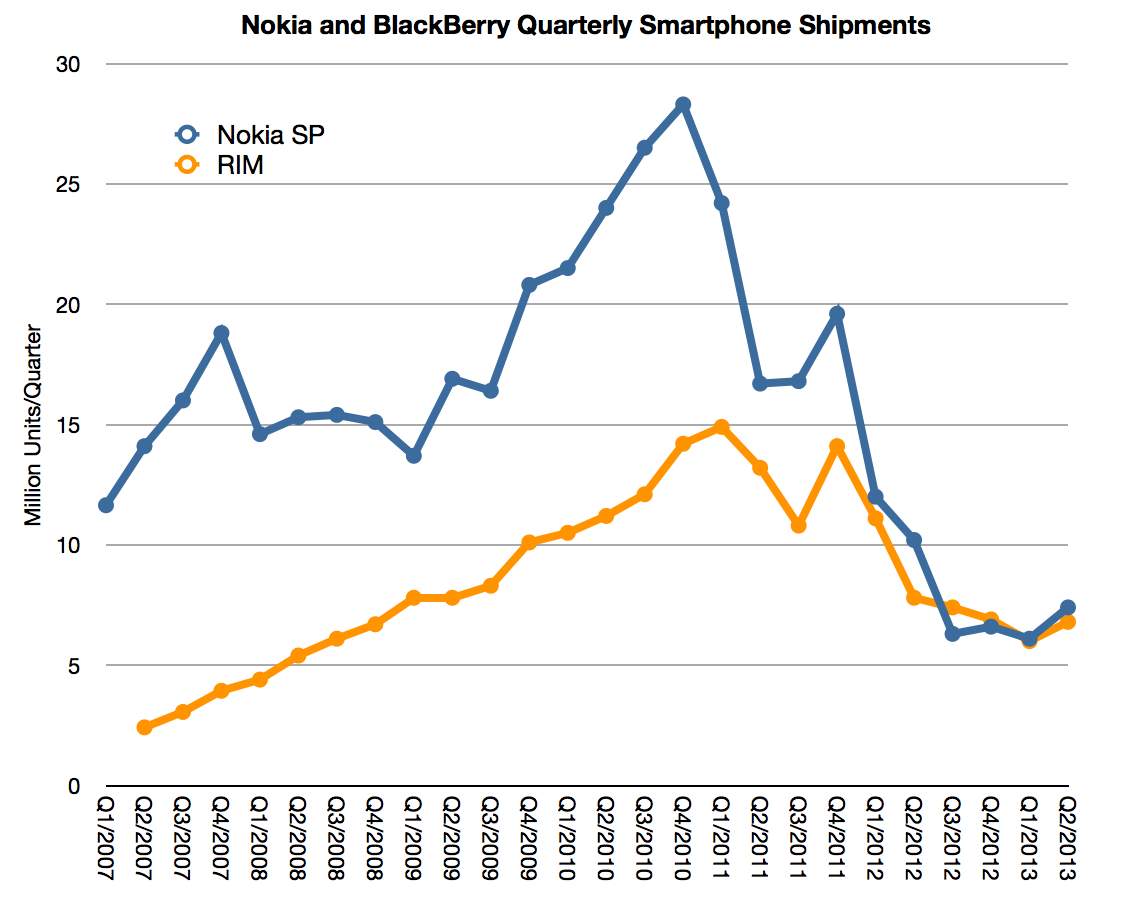
The parallelism of this synchronized failure can be seen in the following graph showing smartphone volumes.
The striking thing is how the two companies peaked are almost precisely the same time and how that moment (end of 2010) was not related to the entry timing of their nominal disruptor.
Recall that both companies cite the iPhone as the factor which caused a shift in the basis of competition. But the iPhone launched in mid 2007 (at the beginning of the graph's date range.) BlackBerry had 16 quarters of growth after the iPhone and Nokia nearly the same. The stock prices of the companies also prospered for a period long after the iPhone entered the scene validating a do-nothing approach. So this is the crux of the incumbent's dilemma: how do you rally a response when you don't feel any pain? It's worse actually: how do you embark on a painful course of action while feeling comfortable and safe?
The reason the companies did not suffer immediately from the iPhone was because it (and its Android equivalents) took time to reach the core customer bases. Remember that the iPhone was not "good enough" to be an enterprise product at launch and Android was not the first to serve the low end of the market, where Nokia was dominant.
Vision is worth exactly nothing without timing.
But enough about ancient history. The crucial question is what does it teach us. It's tempting to suggest that this disruption is happening again with the iPhone today.
There is one big problem with this. The iPhone was not a low-end disruption. It was exactly the opposite. The BlackBerry and the Nokia products were striving for the low end. They observed the discipline of constrained resources. They were expanding into emerging markets. They watched every fraction of a penny on the bill of materials. The low end was manna for the whole industry. Even Microsoft with Windows Mobile was better positioned for the low end than Apple.
Instead, what Apple did was unthinkable. It entered with a high end product. It even promoted its high price ($500, subsidized!) This is why it was laughed at.
Theirs was "the Mac in a phone" idea. The reason it worked was that it was not a phone. The reason it worked is because it was the hardest disruption to spot:
A new market disruption ((The reason Clayton Christensen and his disruption consulting black belts could not spot it is mostly because new market disruption requires deep industry domain knowledge))
Disruption is not a process that merely rewards breaking convention. Any fool can rebel against the status quo. To change it requires a process that rewards asymmetric competition. Finding a way to be seen as irrelevant and yet conquering at the same time. Being disruptive is, above all, being imperceptibly valuable.
For iPhone the core asymmetry was that it was a computing product and not a telecommunications product. Every decision thereafter flowed from the calculus of computing and not the compliance with telco convention. The ecosystem, the rapid rate of improvement, the rich user experience, the tie into other product lines.
It was this asymmetry which confused every observer. Predicting how a high end product can conquer the low end is fiendishly counterintuitive.
In contrast, spotting low end disruption is a parlor game. There is little challenge in observing a cheaper alternative competing as a commodity. For evidence look at how markets react. Whereas they could not understand the value of the iPhone (or iPod or iPad) they reacted instantly to the whiff of a commoditization play. Angst surrounding cheaper alternatives pervades. ((The contrarian should note that commoditization plays are hard bets to win since everybody can spot them.))
The problem with the low end disruption thesis is that low end is also much easier to respond to, especially now that everyone read the book. The incumbent simply needs to have a flexible cost structure and a vast margin to dip into. Most failures to respond to a low end disruption come from companies stuck in a high cost structure not from a failure to see a low end alternative. ((Christensen case studies almost always cite how the low end disruption was perceived easily but the response was felt to be marginally worse than not responding or fleeing upmarket.))
Apple's costs are mostly variable and their fixed (R&D and SG&A) are growing far slower than sales. There are huge margins and more cash being spun out than anyone can figure out what to do with it.
The distressed response to the low end tends to be a retreat into the higher margins and an abandonment of existing customers.
I don't see Apple doing either. Rather, it is gradually adjusting its portfolio toward lower end alternatives. Note that demand for the lower end product is far less than for the high end. Instinct would suggest that they should have stuck with the 5S alone. But it moved down anyway. It also did so with the iPod, iPad and Mac mini.
The idea that Apple is vulnerable to the low end is a relic of an idea. It goes back to the Mac of the 1990s, at a time when the world-wide computing market was orders of magnitude smaller than today and where purchasing and development decisions centralized in the hands of a few large companies ((essentially B2B as Ben Thompson points out)). And even when looking at that competition, the Mac somehow managed to survive.
That's not likely to be the case for those who found themselves in competition with the Mac in its pocketable re-incaration.
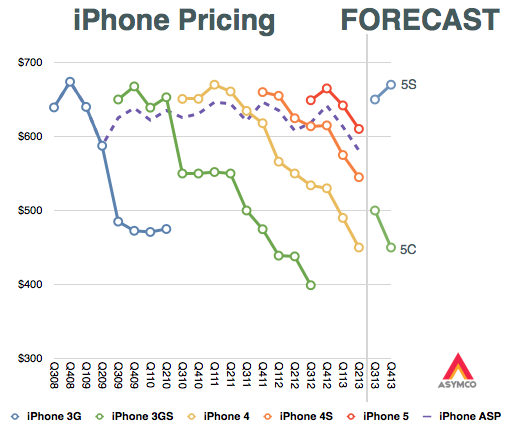
My assumption going into this, sixth iteration, of the iPhone was that we would see the expansion of the iPhone into two distinctly positioned products: a low-end C and a high-end S. The assumption was based on what what we saw with the iPad: the regular iPad and the mini iPad.
By using the iPad as a template, my exercise in August was to forecast what the pricing ((Revenue/unit to be more precise)) might turn out to be for such a split-personality product.
I expected the 5C would replace the "low end" n-2 variant ((Older by two generations as the iPad mini replaced the iPad 3)) and the 5S would continue as the core product. This is reflected in the original graph as devised in mid-August:
The surprise was that the 5C was not "low end" in any way other than having a plastic case. It has a minor spec increase over the 5 but is otherwise a 5 feature set in a plastic skin. It also is priced as if it was the continuation of the 5, with a modest reduction in ASP.
In addition, the continuation of the 4S and 4 (in China at least) means that the old strategy continues more-or-less unchanged.
Knowing the line-up and pricing all that remains to understand is the positioning, or how the products are defined relative to each other.
This is where there might be a shift happening. Under the old model the n-1 variant was meant to be a modest volume contributor to the portfolio, being essentially a cognitive illusion which encouraged buyers to stick with iPhone n at the expense of competitors. However, the new n-1 product (the 5C) has a distinct positioning that makes it seem fresh and not a lesser, stale version of the flagship. It is designed to appeal as a legitimate upgrade for iPhone 4/4S users. It is, in other words, not meant as an illusion, and not focusing attention on the flagship ((It might still be an illusion for many but I'm suggesting that it won't be for most.)). Rather, it is meant to be a genuine, core product.
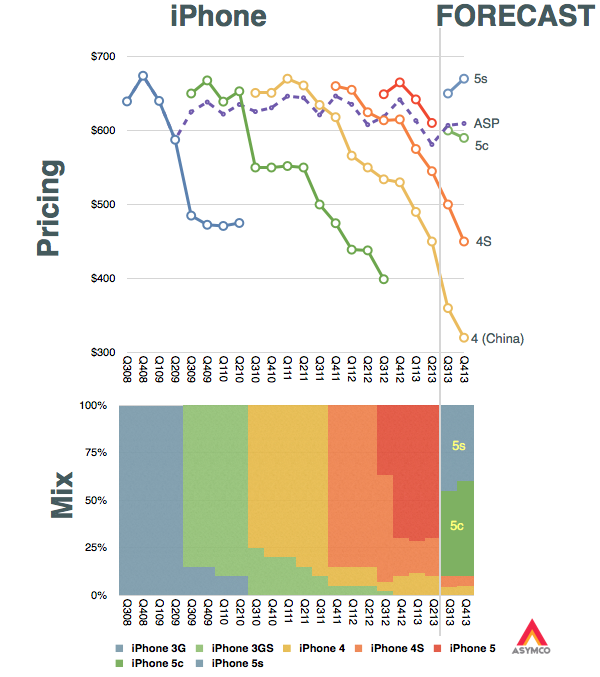
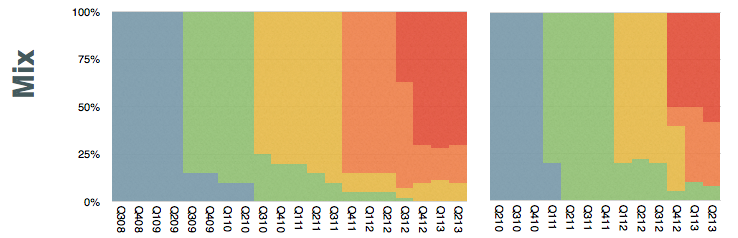
As a result, I expect the mix of iPhones to be more evenly split between the C and S variants. I expect the C to even become the most popular version in the mid-term. My expectations are shown in the following graphs.
There are several implications for this shift in positioning:
Apple is recognizing that the market is actually "segmentable". This is the notion that one size does not fit all--a radical idea for the brand. Its mechanism to address it is a "good+better" portfolio. Note that this is not at all like the iPad where the Mini is actually suited to different tasks. The iPad can be thought of as a "small+big" portfolio. The iPhone shows a clear delineation within the same product.
It is signaling that the premium may be more than what the mainstream needs. This is a corollary to the segmentation implication above but stands on its own because it also implies that the iPhone C is "good enough" and the S is more than good enough (or, to spin it another way, it is for "more demanding" customers.) It also implies that the premium "S" version will be a lower volume contributor.
The third implication is that the basis of competition is shifting. ((It has always been expected to shift, but the timing is where all the value is captured)) The shift is toward competing for late adopters in advanced markets and with early adopters in trailing markets. The new C model is still not suitable for trailing markets as it still over-serves and is over-priced ((This post deals with the iPhone portfolio structure or the placement of iPhone models relative to one another. It does not deal with a separate question of why the overall pricing is so high. That question needs to be dealt with as a discussion about the jobs iPhone is hired to do and by whom. I'll re-visit this job-based segmentation of the market in a future post.)), but it is at least signaling the "end of the beginning" phase in the smartphone market.
In summary I'd say that the C signals the beginning of the "good enough" phase which was also evidenced by the increasing mix of the older models during the last year. Financially it shows up as lower ASP, which, as the graph above implies, I expect to drop to $600 and lower during the next year. Margins may not be affected much as the C is still very highly priced relative to its cost of production.
Finally, if the good enough alternative is being "pinned" by Apple as the mid-range it also begs the question of why there isn't a specific "low end" version. It took six years for Apple to fork the product into two variants. Maybe it will take another year for it to stretch to a third. ((For more on the subject see S is for Service.))
We can put all of our products on the table you’re sitting at. Those products together sell $40 billion per year. No other company can make that claim except perhaps an oil company.
For those of you laughing, that was three years ago. The revenues quadrupled since to a total of $170 for the last four quarters. But the more interesting thought is that the table has not gotten bigger. When Tim spoke the iPad had just been announced but was not yet for sale. So we can't be sure if he thought it should be on the table or not, but it does not take up that much space.
It would be fun to actually lay out all the Apple products on a table to see how big it would be. The trouble is that there are many things Apple sells which take up no space at all. Things like iTunes content or services and AppleCare.
So rather than trying to imagine a table full of Apple products (some of which are non-phyisical) I thought a more fitting analogy would be to allocate the revenues from these products to a table and thinking about how much space relative to each other the products would take.
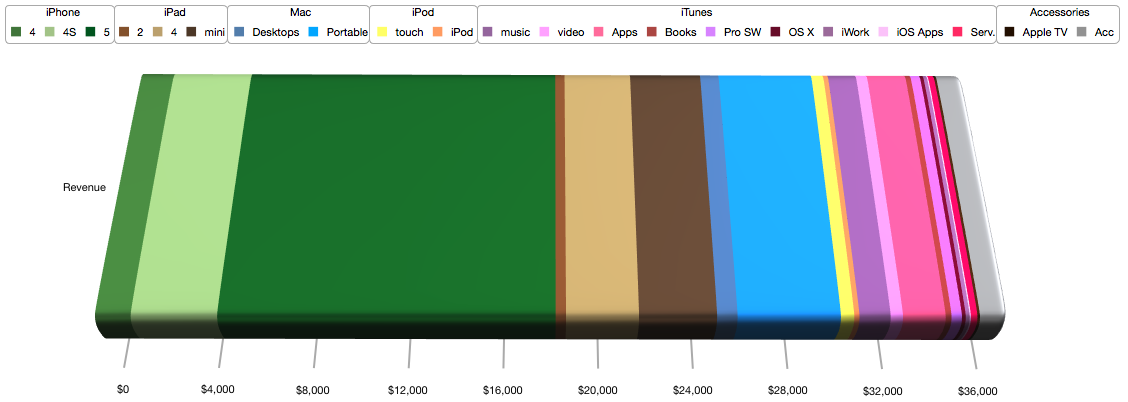
To make conversion easier, I picked a rather large table; 10 feet long, big enough to fit a small conference room. What would this table covered in product revenue look like?
My estimate is that it would look like this:
I color coded the product lines as shown in the legend: Greens for iPhone, Browns for iPad, Blues for Mac, Yellow for iPod, Red/Purples for iTunes and Grey for Accessories.
At this categorization the table would allocate the following space to each category:
iPhone (Greens): 60 inches or about half the table.
music 4.1 video 1.6 Apps 5.6 Books 0.8 Pro SW 1.4 OS X 0.5 iWork 0.5 iOS Apps 0.2 Serv. 0.9
Accessories (Greys): 4 inches.
Apple TV 0.3 Acc 3.6
If this colorful table were used to support the actual products, where each product would have to fit within its color band, then the truth of one saying would become apparent: good things come in small packages.
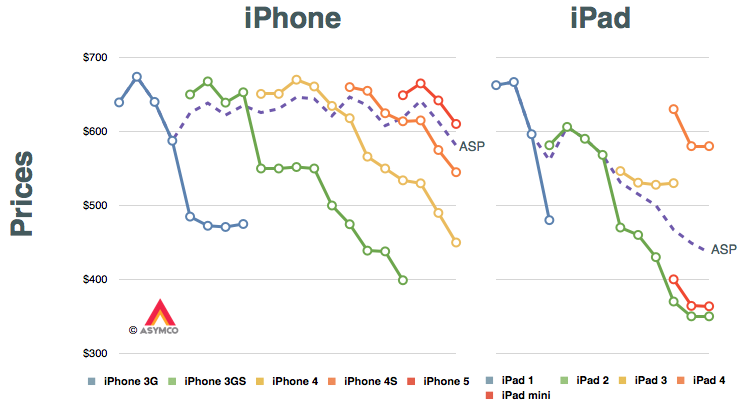
The answer may lie in the way the iPad mini has been marketed. The pattern for iPhone pricing is pretty regular but that for the iPad shows a marked difference. The reason is, of course, that the iPad has already gone through a portfolio broadening. The following graphs tell the story.
The only data in these graphs that is provided by Apple are the dashed purple lines. They represent the average selling prices (ASP[*]) for the two product lines. I added assumptions about product mix (shown in the lower set of graphs) and thus generated prices for each product variant at a given point in time shown as line graphs.
If you look at the iPad, ignoring the legacy iPad 2 (which I presume sells mostly to educational institutions) the replacement of the iPad 3 was with a "bracketed" portfolio of the higher-priced iPad 4 and the lower-priced iPad mini. Note also that the mini reflects similar pricing to the legacy iPad 2.
My second assumption is therefore that the 5S and 5C will form a similar bracket as the new iPads did. I also assume that the iPhones 4 and 4S will be retired. This means that the 5C will take up the trajectory of the 4S while the 5S will take up the upper bracket around $650.
The average pricing for the entire portfolio will depend on the mix. This is still highly speculative since we can't predict how the end-user (operator) pricing will be set for the 5C. Aggressive promotion and new market growth might skew the 5C considerably. On the other hand, upgrade promotions might move the 5S in existing markets.
---
Notes:
These prices reflect blended average prices of all SKUs to the channel and do not necessarily reflect prices offered to end-users.
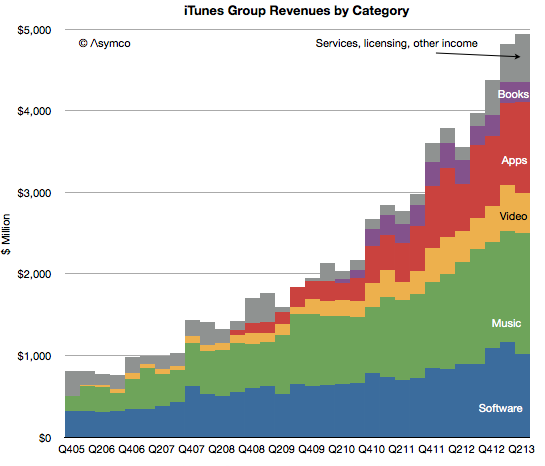
In the latest quarter the iTunes group top line grew by 25%.
Additional newly reported items:
Quarterly revenues dipped slightly to $4 billion (second highest after $4.1 billion last quarter).
iTunes Stores billings (i.e. gross content revenues) were $4.3 billion
Reached the best month and best week ever for App Store billings at the end of the quarter.
iTunes billings translated to quarterly revenue of $2.4 billion, up 29% from the year ago but flat q/q. Company reports “strong growth in revenue in both content and apps.”
New content added includes HBO GO and WatchESPN available on Apple TV. Apple TV catalog now includes over 60,000 movies and over 230,000 TV episodes.
Users have downloaded more than 1 billion TV episodes and 390 million movies from iTunes to-date. They are purchasing over 800,000 TV episodes and over 350,000 movies per day.
iOS developers have now created more than 900,000 iOS apps including 375,000 apps made for iPad. Apps created grew by 50,000 overall and 25,000 iPad apps.
Cumulative app downloads have surpassed 50 billion.
App developers are being paid at the rate of $1 billion per quarter.
App developers have been paid over $11 billion for their sales through the App Store (half of which was earned in the last four quarters.)
There are now over 320 million iCloud accounts
There are 240 million Game Center accounts
Almost 900 billion iMessages have been sent
Over a 125 billion photos have been uploaded and over 8 trillion notifications were sent.
Some observations and estimates:
Music revenue growth remains at around 15% while video revenue growth remains around 25%
Apps continue to accelerate with a near doubling of revenues
Book revenues are contracting as pricing pressure is being felt
The software group grew moderately at 15% as Apple’s apps are reaching saturation within the iOS user base and as Mac sales stagnate.
As a reminder, you can order the iTunes Business Review from the Asymco Store.
Last week Frank X. Shaw, VP of corporate communications at Microsoft stated:
... most of the people around me were using their iPads exactly as they would a laptop – physical keyboard attached, typing away, connected to a network of some kind, creating a document or tweet or blog or article. In that context, it’s hard to distinguish between a tablet and a notebook or laptop. The form factors are different, but let’s be clear, each is a PC.
Actually this "admission" that iPads are PCs is not something new. Steve Ballmer made the same assertion in 2010 pre-iPad (though calling them slates). Arguably, the notion that tablets are PCs has been dogma at Microsoft for over a decade and Windows running on all form factors has been a strategic guiding principle.
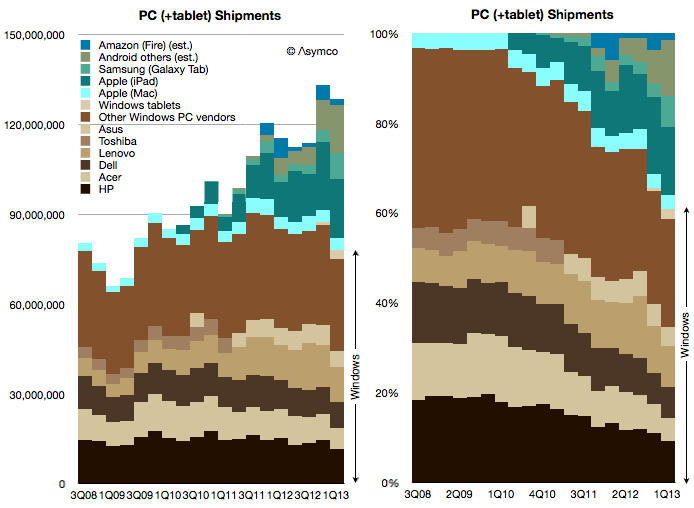
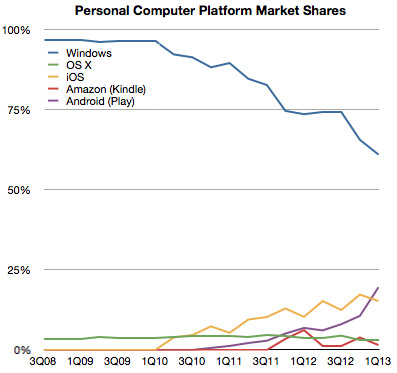
Which is why I've always added the tablet data to the PC data to create a picture of the "personal computing" market. And this is what that picture looks like today:
Note how the share of various platforms has evolved over this brief time span:
Seen this way, Windows has now reached 60% market share and it's likely to dip below 50% during this year. What happens beyond then is harder to imagine. If Windows tablets start growing as fast as the tablet market overall then Windows could stabilize in share. But if Android and iOS tablets follow their phone brethren in growth then it will be far harder for Microsoft to maintain share. But is that cause for concern?
Not necessarily.
The total computing market[1] is likely to expand to over 4 billion users with 1.5 devices per user in the next five years. That expansion implies that 20% share equals more than one billion devices, making such an ecosystem "good enough" for the average developer. It certainly has been good enough for Windows developers to date and they have kept hiring it throughout the new mobile app revolution.
So even if Windows dips to only 20% of the world's computing market it will still be perfectly "viable" for some time to come.
--
I define the computing market as the total number of devices which have (a) a CPU (b) a broadband connection (c) a native application execution environment which is open to third party apps. This definition implies the presence of an "ecosystem" which is bound specifically to a platform.