Asymco

Asymmetric Intelligence

iPad

  1. Margin call update: About those changes in service policies

    Research · 21 comments

    In the March quarter, our gross margin was 37.5%. It was at the low end of our range. We had a few items that on balance resulted in us reporting at the low end. They included mix, in particular, selling more iPads than we had planned, including getting iPad mini into our four- to six-week channel inventory range, some changes in our service policies that required us to make provisions for prior quarter sales, and we had some unfavorable adjustments.

    - Peter Oppenheimer, Apple CFO, FQ2 2013 Earnings Conference Call

    [my emphasis]

    Thanks to Philip Elmer DeWitt for bringing this quote to my attention in the comments to Margin Call 2.

    I was curious about the "changes in service policies" and what that might have meant, especially since they seem to have been retroactive (provisions for prior quarter sales).

    The 10Q offers more details:

    Accruals for product warranty for the three months ended March 30, 2013 include $414 million associated with product sales in prior fiscal periods reflecting the impact of changes to certain of the Company’s service policies and other estimated warranty costs. Of this amount, $224 million is associated with product sales in the first quarter of 2013, and the remainder is associated with product sales in 2012.

    - Apple 10Q, Note 6, Page 17, second paragraph.

    These service policy changes were made around April 1st and were in response to editorials in the People's Daily, the official paper of the Chinese Communist Party. Though seen as a PR issue, their impact goes beyond the company's image. Changes in warranty policy implies setting aside some of the revenues as an expense, increasing the cost of sales and reducing margins.

    The 10Q says that $190 million of the additional warranty set-aside was for prior quarters and that $224 million was for the March quarter.

    If we were to subtract the $190 million from the cost of sales the gross margin would increase from 37.50% to 37.93% and if we subtract the full $414 million the gross margin would increase to 38.44%.

    The calculations are shown in the following table:

    SalesCost of SalesGross margin
    Q1$43,603$27,25437.50%
    Q1 adjusted for change in service policies in 2012$43,603$27,06437.93%
    Q1 adjusted for change in service policies in 2012 and 2013$43,603$26,84038.44%


    If we read 2012 and 2013 as meaning fiscal years then the entire $414 amount is for prior periods (i.e. not for the current quarter) and the gross margin for Q1, excluding one-time items, would be nearly 1 percentage point higher than reported.

    The effect of the change in policy would have been very difficult to anticipate when estimating the gross margin, even for Apple's own team three months ago.

    It's also important to note that this does not say much about the supposed effect of competitive pressures on Apple's margins. 38.44% gross margin is not as good as last year's, but they're pretty good.
  2. Margin Call 2

    Research · 164 comments

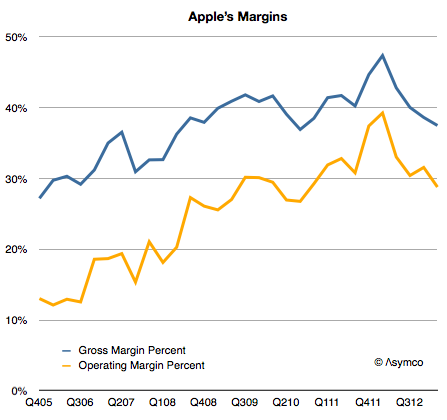
    I expected Apple's margins to improve  last quarter. They didn't and so the question I needed to answer is why. Here is a history of Apple's gross margin and operating margin as reported since late 2005:

    Screen Shot 2013-04-25 at 4-25-9.26.53 AM

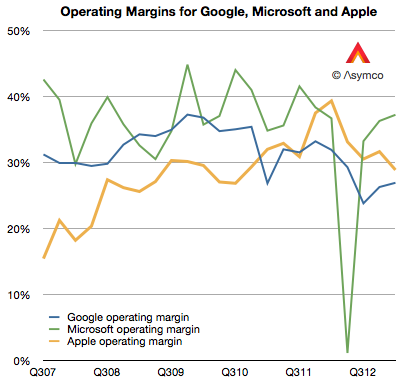
    For a company selling hardware these are extraordinarily high margins. They are higher than those of Google and have narrowed the gap with Microsoft,  neither of which has a high proportion of hardware sales:

    Screen Shot 2013-04-25 at 4-25-10.06.04 AM

    But they are not growing and the reason is to be found in the reason they grew in the first place: because of proportion of iPhones making up the total sales.

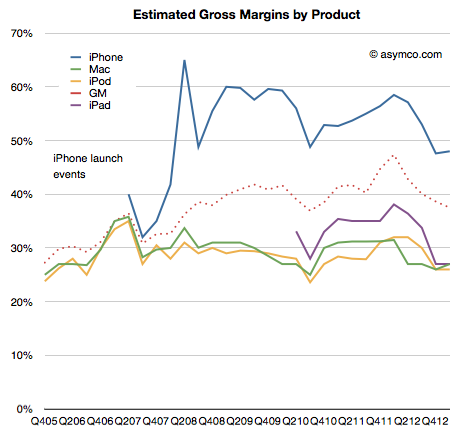
    As a reminder, the iPhone is a uniquely profitable product. I estimate that it obtains about 50% gross margins. The history of these estimates is shown below:

    Screen Shot 2013-04-25 at 4-25-9.32.34 AM

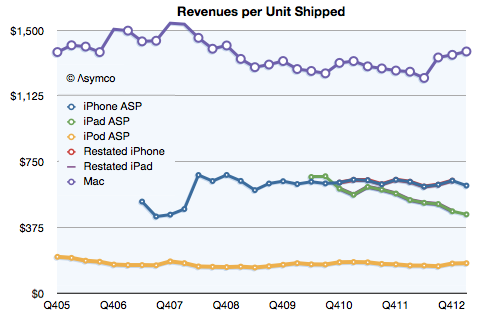
    It remains in stark contrast to the margins Apple obtains for its other products. Much of that is due to the pricing power of the product as shown below:

    Screen Shot 2013-04-25 at 4-25-9.33.13 AM

    Notice that even after the launch of the iPhone 5 and the persistence of two previous generations of iPhones (and their lowered pricing) has barely put pressure on pricing.

    Contrast that with the iPad. As its breadth of offerings increases, it causes a lower price per unit.  The iPhone is now at $613 per unit, even with two older generation products available. (The lowest price was in Q2 2012 when the average price was $608.) The iPad is at $449 per unit, down from $662 at launch three years earlier.

    So overall, margin is a function of three things:

    1. Price changes: iPhone had a small reduction (from $635 to $613) but the iPad has had a moderate reduction in price (from $531 to $449).
    2. Cost of components: This is reflected in product-line gross margins which can only be estimated. Compared to last year I estimate that iPhone gross margin dropped from 58% to 48%. iPad margins also fell from about 38% to 27%. The reasons were given by management as "Last year, our business benefited from …a more favorable foreign currency environment, and historically low costs."
    3. Mix of high and low margin products. The iPhone units grew at 7% but the iPad units grew by 65%. A year ago iPhones were 58% of revenues and this year they were 53%. The iPads were 17% and now they are 20%.

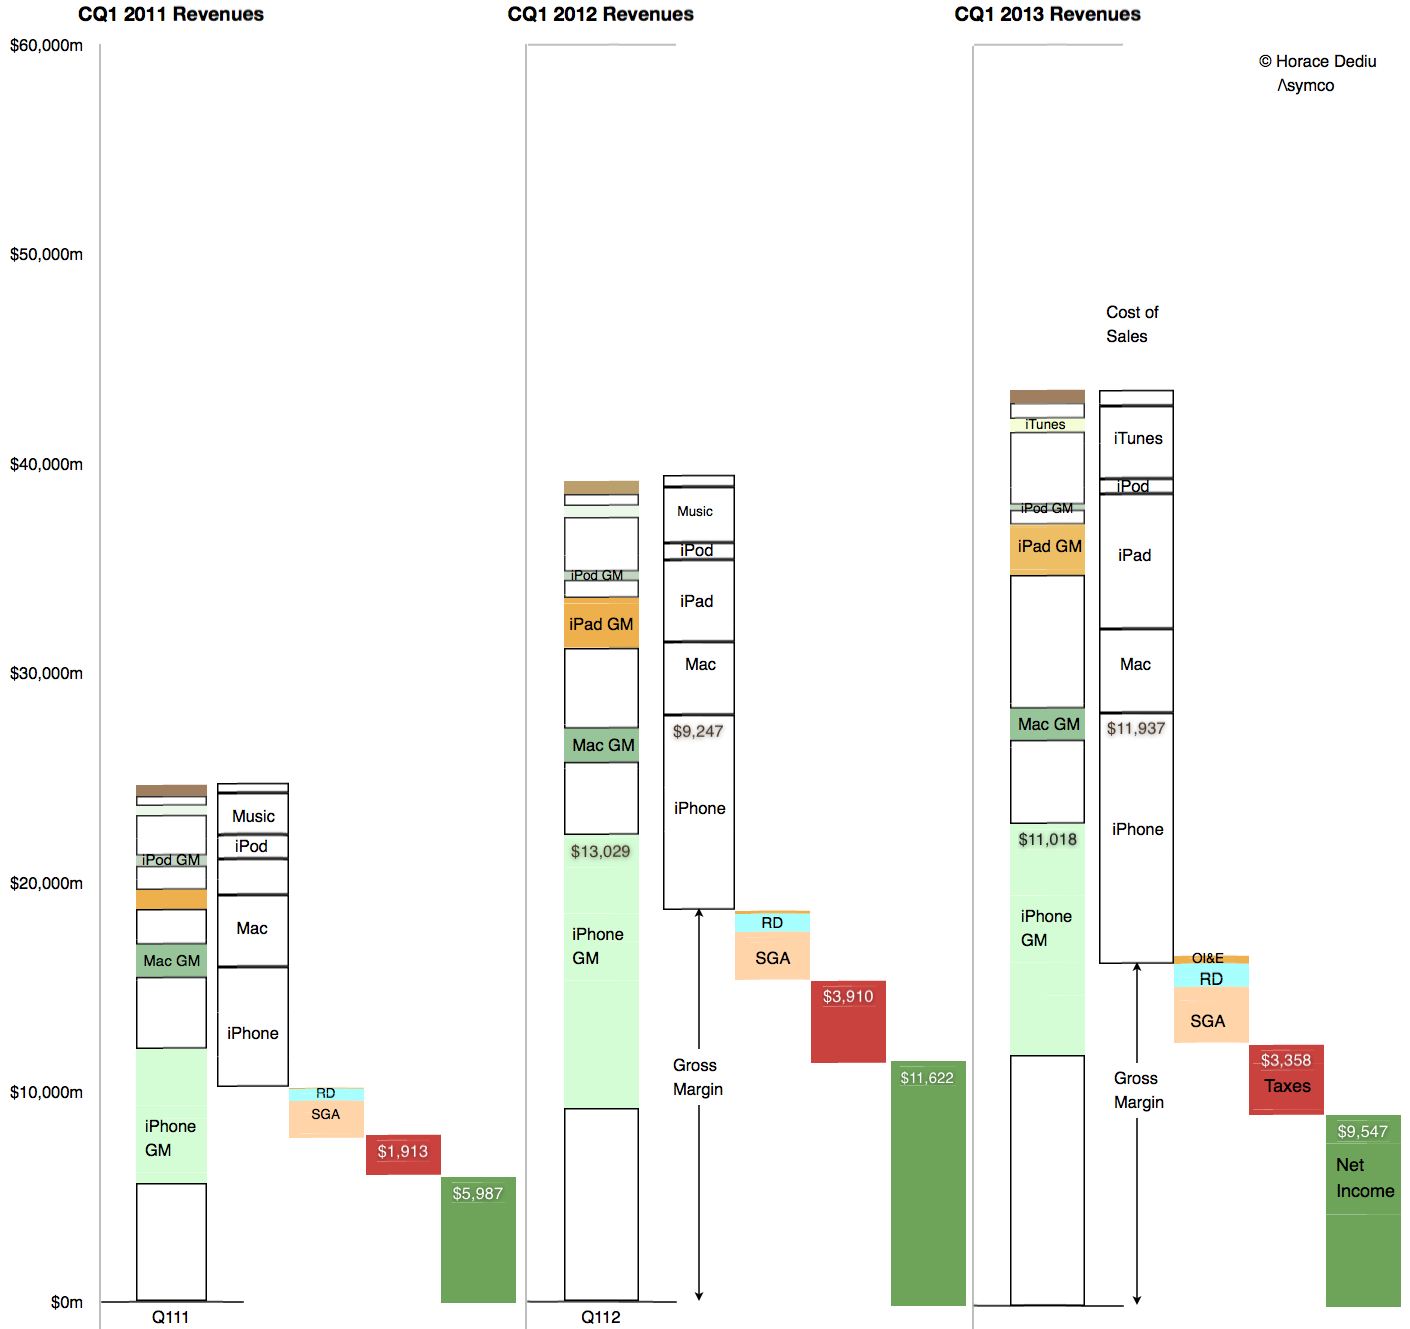
    The result is seen in this one graph showing the allocation of revenues and margins by product:

    Screen Shot 2013-04-25 at 4-25-8.46.04 AM


    So what is surprising? My expectations were met in terms of iPhone units (and exceeded in terms of iPad units). The mix was also something that falls out of the unit expectations. The pricing is also not  surprising.

    My guess is that the largest contribution to the "reduction of margin" is the increased cost of components. Note that the graph implies that even though iPhone revenues were nearly flat at 3% growth, the cost of those revenues went up by 29%! In addition, the iPad revenues grew 40% while costs went up 65%.

    Unit pricing (and implicitly competitive pressure) is still not the primary cause of the reduction in Apple's margins. Indeed, the curious thing is that margins are now at levels seen for most of 2009 and 2010, a time when the iPhone (and iPad) were seen as near monopolies in their respective categories.

  3. iTunes Segment Revenues in Context

    Research · 23 comments

    In the last few posts I estimated the iTunes economy in some detail. In absolute figures, the revenues and cost structures of iTunes are substantial:

    • 6.3 billion transactions in the last quarter
    • $4.6 billion consolidated revenues (including software & services)
    • $3.3 billion in content payments
    • $650 million in operating income

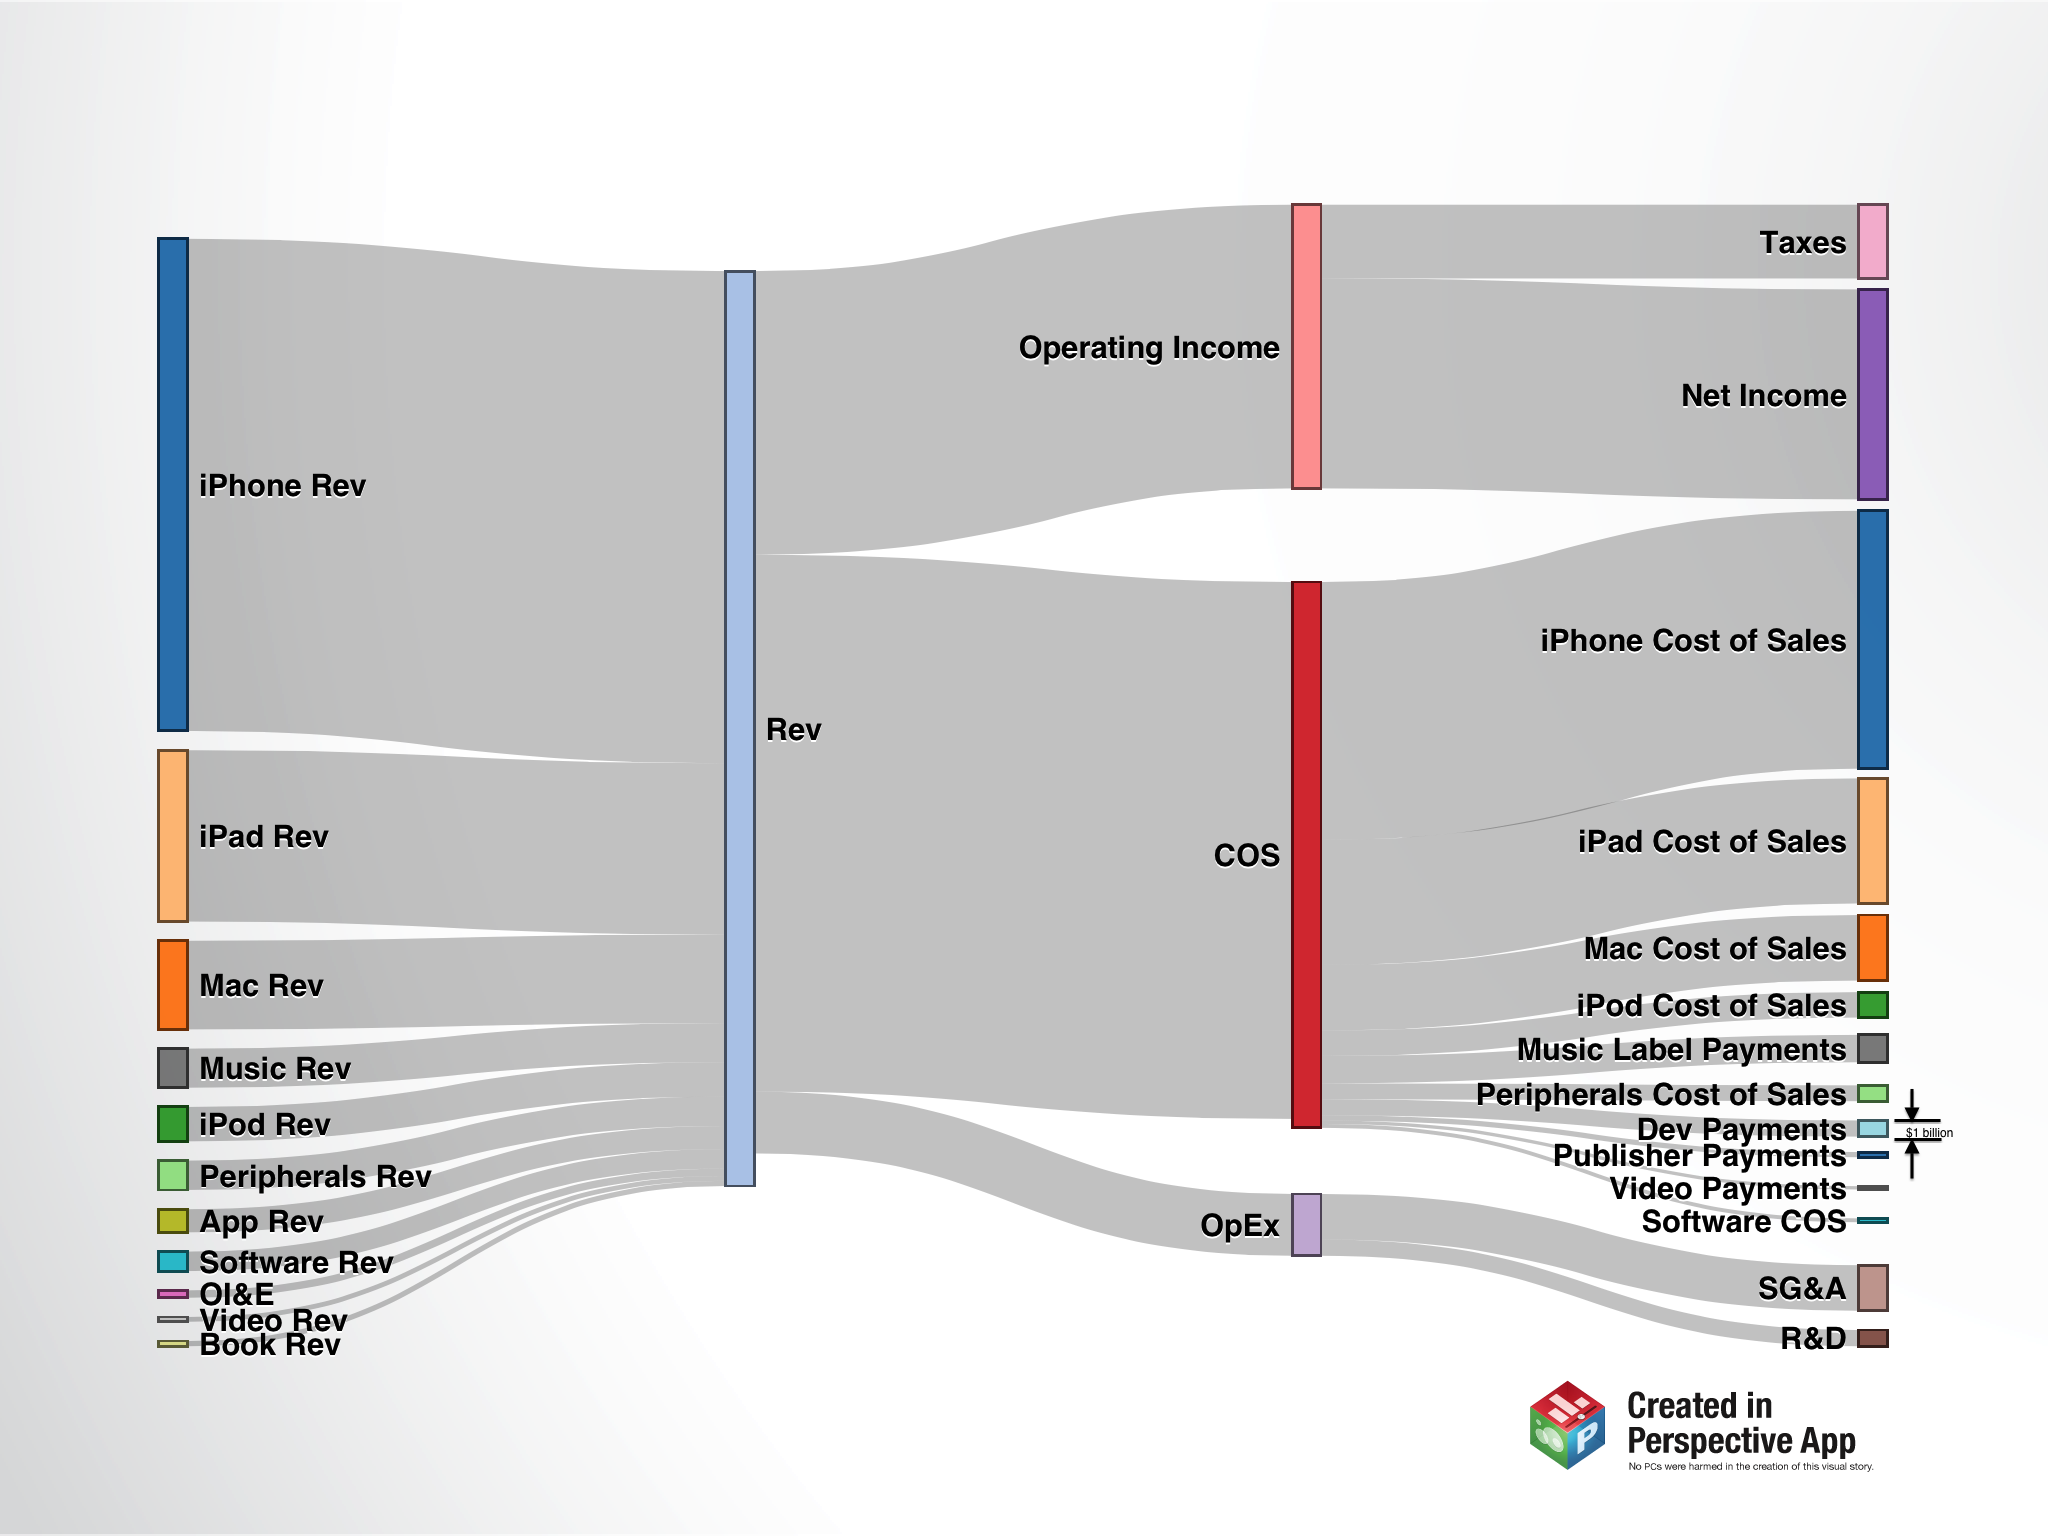
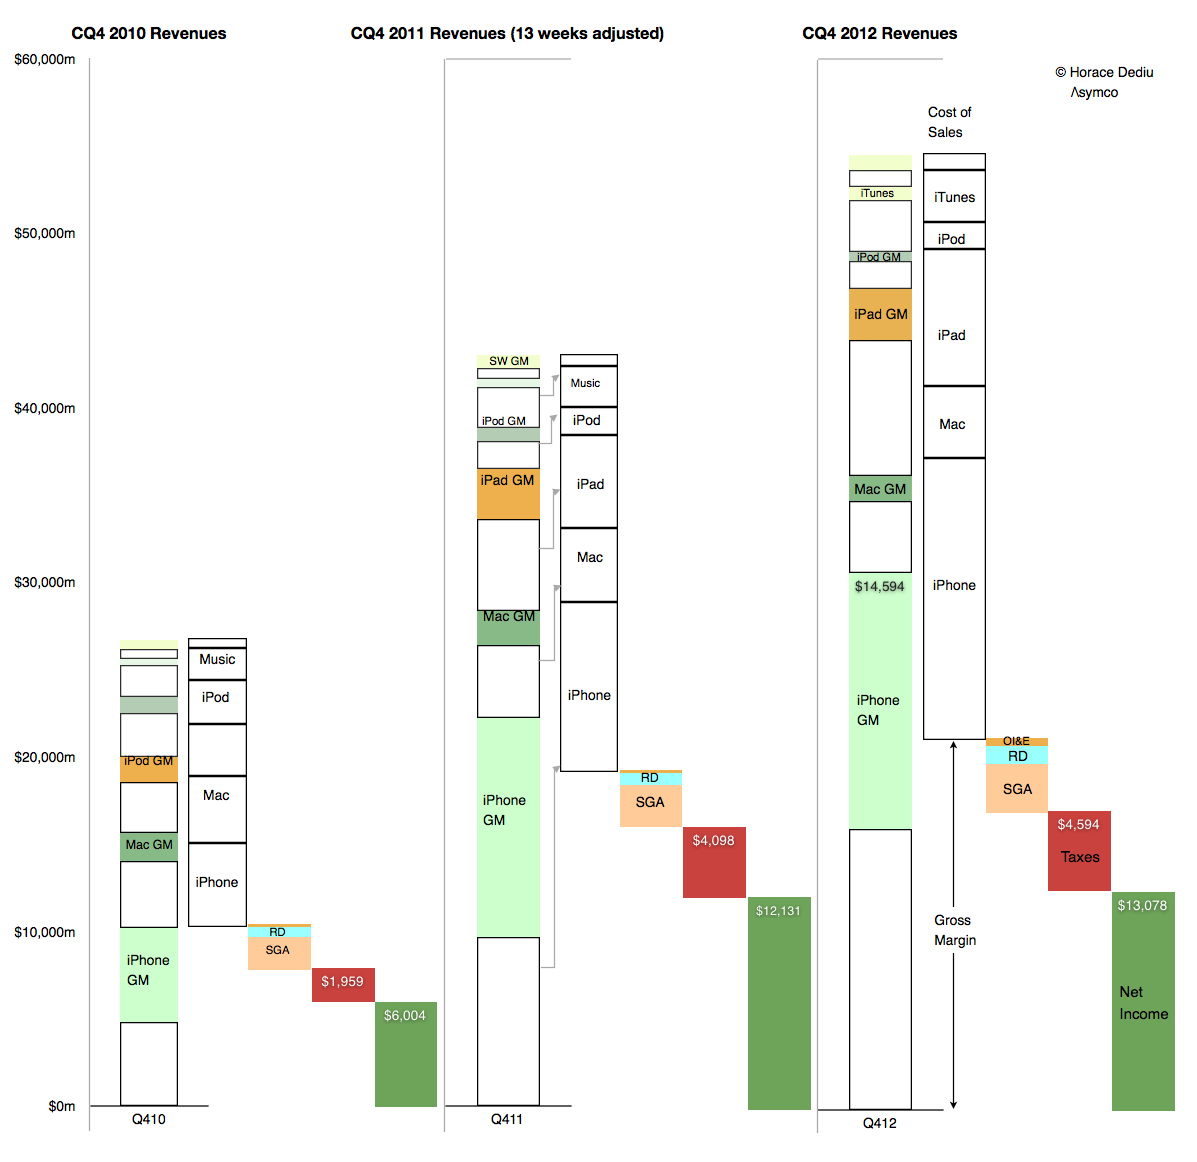
    However, as a part of the entire Apple revenue model, iTunes appears to be a small contributor. The following diagrams shows where revenues came from and where they were spent during the last quarter

    Sankey-Income1

    A few notes:

    1. Click on image to enlarge. The graph was produced using an iPad and it is rendered at iPad retina resolution.
    2. The data covers only the Fourth Calendar Quarter of 2012.
    3. For scale reference, "Dev Payments" equals $1 billion (as marked.)
    4. When zoomed in, each pixel represents about $50 million (vertical dimension).
    5. Revenues shown are "gross" and therefore greater than reported. See post on iTunes Revenue Recognition. �The same reason affects the total Cost of Sales (COS).
    6. Sources of revenue are ranked according to size. Note that Music is higher than iPod or Peripherals and Apps are higher than Software.
    7. Different Cost of Sales components are also ranked by value.
    8. iTunes which is the sum of Music, App, Software, Video and books makes up about 7% of overall revenues but 10% of costs of sales and hence contribute about 4% (est.) of total operating margin.

    A three year view of the same data is shown below:

    Screen Shot 2013-03-26 at 3-26-2.07.06 PM
  4. Apple's Calendar Fourth Quarter 2012 Growth Scorecard

    Research · 20 comments

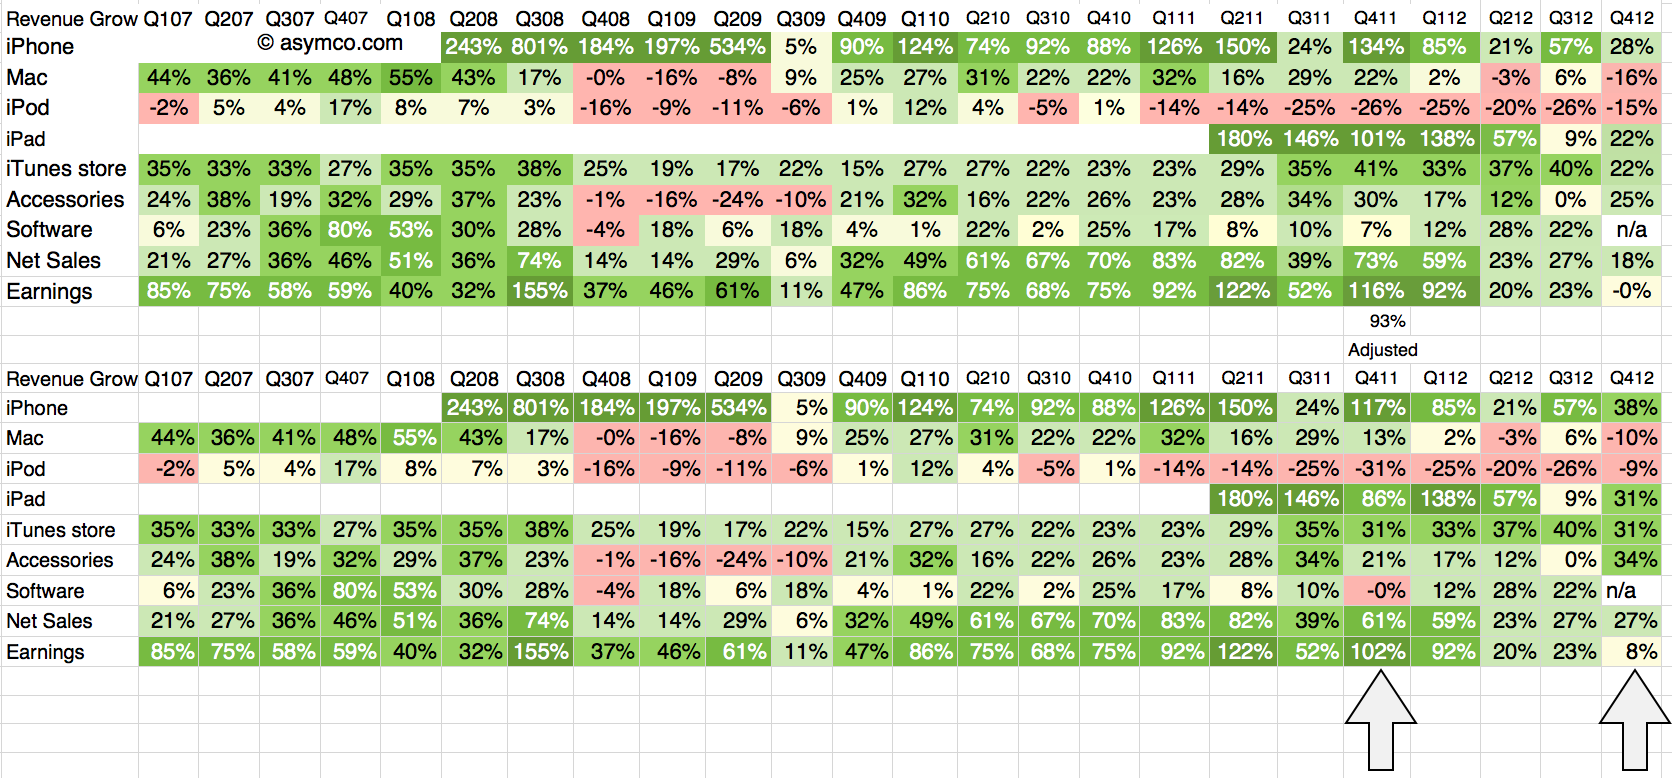
    The fourth quarter of 2012 was 13 weeks in duration while the fourth quarter of 2011 was 14 weeks. The difference implies that a comparison of revenues should be done with an adjusted 93% of the 2011 values. The growth for 4Q 2011 relative to 4Q 2010 should also be adjusted on this basis.

    The following tables show the unadjusted and adjusted growth rates. The adjustments apply to the bottom table and the columns highlighted.

    Screen Shot 2013-02-04 at 2-4-7.19.18 PM

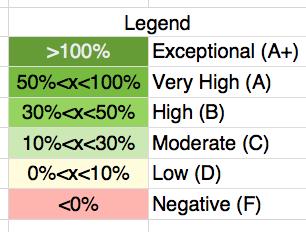
    As in previous scorecards, I used the following color scheme to "grade" the performance.

    Screen Shot 2013-02-04 at 2-4-12.14.53 PM

    The adjustment brings growth in sales to a respectable 27%, well above the 18% unadjusted level. In fact, using the color map grading system four lines increase their rating from "Moderate" to "High" growth: iPhone, iPad, iTunes, Accessories all move from the 20's to 30's  percent growth.

    The bottom line moves from 0% to 8% growth but it's still low relative to historic performance. That had to do with margins; more about that later.

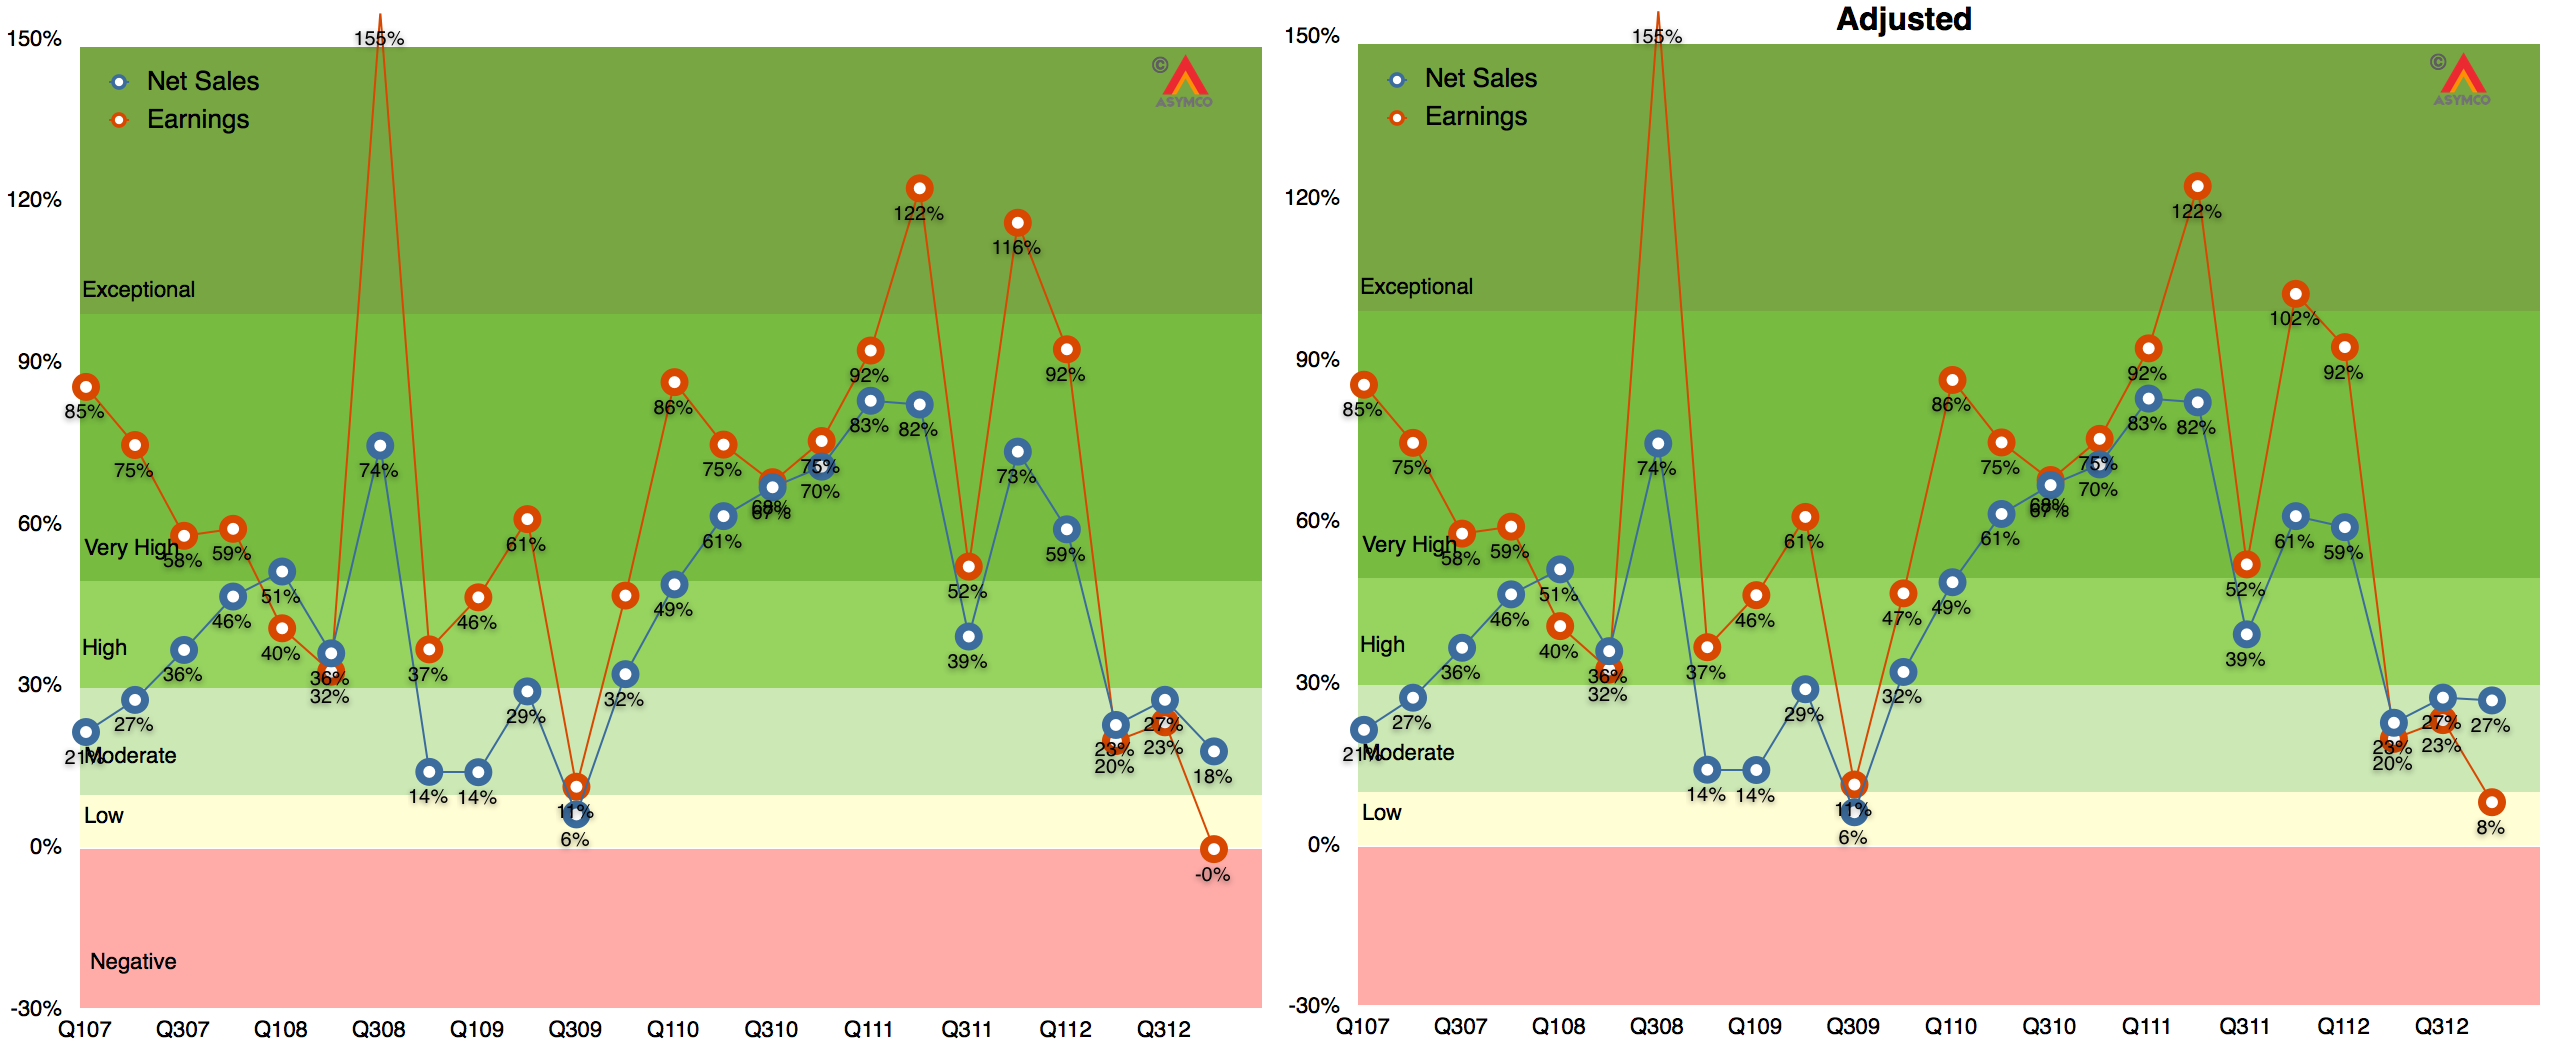
    The graphs showing Revenue and Earnings growth with and without adjustments are shown below:

    Screen Shot 2013-02-04 at 2-4-7.21.34 PM

    Note that iPad, iPhone, Accessories and iTunes/Software are based on re-stated figures.

    Note also that the adjusted 2011 growth rates do not change dramatically with only iPad changing from Exceptional to Very High.

  5. The job the iPhone is hired to do

    Research · 94 comments

    In the latest quarterly report Apple changed how it reports product revenues. In previous quarters the iPhone and iPad were reported including accessory revenues while iPod accessories were reported under "Music" revenues.

    "Under this new format revenue from iPhone, iPad, Mac and iPod sales is presented exclusive of related service and accessory revenue […] revenue from all Apple and third party accessory sales is presented as a single line item [Accessories.]"

    Apple provided a document showing re-classified product summary data.  By measuring the difference between original revenue and re-stated revenue per product we can determine how much service and accessory revenue was being attached to each product.

    I did this for two quarters as a sample:

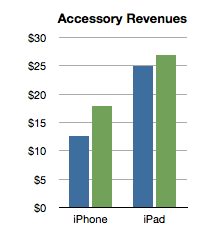
    Screen Shot 2013-01-24 at 1-24-2.16.14 PM


    The analysis shows that the iPhone has been receiving about $15 of accessory attached value and the iPad about $25. Interesting trivia, but how is this insightful?

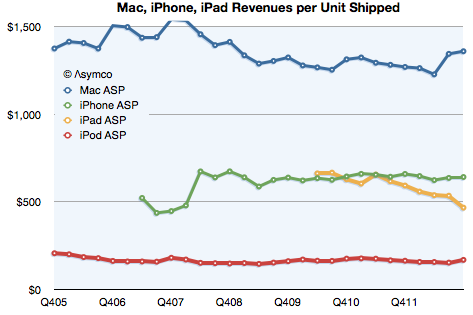
    Consider the impact on this analysis of revenues/unit shipped:

    Screen Shot 2013-01-24 at 1-24-2.31.52 PM

    The iPhone obtained about $642 revenue/unit (shown above as the last datum in the green line). That compares slightly lower with last year's $659/unit. However, the latest quarter is on the new basis and the data in the chart above shows old basis.

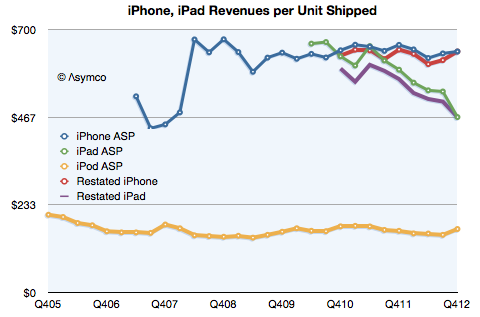
    Here is the data with re-stated iPad and iPhone ASP:

    Screen Shot 2013-01-24 at 1-24-4.29.37 PM

    On a re-stated basis, without the extra revenue from accessories, the iPhone "ASP" (Average Selling Price) from a year ago becomes $646 (which, again, is not what is reflected in the graph). This is almost exactly the same as the current quarter. The iPhone "ASP erosion" therefore goes from 2.6% to only 0.7%.

    Similarly, the iPad shown at $467 in the latest quarter does not drop from $593 last year but from $568. Its ASP erosion becomes 18% rather than 21%.

    Interesting resilience with the iPhone and slightly better support for the iPad price. What does it mean?

    Pricing power is the most important indicator of differentiation and it implies an ability to create value in excess of cost. Not only that but it also indicates whether a product is being "commoditized" by over-serving the market and being substituted by lower priced alternatives.

    In the case of the iPhone the tenacious retention of its ASP indicates that the point of over-service has not been reached. Buyers are not yet switching in significant numbers to the older, cheaper variants available from Apple. If they were we would see evidence in the price first due to the change in mix.

    Contrast that with the iPad where there is a far more marked erosion. That's due to the introduction of the mini which is good enough to substitute for the larger version for many of the jobs it's hired to do. We can safely argue that the iPad is good enough in smaller form factors and addressing larger markets.

    But why isn't this happening to the iPhone? Why isn't the iPhone n-1 "good enough"? Surely consumers can do almost the same tasks with an iPhone 4S as they can with the 5. Why are they still buying the new phone?

    The clue comes from the fact that the consumer is not the only buyer. It's  operators who buy and re-price the product. They are hiring the product to sell broadband and the newest variant is still the best hire to do that job. This observation is crucial to understanding the growth dynamics of the iPhone and consequently, of Apple itself.

    I repeat what I've mentioned before: The iPhone is primarily hired as a premium network service salesman. It receives a "commission" for selling a premium service in the form of a premium price. Because it's so good at it, the premium is quite high. Also because it's so good, it gets bought in large batches which allow Apple to schedule production efficiently.

    This understanding gives us a solid basis from which to evaluate its growth potential.

  6. Estimates for Apple’s first fiscal 2013 quarter

    Research · 130 comments

    I've postponed my estimates for the fourth calendar for a long time. The reason is that there have been conflicting data to deal with and I've been hoping for some clues to give clarity. Unfortunately, even though I waited, I have not received many clues. Here are the challenges we have to deal with in this quarter:

    1. Management gave very low guidance for the quarter's earnings and sales. Normally this should not be a concern since the long-term pattern has been for them to "sandbag" significantly. For example last year's fourth quarter was guided at $9.3 EPS while the company delivered $13.87, a 49% "beat" to their guidance. However Q2 and Q3 beats were only 7% and 13% respectively and if we assume a similar number (10%) for Q4 we get about $13/share which would be a year-on-year decline in earnings (down from $13.9). This has not happened for many, many years. Management explained this through a lengthy set of reasons including a shorter quarter (13 weeks vs. 14 weeks), new product launches, currency fluctuations, deferrals and unfavorable component pricing. Then again, similar explanations were used in the past with no reflection in what actually happened.
    2. Management also launched a large number of new products. This normally leads to a surge in sales. In fact, 80% of revenues would come from a new portfolio of products. Having such a broad launch quarter into a holiday, would normally imply huge growth. Not only is this a critical launch quarter for many products but they also rolled out the iPhone to more markets more quickly than ever: 100 countries in three months. The broad roll-out implies a steeper ramp in production and thus more volumes. This would also contradict the lowered expectations from the CFO. However...
    3. Production was constrained. It was quite a long time before waiting times decreased for the iPhone--longer than what we saw last year. In the earnings call Tim Cook said "It's difficult to predict when supply and demand will balance, but I'm feeling very confident on our ability to supply quite a few iPhones". This again implies significant acceleration but did they achieve the targets? He did also announce that they met their target of 100 countries during the quarter but it's not clear if this was as quickly met as they would have liked.
    4. Margins are complicated. Launch quarters have lower margins typically and this is well understood. However, we have new products in the form of a new iPad at a new price point as well as the new iPhone which may have had some difficult manufacturing issues (i.e. yield). So how much faith do we put in the perennial pessimism in guidance?
    5. There was a vast increase in CapEx in the prior quarter. Normally CapEx spending "leads" production and is in proportion to it. However, the surge in Q2 and Q3 seemed to be unmatched by vast new production, at least that's what we are led to believe by both consensus and by management guidance. Did this CapEx differ in character from previous CapEx? Was it more "strategic" and less "tactical"? Will the disconnect continue?

    There are also the deeper questions:

    • Why there are no new operators being signed? The addressable market has not increased in the last 6 months. Why?
    • Is there a faster product cycle in the works? Is there a shifting of gears to a new product development process?
    • What's the nature of the relationship with Samsung as a supplier? Is their replacement characterizing the new type of CapEx spending?

    All these currents make this quarter doubly difficult to forecast. And it does not help that it comes on the back of two weak quarters which were argued away as exhibiting transition effects.

    So I'm very uncomfortable with my forecast and find it hard to defend this quarter. I considered not publishing one at all because it gives too much confidence when none is warranted. However, I received so many requests to publish that I relent and offer the following:

    • iPhone units: 55.5 million (50%/62%)
    • Macs: 5.0 million (-4%/+3%)
    • iPads: 24.4 million (58%/70%)
    • iPods: 11.2 million (-27%/-22%)
    • Music (incl. app) rev. growth: 25%/38%
    • Peripherals rev. growth: 10%/19%
    • Software rev. growth: 5.5%/14%
    • Total revenues: $60.0 billion (30%)
    • GM: 39.8%
    • EPS: $15.74 (13%)

    I included two growth figures (in parentheses). The first is a straight y/y value and the second is adjusted by assuming there were 13 weeks last year (and that sales were evenly distributed over those weeks).

    [We'll get a chance to go over this forecast and what is actually reported at Asymconf. Don't forget to sign up.]

  7. Does S stand for Spring?

    Podcast · 78 comments

    John Sculley:

    "I think they're going through a very significant change now in terms of product cycles," Sculley explains. "Traditionally Apple introduces products once a year; now it's really introducing products twice a year. The complexity of that from a supply chain is immense, and Apple seems to be doing it well. So, I think that people are underestimating just how well Apple is run, and just how successful the company can be when it gets to that twice-a-year product introduction cycle."

    Former Apple CEO John Sculley: Apple is well-run | TUAW - The Unofficial Apple Weblog

    Suggesting that Apple is moving to a semi-annual cycle is a very provocative thing to say, but it's something I've also speculated is happening during a Critical Path podcast.  Sculley's comments prompted me to weigh the possible evidence that this is happening:

    1. All of the major products which Apple sells have been updated in the Fall. This is unprecedented. Not only were product launches scheduled in the spring, historically they had been spread throughout the year. The odds that they happen to coincide by accident are nil. Not only that but the move of iPad and iPhone and iPod and MacBook and iMac to launch all within Fall (once a year) seems risky because it leaves a vast gap for competitors to fill six months hence. Indeed, given the iPhone's launch predictability, many (most?) competing products already target launching in the Spring.
    2. Launch ramp for iPhone steeper than ever. The number of countries and operators launching the product in the launch quarter is nearly the entire distribution list. This is also the first time this has happened. Not only does it imply a very steep ramp, it indicates no channel fill will be happening past Q1. There will not be incremental sales to unserved customers as the fiscal year wears on. 
    3. Consumer anticipation. This year saw two quarters where sales were soft due to "product transitions" as awareness among the mass market of new product rumors caused growth to dry up. Too many potential buyers are now conditioned to wait for fall to buy iPhones thus sapping demand for half the year. Apple ends up with an inability to meet demand for half the year and a sales lull for the other half. Clearly this is suboptimal.
    4. Hon Hai production has shifted to locations closer to the sources of labor. This may not seem to be relevant but we have to appreciate that Apple makes up nearly half of Hon Hai's sales volume and hence labor demands. Until this shift, Hon Hai's production has depended on migrant labor which is difficult to manage. Moving production so that the labor is local means a steadier workforce with better economies from learning curves. However it also requires a more stable order book. Production for Apple has tended to be "bursty" with breakneck round-the-clock crush followed by periods of idle time and re-tooling. This is not only inefficient but it also creates strain and stress and lowers morale.
    5. Capital Expenditures de-coupled from volumes. This is a weak signal at this time and needs confirmation, but capital expenditures seem to be outpacing production. The recent bursts in CapEx may be transient or may have to do with tooling-up Samsung's replacements but it may also imply a move to a more rapid product cycle. A transition to a new operating model would require significant over-spending in advance of the shift.
    6. Rumors of 5S products in pre-production. This is the least valuable piece of evidence but it might indicate that the "S" variant is targeting spring launch. I should point out that the "facelift" model change is common practice at many phone companies. At Nokia the convention was to launch an "i" variant to a model before a bigger update. Even at Apple, the iPod was going through a re-fresh during February with a "Valentine's Day" variant being released. Then there's the case of the white iPhone 4 which seemed to take forever to launch but finally did so into an April time frame. Finally we just saw the iPad retina product go through a six month cycle.

    Admittedly, these are circumstantial pieces of evidence but they do corroborate Sculley's claim of a six month product cycle.  Put another way, if Apple is not switching to a six month cycle then there seems to be a lot of stress for no benefit.

    I would also add that this change in cycle time is an enormous undertaking. Since Apple is an integrated company, not only production but marketing, design, hardware and software engineering must be re-configured. To put it in perspective, when Ford changed its operating mode from producing one model to a flexible mass production method pioneered by General Motors, the company had to shut down for production for six months.

    The operational aspects are daunting and would affect almost all employees in the company. Therefore if it is happening it's also possible that there is some knowledge of this change dissipating outside the company, perhaps explaining Sculley's confidence in the claim.

    --

    Looking for more information on the renaissance of production and its the effect on the technology industries? Then come to Asymconf and take part in the debate.

  8. The Android engagement paradox

    Research · 180 comments

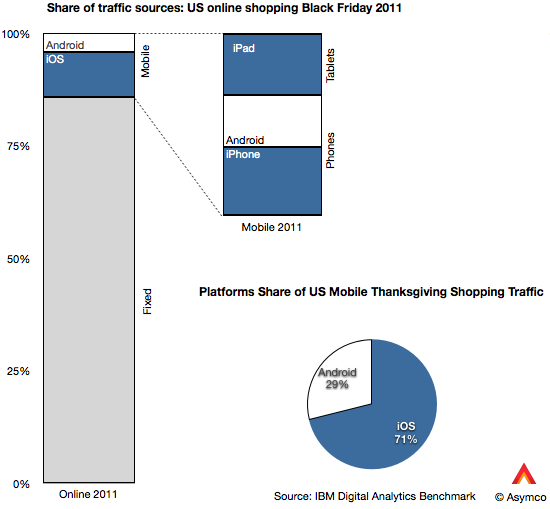
    IBM's Digital Analytics Benchmark reported US Black Friday sales and the news is reasonably good. Overall online sales grew by 17.4% while mobile grew to make up 24% of traffic.

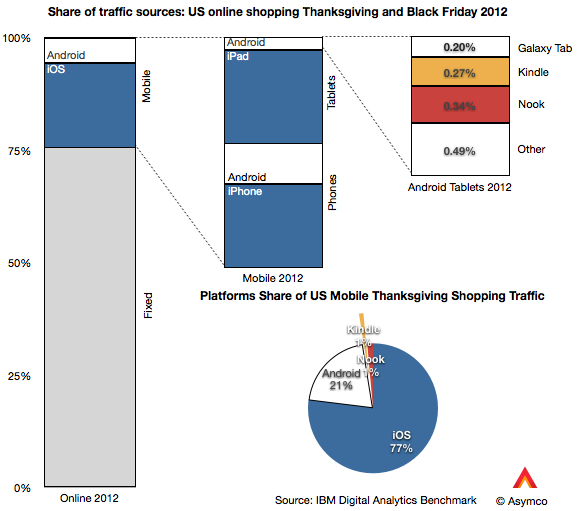
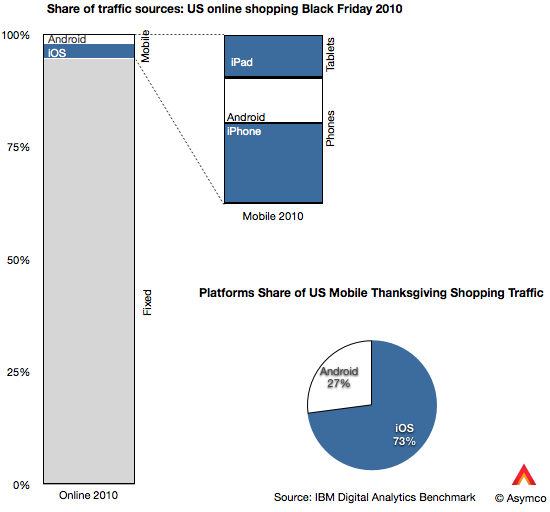
    The data goes further to show the split between device types. I illustrate this split with the following graphs:

    Of the 24% of traffic made up by mobile devices, phones contributed 13% and tablets 11% (or 54% and 46% of mobile respectively). Of the phone traffic, iOS devices were about two thirds of traffic and Android one third. Of tablet traffic, iPad was 88%, Kindle and Nook were 5.5% Galaxy Tab was 1.8% and other tablets were 4.4%.

    Overall, iOS was 77% generated mobile traffic and Android (excl. Kindle, Nook) was 23%.

    That's an interesting snapshot of the consumption of mobile devices, but is there a pattern here? I also took a look at the same data from 2011 and 2010.

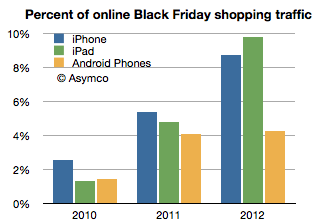
    Besides the pattern of significant mobile growth (from 5.2% to 24% of online in two years) there is the curious effect of iOS growth outpacing Android growth. Android went from 1.43% of Black Friday shopping traffic in 2010 to 4.92% in 2012. In same time iOS went from 3.85% to 18.46%. In other words, while Android is up by a factor of 3.4, iOS is up by a factor of 4.8.

    The reason is evident in the graphs above: the iPad is now the predominant mobile shopping device. You can observe the pattern in the following graph:

    Two years ago the iPad was trailing Android usage but this year it was more than twice Android usage. Curiously, the iPhone seems to also be pulling ahead of Android.

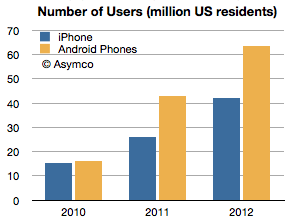
    Curiously because the number of Android users in the US has gone the other way. That data is available from ComScore, though only for phones. (ComScore data for periods ending November each year, Nov 2012 is my estimate):

    Having the number of users and the traffic allows us to measure consumption per capita, so to speak. That is, the percent of traffic per device user:

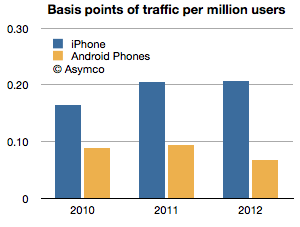
    The ratio shown is basis points of usage (1/100 of 1% of shopping traffic) per million users of smartphones. iPhone users are about three times more engaged in shopping with their devices than Android users. Two years ago the ratio was two to one.

    Overall iPad is changing shopping habits, but it has a near monopoly in its form factor at this point. The bigger question is what is causing phone users to behave differently based on the devices they own. The phone market is more mature and has had several years of competition to be able to discern differences in platforms. The pattern is pretty clear with respect to Android: engagement is down as ownership is up. This pattern has not exhibited itself with iPhone, even though it has had a longer time in market.

    Of course, one would expect that later adopters would engage less, but I find it surprising that US Android users would behave so differently only two years after the platform began to be widely adopted. That pattern is not happening with iOS even after five years and certainly not with the iPad which is about as old as most Android brands.

    This I consider to be a paradox: Why is Android attracting late adopters (or at least late adopter behavior) when the market is still emergent? We've become accustomed to thinking that platforms that look similar are used in a similar fashion. But this is clearly not the case. The shopping data is only one proxy but there are others: developers and publishers have been reporting distinct differences in consumption on iOS vs. Android and, although anecdotal, the examples continue to pile up.

    And engagement is not a frivolous platform attribute. It is highly causal to success because it correlates with all cash flows associated with ecosystem value creation. Especially when a platform like Android depends more on engagement than "monetizing hardware."

    I'm not satisfied with the explanation that Android users are demographically different because the Android user pool is now so vast and because the most popular devices are not exactly cheap. There is something else at play. It might be explained by design considerations or by user experience flaws or integration but something is different.

    ---

    If you'd like to learn more about the Asymco method, come to Asymconf. The next Asymconf will be at the end of January near San Jose. Not only will you learn about how mobile is disrupting computing, you will also get to hobnob with the likes of Om Malik, Jean-Louis Gassée and Michael Lopp.