Asymco

Asymmetric Intelligence

iPad

  1. Apple's Growth Scorecard for third quarter 2012

    Research · 70 comments

    In the parlance of developers Apple keeps "throwing exceptions." This quarter the iPad surprised with a significant decline in sales growth. I placed a table showing the sales growth for this quarter as well as the previous 22 quarters at the bottom of this post.

    Here is a quick review of each line:

    1. The iPhone returned to a more customary growth rate (which I rate as Very Good--above 50%). The quarter was bound to be quirky due to it being both a transition quarter and a launch quarter. The launch of the iPhone 5 came quite late but not too late to make a contribution. It was also widely rumored and anticipated so there was slowing of the previous generation product. I expect growth to accelerate further in the last quarter of the year.
    2. The Mac turned in a commendable 6% revenue growth (1% unit growth) on the back of the new 15" Retina screen MacBook. The average sales price increased sequentially and the mix of portables to desktops reached a new high of above 80%. More about the Mac will be written in a future post.
    3. The iPod continued its decline. The 26% sales decline was in-line with other non-launch quarters. The company tipped its hand and let us know that iPod touch now makes up 60% of iPod volumes. At 3.2 million iPod touch units, it's a significant iOS contributor but still a declining number.
    4. The iPad was painfully underperforming. With only 9% revenue growth, it was a complete reversal of the torrid growth of the last two years. Management blamed both anticipation of a new product and a reduction of inventory ahead of refresh of the larger screen retina. The only silver lining was that the average price decline was moderate (down about $3/unit). Overall, I'm very disappointed with the pause in the product but the new mini could change the character of the product dramatically in a way similar to how the iPod mini turbo-charged the iPod line.
    5. iTunes had a very good quarter. It's the perennial growth engine with the most consistent performance throughout the time period shown. It was the second fastest growing line item firmly in the "High" growth bracket.
    6. Peripherals, including Apple TV had a moderate quarter. Management revealed that about 5 million Apple TV units shipped in the fiscal year. That adds up to a half-billion dollar revenue business. Peripherals had $2.8 billion over the same time frame so Apple TV was about 18% on a yearly basis. This does not include content revenues.
    7. Software had a modest growth of 22% but has come to be the high end of the range. Since changing the way it prices OS X updates, the era of Apple software windfalls is over. Still, at nearly $1 billion per quarter it's nice pocket change, especially as it's nearly all margin.
    8. The overall top line (net sales) was a bit improved sequentially (+4 points of percent) but still in the "transition quarter" range of moderate growth. The company may be shifting its launch cycles and as a result we're seeing a break in pattern. As pricing for iPhone and iPad did not change very much the slowing of top line growth is entirely due to a unit shipment reduction. Again, the primary cause is transitions in multiple lines simultaneously.
    9. The bottom line (earnings) followed the same pattern as top line (slight sequential increase in growth). There was a slight attenuation of margins (gross margins are down to 40%).

    Overall, the quarter was not up to the recent level of performance for Apple. Growth was overall "moderate".
  2. The next 100 million iPads

    Research · 56 comments

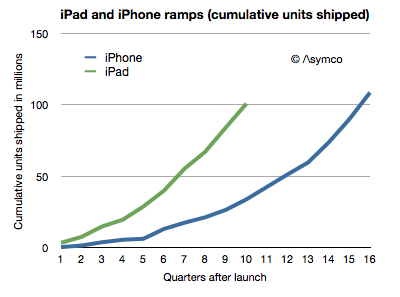
    Having reached 100 million iPads shipped in 2.5 years the natural question is how long will it take for the next 100 million iPads?

    The ramp of cumulative units shipped is shown below.


    I also added the equivalent ramp for the iPhone. [The last data point for the iPad is based on an estimate of 16.5 million units in Q3 which may need revision depending on company reporting.]

    The next 100 million will depend to a large degree on the success of the new iPad mini. To make an estimate we have to realize that there are several aspects of the tablet market which differ from the phone market and that therefore the predictive power for previous data is weak.

    First, the channels are different. Tablets are sold as media consumption or "computing" products. They are not sold as communication devices. Therefore operators have few incentives to promote and subsidize them. They do participate in the distribution but not with the same level of commitment. That means less "push" and opportunity for discovery. Apple has an advantage in this case with their stores and brand value. The lack of operator engagement and lack of points of sale might be one reason why Android tablets have not ramped as quickly.

    Second, for some competitors, the tablet itself is a loss leader and acts more as a terminal into an ecosystem rather than a product in itself. In cases where tablets are given away it's possible that consumers might own one for each platform or ecosystem. This is similar to the game console model where the cost of the console is not a barrier to many avid gamers. This means that penetration of tablets can reach above 100% of users in some markets. Although network connections (i.e. SIM cards) can and do reach well above 100%, the number of phones in use by one person simultaneously is bounded.

    Third, the lifetime of the product is as yet undetermined. Phones tend to last 2 years. This is due to evolving standards as well as high wear and tear and breakage or losses. Tablets are not as "mobile" and are less likely to be used and the basic functionality does not evolve as rapidly. It's possible that replacement rates for tablets will follow more that of notebook computers than phones. Perhaps between 2 and 4 years. I suspect most iPads purchased are still in use today, including the first version. There will be some obsolescence from system upgrades, but the older systems will keep going.

    Some of these aspects of the product could lead to slower growth and some to faster growth. That and the fact that it's a completely new category with business and consumer and educational and vertical applications makes it a difficult product to forecast.

    Having said that, the product is extremely resonant with buyers. The growth to 100 million is testament to that. The liquidity of the product, with no carrier locking and no pricing illusions means that it reaches all parts of the world quickly. So there is no obvious upper bound on the size of population who might buy it. The new price points and form factor may lead to a wave of new adoption, similar to the impact the iPod mini had on the iPod line.

    There are still many factors that can slow growth, especially production capacity, but I believe that the iPad could growth between 50% and 80% which would mean 100 million more iPads could be sold by the end of 2013.

  3. iOS portfolio price distribution

    Research · 35 comments

    With the iPad mini launch imminent, it's time to think about the expanding iOS portfolio. We don't know how much the "mini" will cost or what variants will be available but I took some rumors as a basis to form a hypothesis.

    The idea is that there will be 24 variants which have three dimensions:

    • 2 colors
    • 4 capacities
    • 3 radio chipsets

    The starting point would be $250 for an 8 Gb WiFi only model and increases of $100 for each doubling of capacity and $130 for the addition of cellular chipsets.

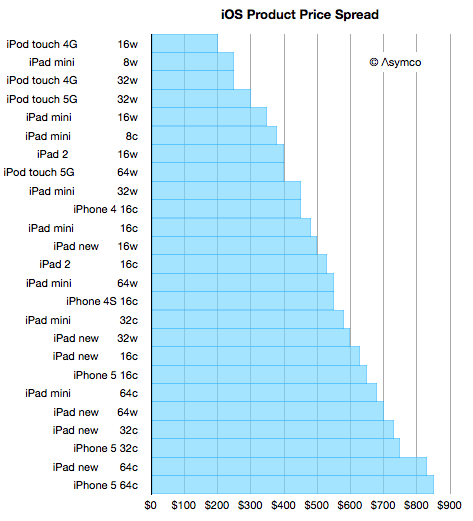
    The results would slot into an increasingly broad price spectrum. I included all the models of iPod touch, iPhone and iPad that we already have available and built the following graph.


    The number after each product name is capacity in Gb and the letter "w" signifies Wifi only and "c" signifies WiFi and Cellular.

    You can look through the list and see whether products of comparable prices are "competing for a purchase decision" or whether there is some marketing logic to the arrangement. I consider the purchase decision not to be determined by price but by many factors like the job being offered by the product.

    But in many cases buyers have a budget and are looking to fit a product into that price. This is more common when the product is a gift.

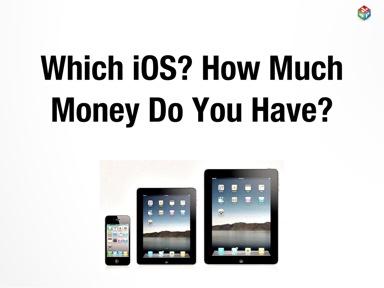
    So with that in mind I created a quick motion chart in Perspective to answer the question: Given a budget, how much iOS device can you buy? You can "dial in" various price points and see what products are available with graphical representation of capacity.

    If you are on an iPad and have Perspective, you can launch the story (with voice-over) through the following link:

    Which iOS? How Much Money Do You Have?.

    If you're not an iPad but have one click on the "Send e-mail" to get a link in your inbox and open it on the iPad.

    If you don't have an iPad but have an iPhone, stay tuned as an iPhone version of the app will be ready soon.

  4. 5by5 | The Critical Path #58: Going Commando

    Podcast · 11 comments

    We discuss composing presentations on an iPad while on the road and, at long last, the completion of the Critical Path book. We examine Apple's honing technique in design, and how it contributes to forging products that are as uniquely experiential as the traditional samurai sword.

    What job is there for the iPad mini to do? How do we stay focused on fundamentals when it comes to analyzing Apple's stock price?

    via 5by5 | The Critical Path #58: Going Commando.

  5. Why are tablets and smartphones insulated from tough economic conditions?

    Research · 50 comments

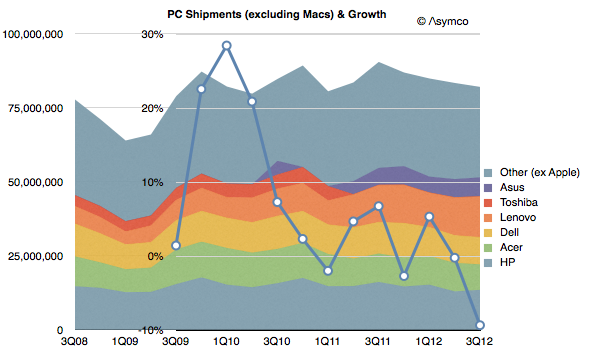
    The iPad launched in April (i.e. Q2) 2010. Since then the PC industry (excluding Macs) has seen a decline in growth. The following graph illustrates global shipments as reported by Gartner:

    Note that the growth rate has been negative for 4 out of the eight quarters since. The latest data shows a decline in shipments of over 9% bringing yearly growth to negative territory for the first time since the recession of 11 years ago.

    There's not much I can say that hasn't been said every quarter since 2010. The industry analysis as provided by Gartner suggests a different cause for the decline, becoming more creative each quarter. This time it's "challenging economic environment" and "lack of appeal and innovation", "delays due to tax incentives", "lack of new models", "conservatism", "clearing out inventory" and "softness".

    The primary challenge to these ascribed causes has to be that all these factors also affect the tablet industry and yet it's growing at phenomenal rates. The rate of new product introductions is not faster for the iPad than for PC vendors. The public and private sector buying conditions are the same. The "conservatism" on the part of institutional buyers should affect the newcomer more than the established.

    The notion that an outside challenger with a new platform, an unproven set of features and missing "security" should grow in the face of difficult macro conditions that are slowing the established platform makes no sense.

    My hypothesis is that the new products are solving new jobs for the users and those new solutions are trumping any "softness" in demand. In other words, an upgrade to an over-serving product will be deferred at the slightest excuse while an installation of an under-serving product that attacks an unsolved problem will be rationalized no matter the circumstances.

    One product will be met with "Why should we buy it?" and the other by "Why shouldn't we buy it?"

    These are the decisions made by millions every day and yet it seems that some analysts don't see any pattern forming. Such is the dilemma of disruption.

  6. Using Capital Expenditures to predict Apple's share price

    Research · 96 comments

    It takes money to make money. That's a cliché. But it's also true. The interesting question is how much can be gained from how little.

    In previous articles I explained how Apple's expenditures of capital for equipment used in manufacturing affects their output of products. The relationship between capital in and product out should stand to reason.

    The more surprising aspect of that analysis is that we get to know in advance how much Apple spends (since they tell us their budget a year before it's spent.) and therefore it becomes possible to get a rough idea of how much they will produce. And since demand has generally been higher than supply we can get an estimate of how much Apple will sell.

    The only missing piece to this logic chain is to estimate how much will shareholders benefit from the capital expenditure. I'll try to establish the relationship through a build-out of graphs.

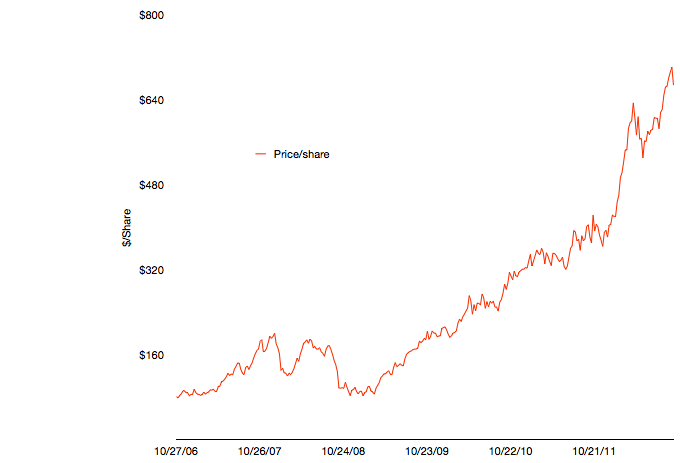
    The first graph shows Apple's share price at weekly resolution.

    The time frame stretches back six fiscal years. The time span includes some dramatic periods including the financial crisis and the launch of the iPhone and iPad.

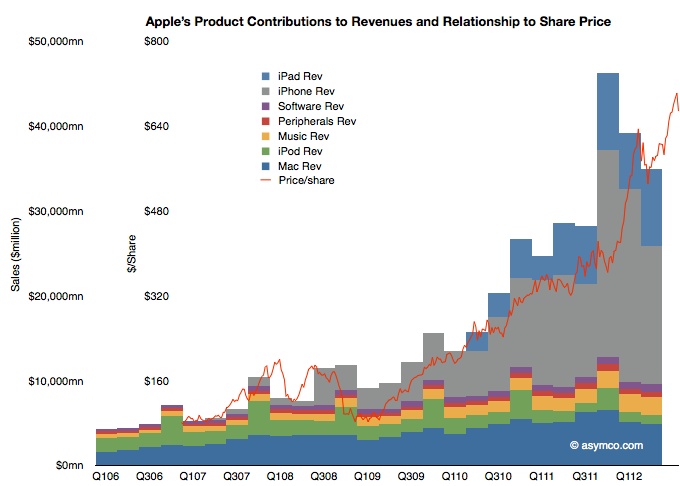
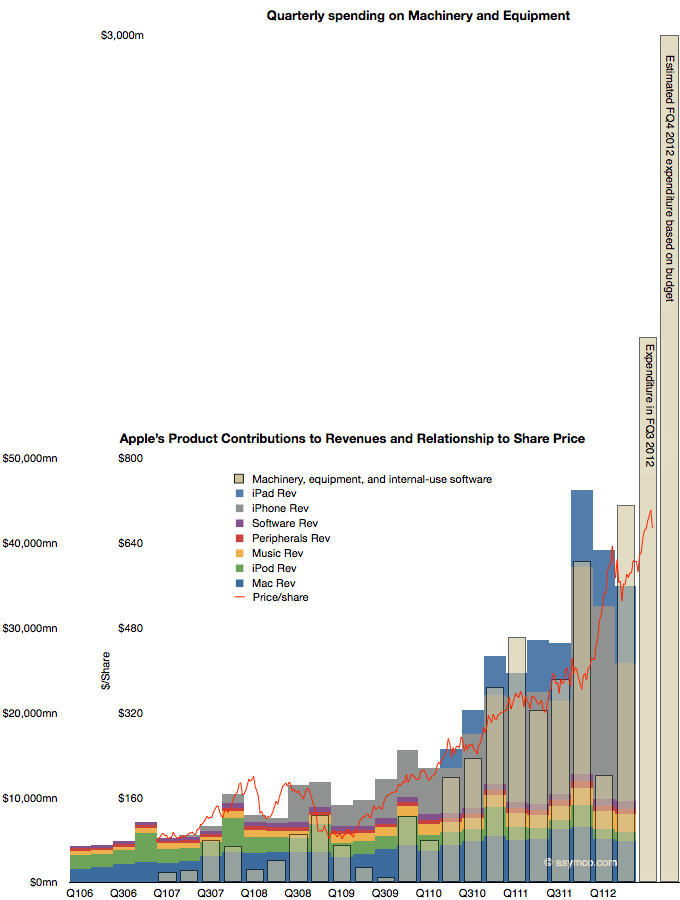
    To illustrate the effect of the iPhone and iPad on this share price appreciation, I've overlaid a quarterly resolution graph showing revenues over the same time period with each product line shown separately.


    Note that I've indexed the vertical scale to match approximately the highest peaks of both graphs. The two axes scales are shown separately on the left.

    The relationship between growing sales and growing share price is plain to see. Note that the iPhone and iPad account for the vast bulk of  sales growth and hence they are mostly responsible for the share price appreciation. Again, this should not be surprising. The scale gives an approximation of the relationship where $50 billion in quarterly revenue roughly yields a share price in the $700 to $800 range.

    As I've shown in the last post on forecasting production using CapEx (focus on the last chart) iOS device shipments (mostly iPhone and iPad) correlate with capital expenditures in the previous quarter. Using the historic relationship, the next two quarters could see a significant increase in iOS unit production. The sum of the low end of the range implies about 163 million units.

    If the relationship is therefore CapEx -> Production and Production -> Share price appreciation, then the transitive implication is that CapEx -> Share price appreciation.

    That relationship would be illustrated as follows:

    The CapEx data shows the offset to the right due to the relationship with production being time shifted by one quarter. Recall that expenditures are booked ahead of output and therefore we have this apparent view into the future.

    The fourth fiscal quarter's spending has just ended and the output will be produced during October-December period.

    The obvious question is whether production will increase in response to spending (as it has in the past), or, put another way, will the stacked bar areas follow the beige bars and, furthermore, will share prices follow production (as they have in the past) and thus the red line will follow the beige bar.

    It takes money to make money. The relationship seems to be that $1.5 billion of CapEx per quarter yields a share price of $800. With spending reaching $3 billion per quarter will the share price reflect a similar ratio?

  7. Estimates for Apple's fourth fiscal 2012 quarter [Updated]

    Research · 74 comments

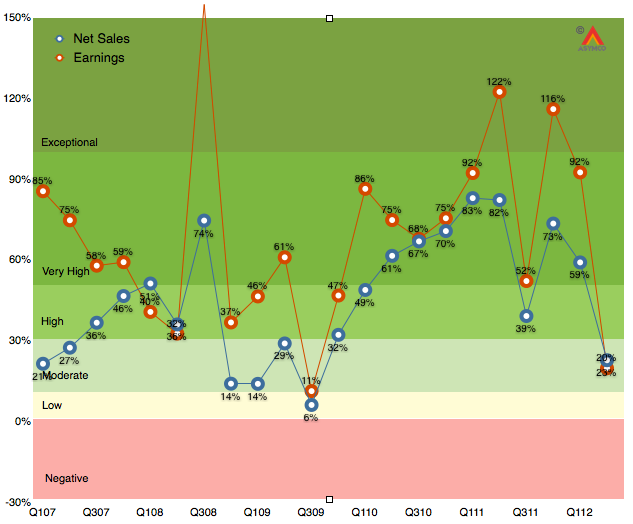
    As the chart below shows, the last quarter (second calendar 2012, third fiscal 2012) was disappointingly moderate with 20% earnings growth and 23% net sales growth.

    It was the first quarter since the iPhone launched that earnings growth has fallen into moderate (below 30%) territory. Much of that disappointment (to me) was the relatively low performance of the iPad following a launch quarter. The iPhone was weak as well, though that was expected.  As I said last quarter, the iPhone is still the most important component but the iPad is becoming increasingly decisive in overall performance. In fact, I’m projecting that the iPad will have the same revenues as the iPhone had one year earlier.

    The iPhone is going to be extremely difficult to project. On one hand we have the launch of the i5 which will account for about 10 million units in the quarter, on the other, chances are that sales were very weak prior to the launch as purchases were being deferred even more than during the last quarter.

    So with these very meager clues, here are my estimates for the quarter (with y/y growth in parentheses):

    • iPhone units: 27.8 million (62%)
    • Macs: 5.6 million (15%)
    • iPads: 18.8 million (69%)
    • iPods: 5.6 million (-15%)
    • Music (incl. app) rev. growth: 40%
    • Peripherals rev. growth: 10%
    • Software rev. growth: 15%
    • Total revenues: $39.5 billion (40%)
    • GM: 42%
    • EPS: $9.75 (38%)

    This earnings value would imply a trailing twelve months’ EPS of about $45.2. At the current price of $697/share the P/E would be 15.4. Cash and equivalents will probably increase to $125 billion or $131/share. Excluding cash, the P/E would be 12.5.

    [Update. The EPS figure above includes a tax rate estimate of 30%. Company guidance was 25.5%. Using the company's guidance yields an EPS of 10.43. TTM EPS becomes $45.9/share and at $697 the PE is 15.2. At time of this update the share price has fallen to $665 and thus the pro-forma trailing P/E ratio is 14.5).]

  8. Kindle Fire vs iPad: “Good enough” will not disrupt - Tools of Change for Publishing

    Research · 8 comments

    Jenn Webb of O'Reilly writes:

    With its recent release of the new Kindle Fire HD tablets, some have argued that Amazon has declared war on Apple and its iPad. But how serious is the threat? Are the two companies even playing the same game? I reached out to analyst Horace Dediu, founder and author of Asymco, to get his take. Dediu will speak on all this and more at TOC Frankfurt on October 9, 2012. Our short interview follows.

    read the interview here: Kindle Fire vs iPad: “Good enough” will not disrupt - Tools of Change for Publishing. (O'Reilly Tools of Change for Publishing).

  9. MacTalk Podcast Special | Horace Dediu

    Podcast

    A recorded interview Peter Wells at Swipe Conference. We discuss the rise and fall of the PC, and some of the parallels that can be drawn from the rise of mobile platforms today. Which mobile platforms are destined to succeed, and who will fade away? And why can't some analysts count the iPad as a PC replacement? Horace also discusses the amazing iPad app he used today in his presentation.

    via MacTalk - MacTalk Podcast Special | Horace Dediu.

  10. 5

    Research · 60 comments

    It looks like the next iPhone will be called the iPhone 5. What's in a name? As it turns out, quite a lot.

    Every hardware product that Apple has released has had a brand and a sub-brand. Macs for example use the Mac brand and a sub-brand as follows:

    • iMac
    • Mac Pro
    • Mac mini
    • MacBook

    Thus each sub-brand imparts certain meaning to the buyer. i, Pro, mini, book are all evocative. MacBook even has its own sub-brands:

    • MacBook Pro
    • MacBook Air

    These Mac sub-sub-brands of Pro and Air are specifically designed to also distinguish and convey meaning.

    iPods as well use the iPod brand followed by a sub-brand.

    • iPod Classic
    • iPod touch
    • iPod mini
    • iPod shuffle
    • iPod nano

    Note how the mini  sub-brand was retired from the iPod line to be used exclusively in the Mac product line. That may not be specifically necessary or desirable but it is an interesting coincidence. (The Pro sub-brand is shared between different Mac lines)

    However, when we look at the iPhone and the iPad, the nomenclature has been distinctly different. Both products have been using generational naming conventions. This implies no sub-branding as the iPhone and iPad are the only identifiers of brand and hence the only meaning being imparted to the buyer. You either get an iPhone or and old iPhone.

    That changed with the iPad however. The third generation iPad became just iPad. This was deliberate (why would they want to confuse buyers?) I think there is some logic to this.

    Note the parallel to the convention of the original iPod. When the iPod launched it was just the iPod. Subsequent versions were identified by a generation, but not a specific sub-brand. After the third generation iPod (still called iPod), the mini version was launched, creating the sub-brand convention that remains in use to this day. The iPod therefore was born generational but switched to sub-branding in adolescence.

    The possibility exists, therefore, that there will be a sub-brand for the iPad. Perhaps "mini" is being reserved for a new iPad, to distinguish it from the regular iPad (no sub-brand) that is likely to remain in production. The logic is to make room for sub-brands when the core brand begins to cover a wider array of form factors, themselves proxies for separate use cases or jobs to be done.

    So what about the iPhone?

    The iPhone has remained, stubbornly, after five years, stuck with a generational naming convention vis-à-vis the sub-brand convention used in every other mature product line from Apple. (Note that software from Apple adheres strictly to a generational naming convention because there is no "room" for a sub-brand under a software brand. There can be no "iWork Pro" or "Final Cut EZ". [Update: there once was Final Cut Express])

    Prior to today I entertained the possibility that the new iPhone will follow the iPad in dropping generational naming in favor of sub-branding thus implying that the brand would develop into a portfolio of sub-brands (like the iPad seems about to.)

    Alas, that possibility now seems moot. The launch announcement seems to clearly point to "5" being the name of the new iPhone. The brand remains iPhone and there will be no sub-branding.

    This can only mean that Apple intends to preserve a single product strategy for the brand. There will be no "special" iPhone for different (e.g. low-end) markets. There will be no different form factor to accommodate different use cases. There will be no new jobs to be done for the iPhone.

    What a bummer.

    However, there may be something more curious happening. Note all the service brands being launched on the iOS platform. There's Siri, (as yet unnamed) Maps, GameCenter and PassBook. These are not Apps. These are services designed to be unique to iOS, perhaps even unique to the iPhone. The difference with the iPhone brand may not be that it spans a multitude of sub-brands in hardware but that it covers a multitude of new service brands. As brands imply meaning, the iPhone brand may imply that it's a platform in and of itself.

    Now that's an interesting development.