Asymco

Asymmetric Intelligence

iPod touch

  1. The Joy of (new) Numbers

    Research

    In the latest, (Fiscal Q3, Calendar Q2 2025) conference call, Tim Cook made a welcome announcement: "We also recently marked a significant milestone. We shipped the 3 billionth iPhone since its launch in 2007."

    This was welcome because the company has not been providing iPhone unit shipment numbers since Q4 2018. What it has meant is that the number of iPhones sold and their average selling price had to be estimated. Active iPhones were occasionally provided but quite rarely.

    With this update, the veil has been party lifted. I, as well as you I'm sure, rushed to assess how well we have been estimating the iPhone economy over the last seven years. Prior to Tim's data dump, my own estimate for total iPhone shipments was 3.104 billion, including the last quarter. [Keep in mind that the 3 billionth iPhone may have shipped in the beginning of the quarter which amounts to more than 50 million units prior to announcement so my error of 104 million is minus perhaps 50 million.]

    In the worst case, my error amounts to about 3.4% over the entire lifespan and perhaps 5% over the estimate period. That is perhaps not criminal since, after all, what's 100 million iPhones between friends?

    I adjusted the estimated average selling price to reflect this error and shaved essentially one quarter's worth of shipments from the data set. In other words, my estimate would have been that 3 billion was reached in March rather than June. Mea culpa.

    The new view into the entire iPhone shipment history is shown below. Also below is the impact of adjustment in the revenue per unit (i.e. average selling price.)
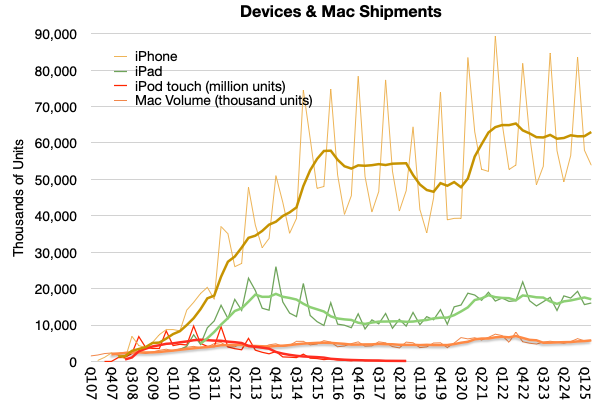
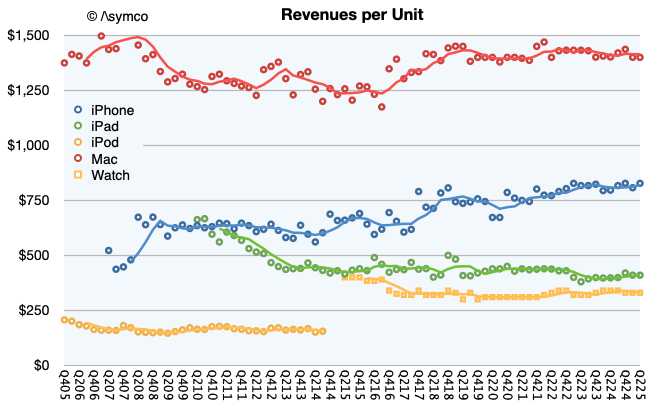
    Note that I used trend lines to show the four-period (12 months) running average to remove the seasonality. Perhaps there is something to be read in the pattern. I would say that there are some notable surges as during the initial uptake, during the first "supercycle" in 2014, the surge during Covid and perhaps the "China recession" of 2018.

    Clearly we are not at the highest sales levels today, as the Covid surge will take some time to grow into but at the same time the volumes are not decreasing. You can see the contrast to the iPod touch when an alternative was available, namely the iPad. The demise of the iPhone has been greatly exaggerated.

    Note also that I also included the iPad, Mac and the iPod touch for comparison. You can try your hand at reading the patterns there. For the record, my cumulative Mac estimate (since Q4 2005) is 398 million[1] and the cumulative iPad is 855 million. Here are the iPhone, iPad and Mac cumulatively with a current total of about 4.3 billion:
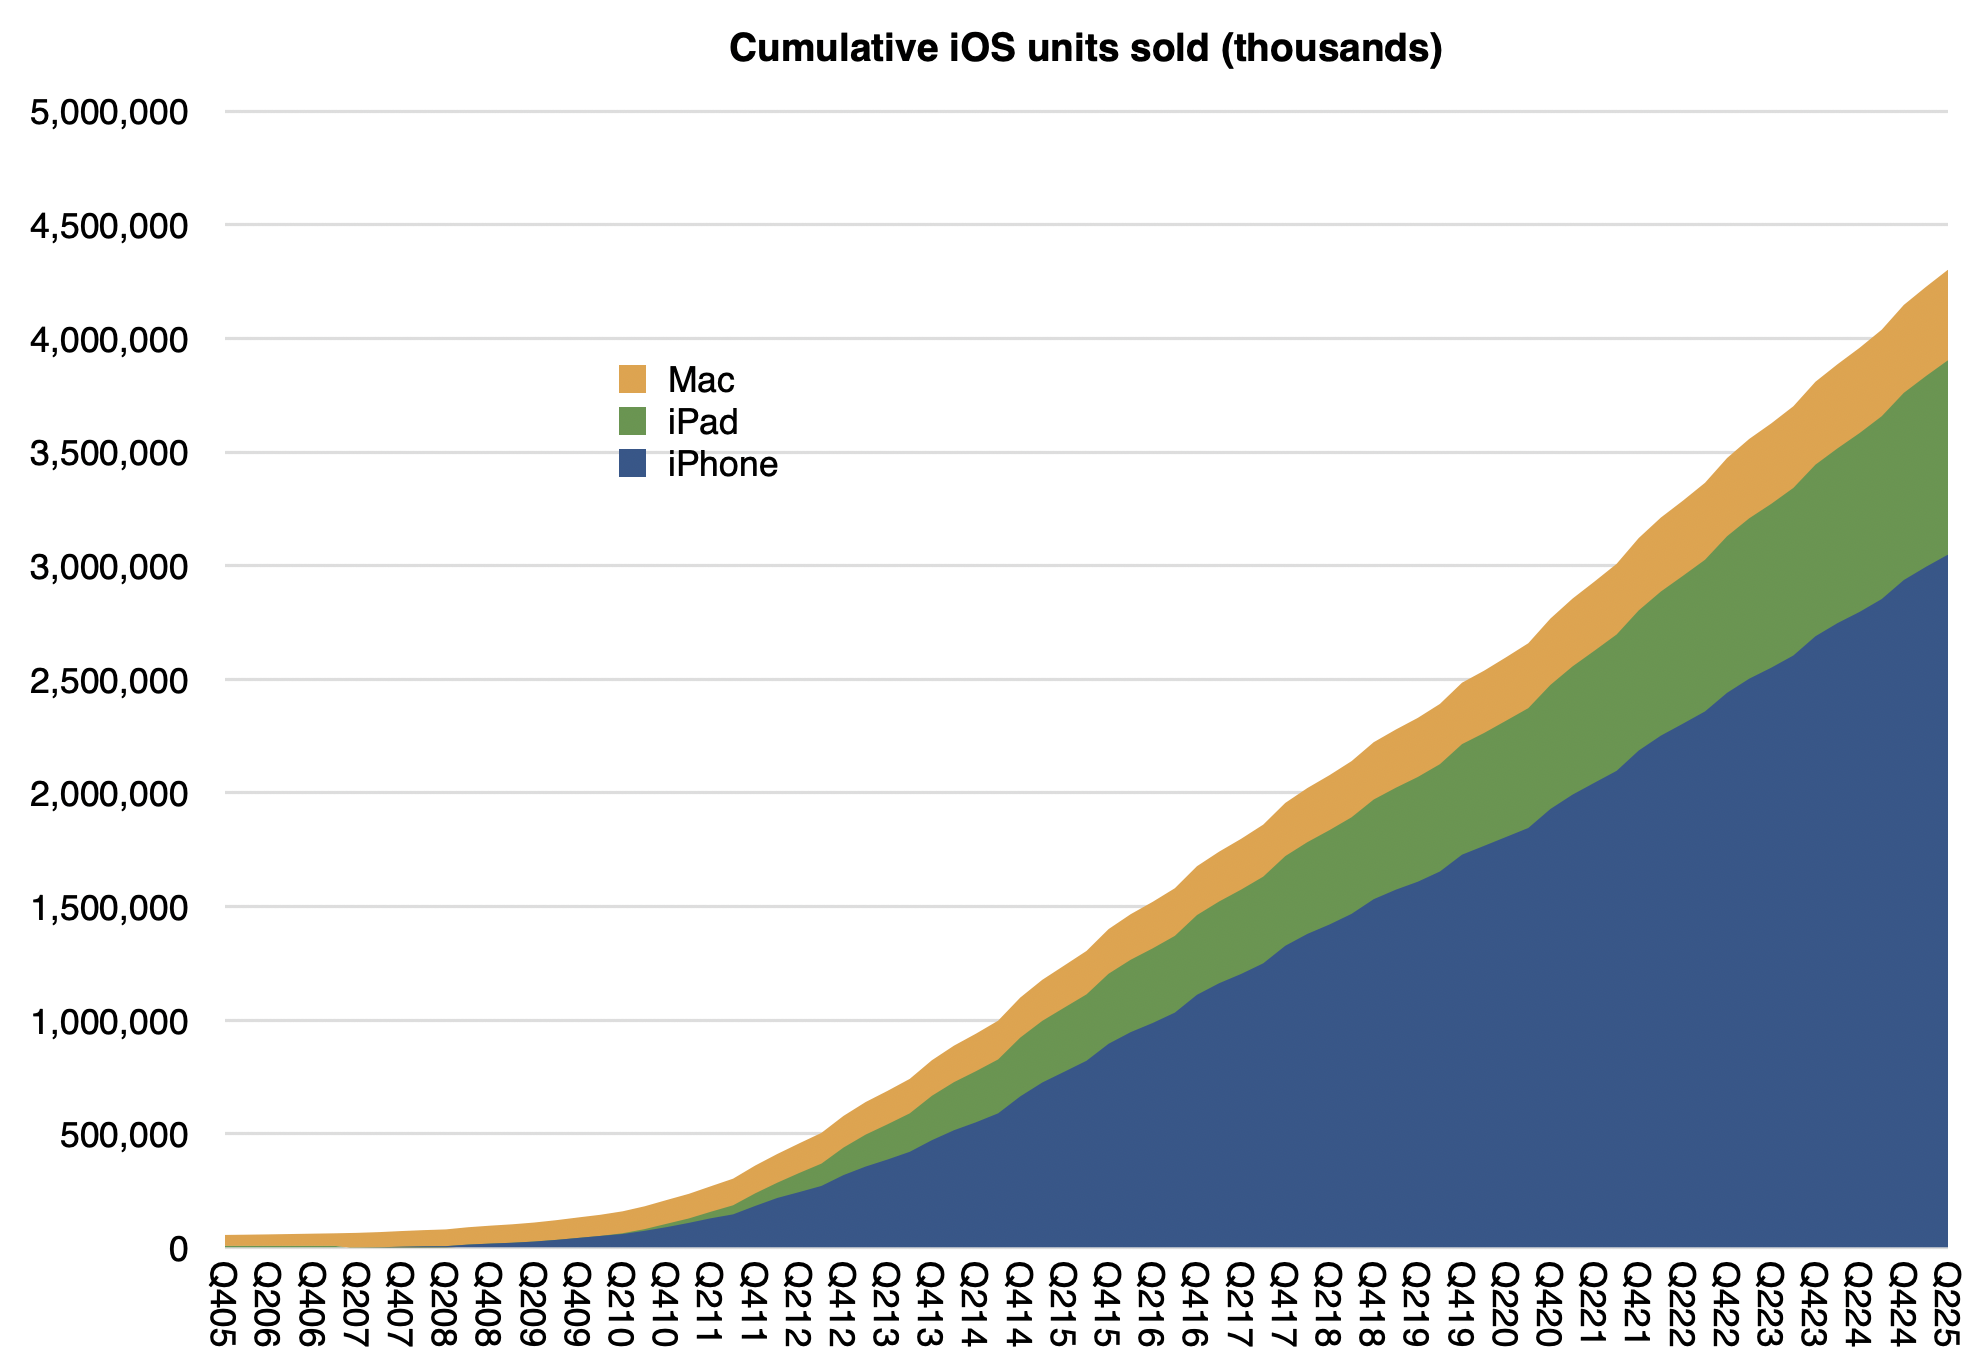
    Not shown are iPods (touch alone is about 114 million), Watches (probably at least 250 million) and Vision Pro (single digit millions) or wearables and home. If we did include those, it's a safe bet that Apple has shipped over 5 billion devices.

    Interesting, but not as interesting as how many are active (in use at least once a month.) For that estimate we have another set of data:
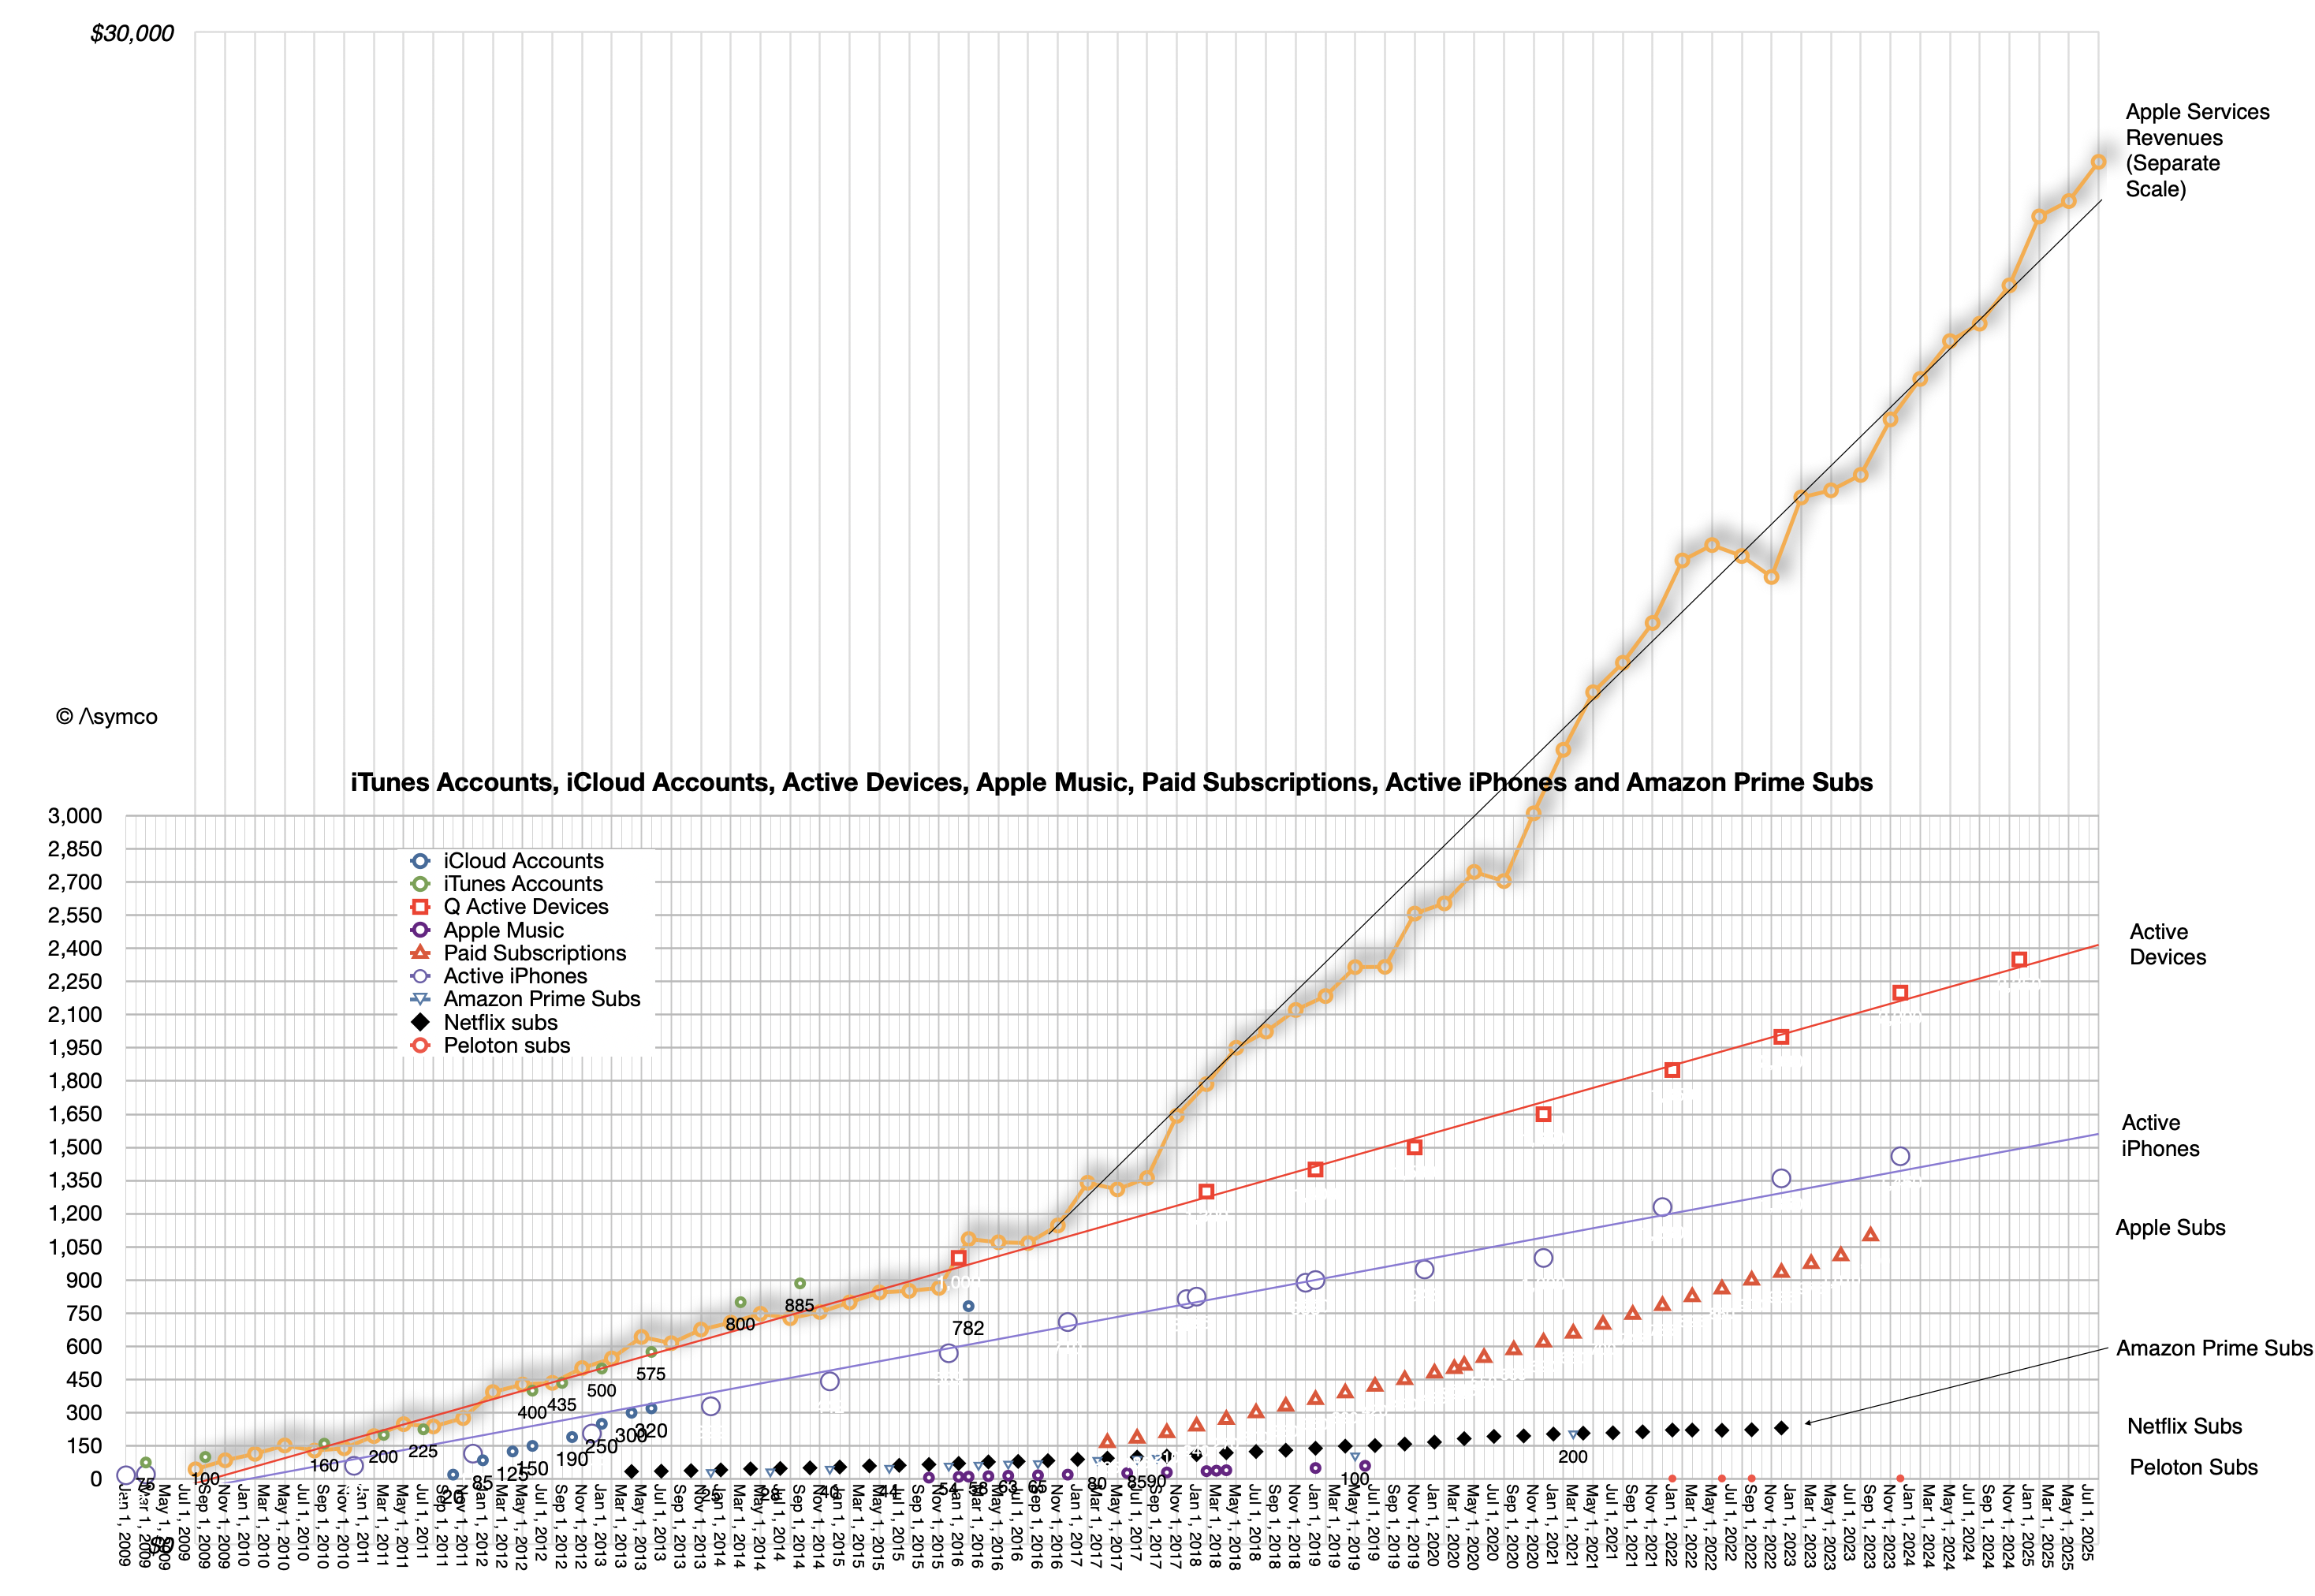
    The linear extrapolations for active devices, active iPhone and, on a separate scale, actual Apple Services revenues can be seen. Also subscriptions, as long as they were available, plus other data sets for comparison such as Amazon Prime subscriptions, Netfilx and old Apple Music and iCloud account data.

    At the risk of overloading an already busy graph, it might be interesting to show cumulative devices vs. active devices:
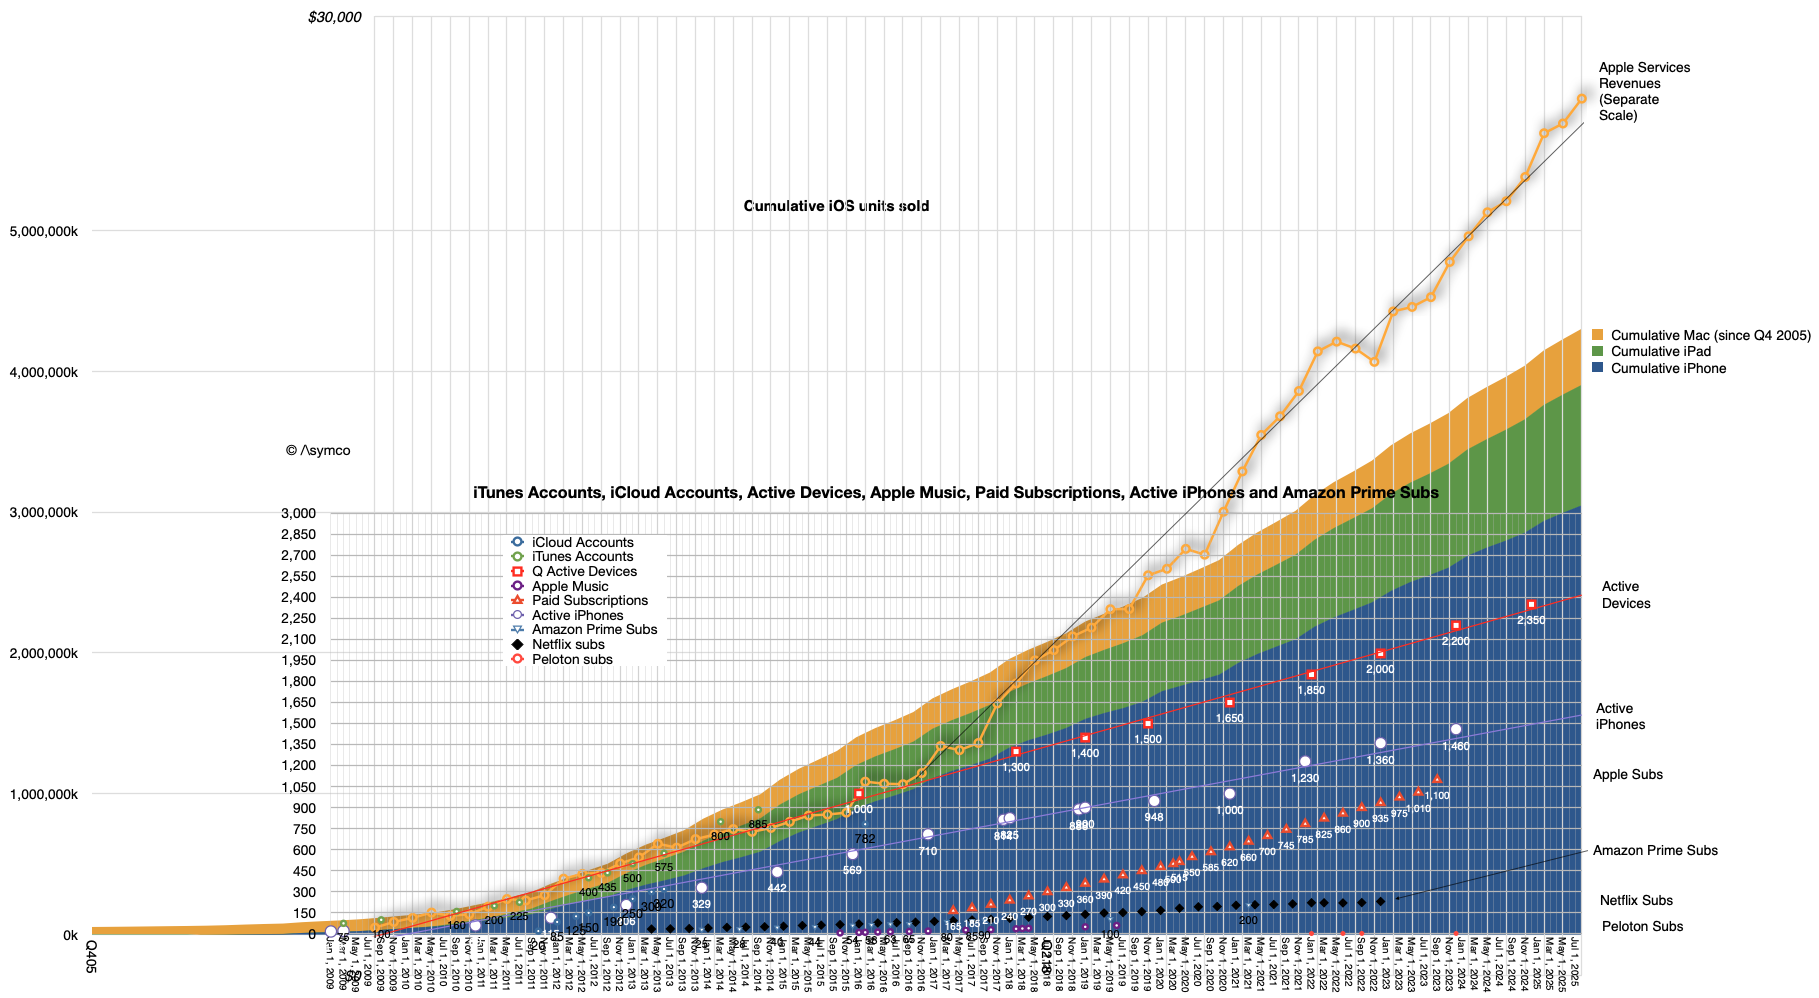
    The Composition of Active Devices

    The top of the area graph seems to be not too different than the top of the red dotted device line. What might be instructive is to calculate the ratio between these two: the active devices and the cumulative devices during the period from 2016 (when 1 billion active were reported) and the beginning of this year when the last figure was reported (2.35 billion active devices on Jan. 30 2025).

    Again, excluding wearables, iPod touch, Apple TV and Apple Vision Pro we have these ratios:

    DateRatio of Active devices to Cumulative iPhone, iPad and Mac sold
    Q4170.66
    Q4180.63
    Q4190.60
    Q4200.60
    Q4210.59
    Q4220.58
    Q4230.58
    Q4240.57

    What this suggests therefore is yet another way to forecast the value of Apple as an enterprise. We already know that the prediction of active devices, revenue per device and margin is sufficient to forecast the company's earnings. These all seem to be quite linear and thus predictable. Now we can add the relationship to devices sold as yet another way to calibrate or test assumptions.

    After diligently doing so, simply multiplying the results by a random number called the P/E ratio (aka "sentiment") allows you to predict the share price at any point in the future.

    Have fun.

    1. It would be interesting to consider that if, as it's been often claimed by Apple, half of Mac users and half of iPad users are new to the products, then there would be 200 million new Mac users and perhaps 400 million iPad users.
  2. Categorizing technologies

    Research · 79 comments

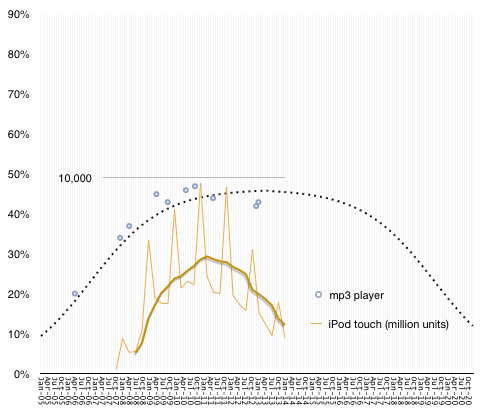
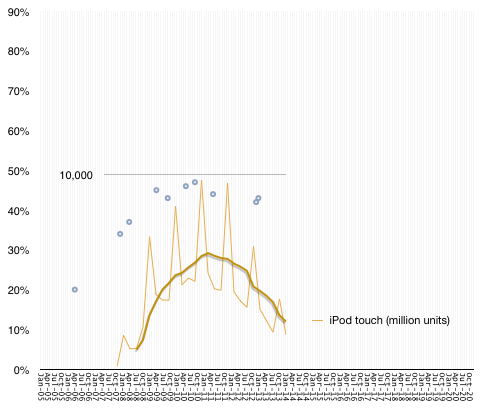
    In the graph below the grey circles represent the US penetration (percentage of households which own) MP3 players.

    Screen Shot 2014-05-19 at 5-19-7.55.22 PM

    Superimposed on this sparse sample graph is a line showing the sales of iPod touch. This second graph has a different scale, shown with a gridline at 10,000, representing millions of units shipped by Apple. To smooth out seasonality I show the trailing four quarter average with a thick line.

    The correlation is fairly evident. As iPod sales grew, penetration grew and "peak MP3" was recorded in September 2010 while peak sales occurred at the end of that year.

    It's not a stretch to say that iPod touch sales are causal to MP3 penetration, especially since the iPod has remained the market share leader in the segment for a long time (at least 70% share) and that the iPod touch is consistently half or more of the iPod.

    The absence of data for penetration beyond 2012 is therefore not a problem. We can assume that MP3 devices have a finite lifespan and, if not replaced, the penetration will decline.

    I modeled both the increase and decline with a diffusion curve as follows:

    Screen Shot 2014-05-19 at 5-19-7.02.40 PM


    As longevity goes, this is quite generous but it's safe to say that fewer than 10% of US households will have a dedicated MP3 player by the end of the decade.

    MP3 players turn out to be a "ballistic technology". Their failure is two fold: first, they did not reach saturation, gaining popularity with only half of US households; second, they were substituted and thus went out of use. Note that I kept the graph's upper bound at 90%, suggesting the limitation of the device popularity.

    There are many technologies which are in this state: camcorders, pagers, VCRs, game consoles.

    On the other hand there are some technologies which prove to be both ubiquitous and resilient. I call these "perpetual technologies". Substitution may occur but it may take decades. Examples are stoves, autos, microwave ovens, refrigerators, radios, vacuum cleaners, TV, telephones (fixed wire and cellular).

    Yet another category exists where the technology does not quite reach ubiquity but is common enough that it's refused by only about 20% of the population. I call these "Inertial technologies". They also have relatively long periods of slower growth and similar lengths of decline, sometimes substituted by services rather than equivalent objects. The Examples are washing machines, the Internet, personal computers.

    Some technologies never reach mainstream use (below 10% penetration). I call these "dud technologies". These failures are very common and can be discerned easily. Examples include the Segway, Google Glass, SPOT watches, PDAs.

    So to summarize:

    • Dud technologies: Never reach 10% penetration, are money losers, do not create an industry.
    • Ballistic technologies: Reach between 30% and 70% penetration but are substituted quickly. They are profitable but only for the duration of their ascent. Generally do not create industries, ecosystems or network effects.
    • Inertial technologies: Have steady growth but never reach ubiquity. They are bound by frictions which impede their broad adoption but also impede their substitution. They do create industries and network effects but suffer from corrosion and monopoly.
    • Perpetual technologies: They reach ubiquity, usually quickly and remain there indefinitely. Substituted only by improvements which supersede performance (e.g. Color TV vs. B&W TV). Usually solve a universal problem everybody has. Create disruptive growth and have world-changing effects.

    Knowing in advance which category a technology will reach can be very valuable. Not only can investment be directed, but career decisions, education choices and fundamental research can be better allocated.

    The question is therefore how to tell early enough where an emergent technology fits in this categorization.

    I'll be discussing a methodology for doing this, the processes for creation and covering at least twenty case studies at the Postmodern Computing Summit in June in San Francisco.


  3. Apple's Growth Scorecard for third quarter 2012

    Research · 70 comments

    In the parlance of developers Apple keeps "throwing exceptions." This quarter the iPad surprised with a significant decline in sales growth. I placed a table showing the sales growth for this quarter as well as the previous 22 quarters at the bottom of this post.

    Here is a quick review of each line:

    1. The iPhone returned to a more customary growth rate (which I rate as Very Good--above 50%). The quarter was bound to be quirky due to it being both a transition quarter and a launch quarter. The launch of the iPhone 5 came quite late but not too late to make a contribution. It was also widely rumored and anticipated so there was slowing of the previous generation product. I expect growth to accelerate further in the last quarter of the year.
    2. The Mac turned in a commendable 6% revenue growth (1% unit growth) on the back of the new 15" Retina screen MacBook. The average sales price increased sequentially and the mix of portables to desktops reached a new high of above 80%. More about the Mac will be written in a future post.
    3. The iPod continued its decline. The 26% sales decline was in-line with other non-launch quarters. The company tipped its hand and let us know that iPod touch now makes up 60% of iPod volumes. At 3.2 million iPod touch units, it's a significant iOS contributor but still a declining number.
    4. The iPad was painfully underperforming. With only 9% revenue growth, it was a complete reversal of the torrid growth of the last two years. Management blamed both anticipation of a new product and a reduction of inventory ahead of refresh of the larger screen retina. The only silver lining was that the average price decline was moderate (down about $3/unit). Overall, I'm very disappointed with the pause in the product but the new mini could change the character of the product dramatically in a way similar to how the iPod mini turbo-charged the iPod line.
    5. iTunes had a very good quarter. It's the perennial growth engine with the most consistent performance throughout the time period shown. It was the second fastest growing line item firmly in the "High" growth bracket.
    6. Peripherals, including Apple TV had a moderate quarter. Management revealed that about 5 million Apple TV units shipped in the fiscal year. That adds up to a half-billion dollar revenue business. Peripherals had $2.8 billion over the same time frame so Apple TV was about 18% on a yearly basis. This does not include content revenues.
    7. Software had a modest growth of 22% but has come to be the high end of the range. Since changing the way it prices OS X updates, the era of Apple software windfalls is over. Still, at nearly $1 billion per quarter it's nice pocket change, especially as it's nearly all margin.
    8. The overall top line (net sales) was a bit improved sequentially (+4 points of percent) but still in the "transition quarter" range of moderate growth. The company may be shifting its launch cycles and as a result we're seeing a break in pattern. As pricing for iPhone and iPad did not change very much the slowing of top line growth is entirely due to a unit shipment reduction. Again, the primary cause is transitions in multiple lines simultaneously.
    9. The bottom line (earnings) followed the same pattern as top line (slight sequential increase in growth). There was a slight attenuation of margins (gross margins are down to 40%).

    Overall, the quarter was not up to the recent level of performance for Apple. Growth was overall "moderate".

  4. International Tablet of Mystery

    Research · 31 comments

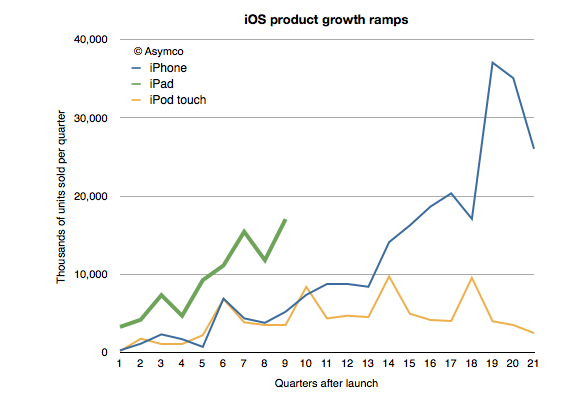
    One of the remarkable patterns associated with the iPad has been its growth rate. Looking at the ramp of the product relative to the iPhone and iPod touch reflects this sense of raised expectations:


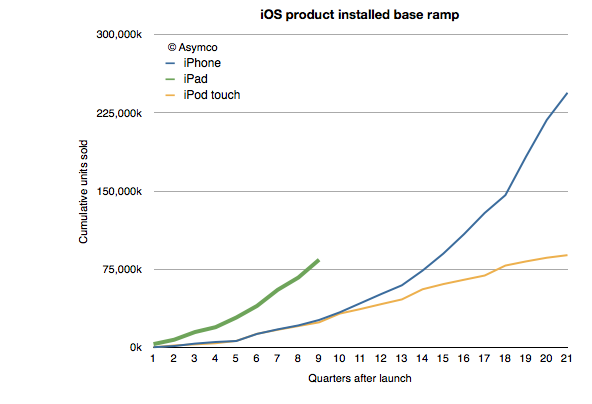
    At the same point in time, and adjusting for seasonality the iPad is outselling the iPhone by a factor of 3 and the iPod touch by a factor of about 5. This is also reflected in the installed base of devices, where the 84 million iPads sold through its first nine quarters is more than three times the iPhone base at a similar point in time.

    Of course, the world of 2012 is different than the one from 2009 when 25 million iPhone sold. iPhones are available in far more points of sale and to many more buyers world-wide. But the interesting contrast is between the iPad and the iPod touch.

    I've always maintained that the dynamic difference between the iPad and the iPhone is that it's unrestrained (and unsupported) by the operator channel and all that it implies. The iPad is a pure computing product whose means of communication is unregulated. That means transparency in pricing and transparency in distribution.

    But so is the iPod touch.

    The iPod touch is a "nano iPad" (or as detractors put it, the converse of that.) So shouldn't the iPod touch behave as the iPad?

    We don't know exactly how the iPod touch behaves. We don't have specific figures on its sales. What you see in the charts above are my estimates for the iPod touch based on company statements that "about/above 50%" of iPods are touch versions. That and the cumulative sales totals that are occasionally reported.

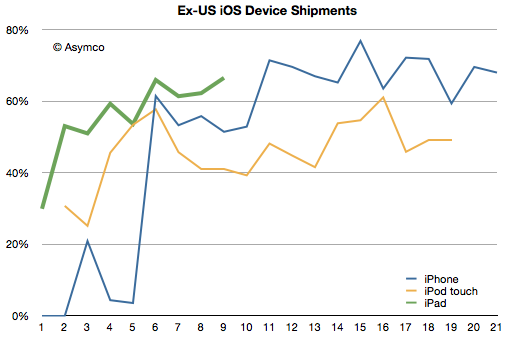
    However, we have received an unexpected morsel of data from the Samsung v. Apple trial that may help characterize the two products: US sales data. Having the US data and knowing/estimating the global data gives us an estimate of the international (ex-US) sales for all three products.

    I indexed the three products to measuring quarters since launch. The pattern here is that the iPad diverges from the iPod touch in its international appeal. Since the iPad expanded internationally even faster than the iPhone, the issue is not only one of rapidity in appeal but also a qualitative difference.  The iPod touch seems to have stabilized at 50% non-US sales while the iPhone is between 60% and 80% outside the US.

    The iPad reached 60% non-US sales in its first year. Its last quarter was 70% outside the US.

    So what's going on?

    The characteristic value of the iPad is in its appeal to "computing non-consumers". Computing has come to mean media consumption, education, communication and entertainment. These jobs to be done are casually done with much more ease on an iPad. The iPod touch can do these jobs as well, but not as comfortably. The iPod touch is "absorbable" by younger consumers and typically they have their hiring done by their parents. Those parents are less likely to indulge where incomes are lower.

    But the universal appeal of the iPad is evident in its global visibility. Like the tasks it performs, the iPad itself is becoming less of a mystery.

  5. The parable of Nintendo

    Research · 109 comments

    With the launch of the Wii console, Nintendo averted disaster. When the Wii launched in late 2006 Nintendo had been facing the simultaneous attack from the "seventh generation" Xbox 360 which launched a year earlier as well as the PlayStation 3, both of which set as their bases of competition 3D graphics at HD resolutions. Many wrote off the company and called the console market a two horse race.

    Then, in what seemed a desperate downward leap, the Wii was launched into a different trajectory. It addressed non-consumers with a new, more intuitive controller and standard resolution rather than competing for hardcore gamers with more power and richer graphics.

    Because the Wii was asymmetric and addressed non-consumption rather than trying to be a "better" console in what was becoming a horsepower race, Nintendo expanded the console market. Its innovation was interesting enough that many hard core gamers used the console in addition to a PS3 or Xbox and many non-gamers bought it as their first console.

    The result is that 95 million Wii's have been sold vs. 66 million Xbox 360's and 62 million PS3's.

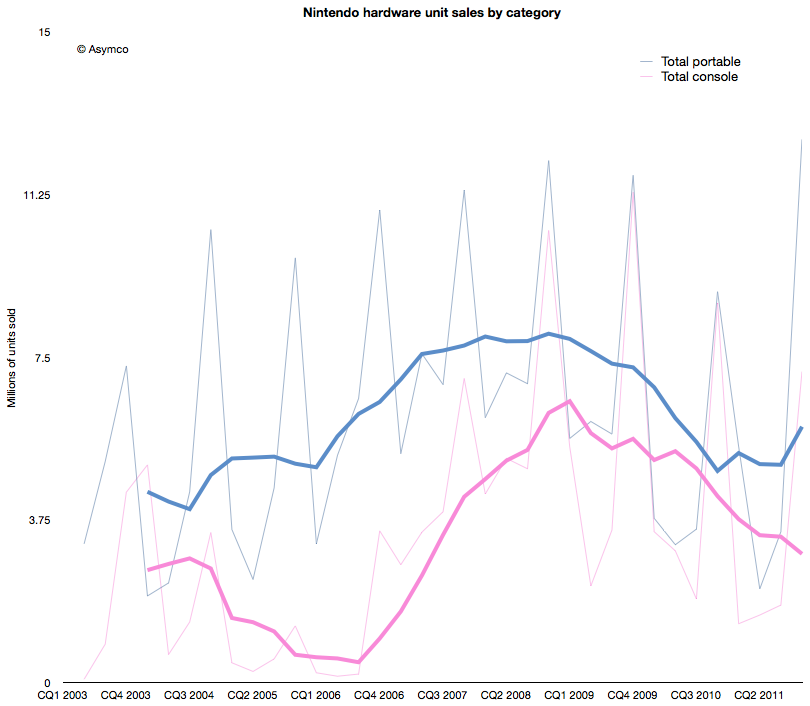
    The effect of the Wii introduction on Nintendo's console unit sales is shown below (pink line).

    The graph above shows that the growth from Wii has stopped. In fact, the console has been in decline since early 2009. Fortunately for Nintendo, the company also developed a mobile strategy. Learning from its Game Boy device, its DS series of portable game consoles allowed the company to diversify its portfolio. The graph also shows the total portable units sold in blue.

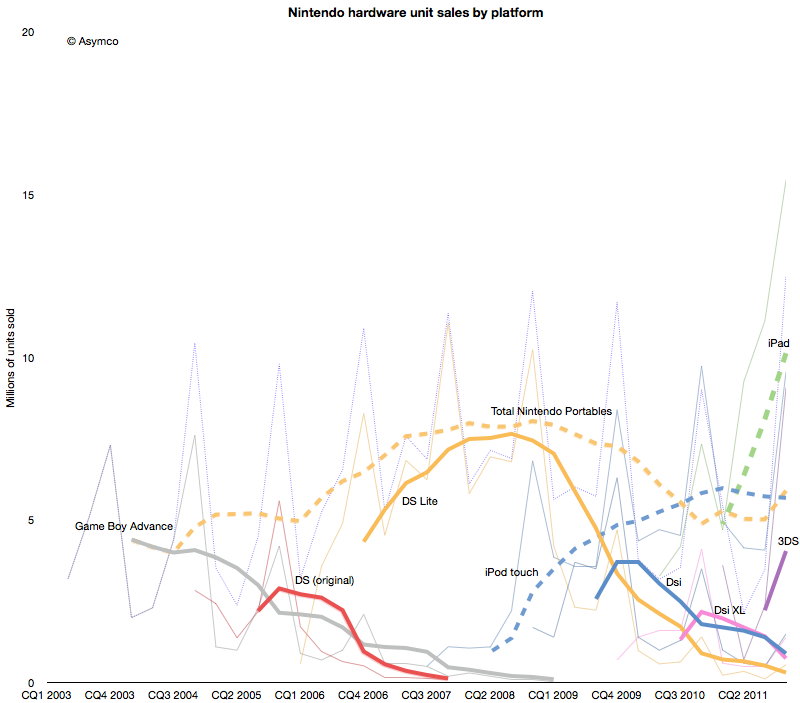
    However, this strategy has not been enough to protect the company from the disruptive effect of mobile computing. As the following chart shows, each new generation of portable from Nintendo has failed to break out of a general pattern of overall decline.


    Contrast the DS product patterns with the iPod touch and iPad--multi-purpose products whose game functionality is "good enough" but whose communications and general-purpose app catalogs are re-defining the basis of competition yet again.

    Nintendo bet on the 3DS to reboot the franchise. The 3DS product does show the characteristic initial spike in adoption but the level it launched at is far lower  than the level of the iPad. Nintendo has a big hill to climb to even recover the volumes it held in 2009. In contrast, the usurper Apple's volumes are doubling each year.

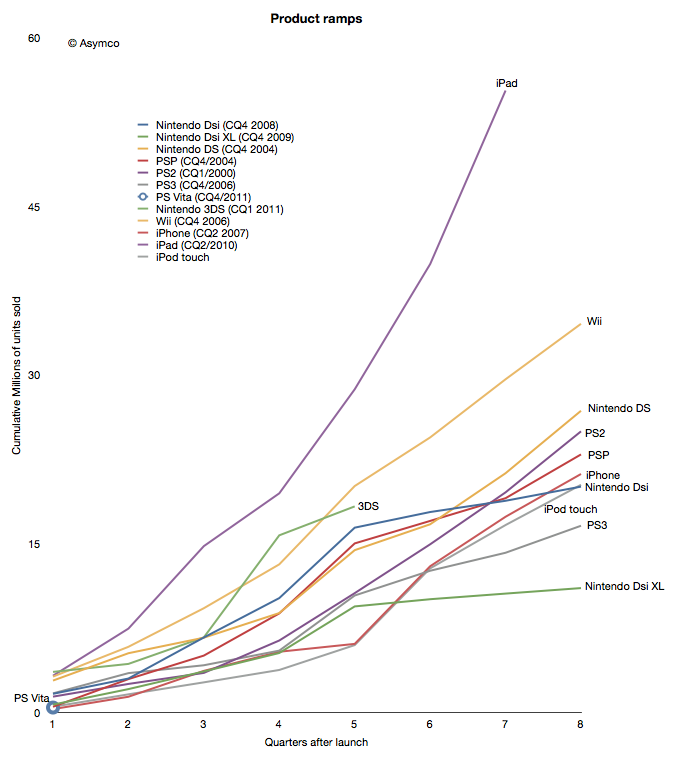
    When products are compared as "ramps" in terms of growth post-launch the story becomes even clearer.

    Although the iPhone and iPod touch ramped in similar ways[1] to the gaming platforms, iPad took an entirely different path. The 3DS benefited temporarily from a price cut but it seems to be returning to a well-worn trajectory.

    The data points a bleak picture for Nintendo. The Wii was a success due to its competitiveness vs. non-consumption of gaming. But another low end disruption took hold in 2007. Good enough games on phones and mobile computers are taking consumption away from dedicated consoles, both fixed and mobile.

    In addition, the rate at which game experiences are improving on iOS imply that they will overtake the "quality" of consoles in the not too distant future. Differences in distribution models also guarantee lower pricing for software for end users and enabling a far larger catalog of titles.[2]

    This may sound like another story of fortune gained and fortune lost. The inevitable "what goes up must come down" aphorism. We become used to this pattern and assume it to be axiomatic. But there are causes for each success and causes for each failure.

    The lesson here is that a company that disrupts does not necessarily survive. Long term survival depends on the ability for serial disruption. Serial disruption is an uncomfortable state for an organization to exist in. As the story above shows, disruptions are usually enabled by "desperate" necessity. Desperation is not something management is trained to aspire for.

    What management strives for is steady state satisfaction and predictability from intelligent planning.

    ---

    Notes:

    1. Though the iPhone ramp matched the consoles, the growth for the iPhone is persisting at 100% y/y five years into the product. This means it is outstripping all console installed bases by at least a factor of 2.
    2. The catalog is not only broad but deep in the sense that there are many new game concepts and experiments being tried. The app store is a vast testbed for game and entertainment ideas.
  6. Hiding in plain sight

    Research · 67 comments

    Guessing the next Apple product has become the parlor game of choice for a whole generation of technology journalists and analysts. The premise of the game is that given a track record of breakthrough products, there is always another one just around the corner. Being the one to predict this next breakthrough product creates credibility and demonstrates the domain knowledge of the predictor. If the prediction fails to materialize there is consolation in dismissing the actual announced product as disappointing, unsophisticated or, worst of all, uninteresting.

    Most often, these guesses are as much a reflection of the analyst as they are an analysis of the company. Too many predictions are designed to impress or demonstrate the imagination or knowledge of the predictor. They typically anticipate a giant leap of functionality, power or market re-structuring. They envision revolution not evolution; a cutting of the Gordian knot not a polishing of ugly rocks.

    Yet nearly all of Apple's launches have been sustaining improvements in existing products, technologies or platforms. To name just a few:

    • The iPad is an evolution of the iPod touch
    • The iPod touch is an evolution of the iPhone
    • The iPhone uses OS X and Objective C from the Mac
    • OS X came from NeXT
    • The app store market model came out of the iTunes store
    • The iTunes store came from iTunes which came first to the Mac as a media sync tool for the iPod
    • etc.

    John Gruber explained the process last spring as it relates to many of Apple's launches. Although the iPhone did introduce a new user input method and experience that takes consumption in a new direction, its building blocks were there for all to see for many years. The iPhone is a natural evolution of the computer with a handy little "Phone" app.

    Likewise, the iPod came seemingly out of nowhere but by watching the original launch you see it as part of a "media hub" strategy that envisions the Mac as a personal server. The very products which ended up disrupting the Mac/PC began as extensions of their victims.

    You can trace the DNA of almost all of Apple's products to previous products. If Apple did not have these foundations, the slow-motion revolutions would not have happened. Rather than a deliberate big bang, Apple's disruptions are the result of a discovery process. A test, iterate and improve loop. This is why they seem obvious after the launch but also why they seem to be such an anti-climax.

    Therefore, the challenge of predicting Apple's next product should be tackled not only through an act of imagination but by carefully projecting the current products and understanding where they can evolve.

    So it is that I approach the question of Apple's TV disruption. My working assumption about the next Apple TV is that it already exists. It's none other than the existing Apple TV, improved.

    Here are the clues or hints I noted:

    • It uses iOS and the hardware from the devices that run it. It originally ran a PC architecture and shared a kernel with Macs.
    • It has been integrated with iTunes media stores (with the notable exception of the iTunes app store)
    • It has begun to introduce channels other than downloads (ESPN, Wall Street Journal) thus establishing its own distribution for traditional content
    • It is a global product, depending only on the Internet protocols and independent of the balkanized cable standards
    • Through AirPlay it is integrated with Macs and Apple devices.
    • Through display mirroring, iOS devices can use the TV as an external monitor and can even change their own behavior when doing so

    This last point is intriguing. I have not seen discussion of this feature, but if using an iPad 2 or iPhone 4S with iOS 5 and an Apple TV with the latest software updates it's possible to have an iOS device become a controller for TV-based game experiences. Developers are already using the API. When using a pinball game with screen mirroring, the device becomes a controller while the action takes place on the big screen. Switching display mirroring off bring the action and control back onto the small screen. There are still problems with lag and the processors are over-taxed on high frame rates, but the APIs are already there for developers. (I could also mention the potential of new a Bluetooth standard for better wireless response).

    What these signals point to is Apple defining the TV as an iOS portfolio product. This means integration with iTunes, including an app store. This, in turn, means unleashing developer/creative talent through new monetization opportunities. This means new user experiences in discovery. This means FaceTime-like communication through the TV. This means many other things but mostly it means that the TV will be a platform product.

    The only challenge is a (currently lacking) smooth interface. Perhaps that's where voice comes into the picture. But whether that is built-in at the next rev of the product or not is not the story. The story is going to be the sustaining improvement in the original Apple TV. A wonderfully asymmetric product begging to be ignored. A product that because of its apparent lack of success, effectively hides all its secrets in plain sight.

  7. Review of Apple's unit numbers released in legal filing prior to earnings

    Podcast · 48 comments

    Thanks to Nilay Patel at This is My Next for posting the complaint filed on April 15th against Samsung by Apple which revealed some potentially material data about its performance in the last quarter (which won't be public until the 20th).

    On page 4:

    "As of March 2011, more than 108 million iPhones had been sold worldwide"
    "By March 2011, Apple had sold over 60 million (iPod touch) units."

    On page 5:

    "By March 2011, Apple sold over 19 million iPads".

    These numbers are material because we know units sold prior to CQ1 and can derive the minimum units sold for these three product lines during Q1.

    Namely:

    • Total iPhones sold before Q1: 89,971,000 implying a minimum of 18.1 million sold during the quarter (my estimate is 18.4)
    • Total iPod touch sold before Q1 (estimated): 55.5 million implying a minimum of 4.5 million iPod touch sold during the quarter (my estimate 5 million)
    • Total iPads sold before Q1: 14,789,000 implying a minimum of 4.2 million iPads sold during the quarter (my estimate is 7.3 million).

    The only outlier in terms of delta to my estimates is the iPad units which has always been the wildcard.

    Apple published lower bound figures but it's a matter of speculation as to how far below actuals they are. Nevertheless, I would treat the iPad numbers with extreme caution.

  8. iOS distribution: do operators hold the keys?

    Research · 31 comments

    As iPad shipment volumes increase and as the iPod touch becomes the de-facto iPod, it's time to look at the overall split between iOS devices.

    I will focus the discussion between iPhone and iOS "others" because I believe the two categories differ greatly in terms of their positioning and market strategy due to the different channels.

    The company does not provide iPod touch units shipment data but it can be estimated that, based on overall iOS numbers released in September, iPod touch represents approximately 50% of iPod units sold.

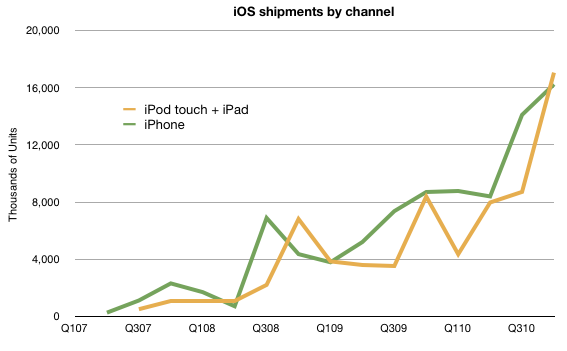
    If we put all we know together about volumes, we have the following chart:

    Note that iPod touch has, occasionally outsold the iPhone. The pattern of approximately equal volumes for the two types of products is likely to continue depending greatly on the growth rates.

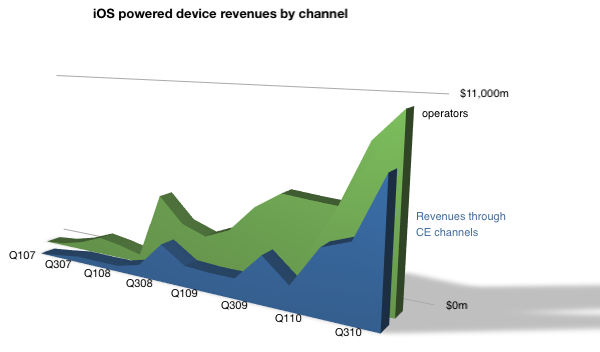
    Next, I turn the spotlight on revenues.


    Over $10 billion flowed in from Operators, and a bit under $8 billion from other channels.

    Note that I labeled the iPod touch and iPad as non-operator channel (Consumer electronics) distribution. Although this is not entirely true (and conversely iPhones are often sold through Apple stores) this gives a rough indication of split.

    The iPhone business is staying ahead of the other iOS businesses but the gap is narrowing.

    As previously noted, the iPhone is a unique product in Apple's portfolio. It depends on a distribution channel that no other product was designed around. This has advantages and disadvantages. The advantage is a high margin due to service revenue sharing but the disadvantage of network incompatibilities, politics and a range of telecom-related regulations.

    What I believe is that the non-operator channel will grow as a proportion of iOS revenues. This is both as iPad grows to disrupt personal computing and as the iPad emerges as a communications tool.

    As time passes, I believe Apple is motivated to also move revenues to its traditional channels. Whether, or to what extent, cellular phones will move in that direction remains to be estimated.

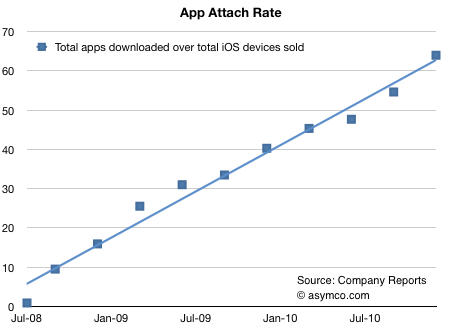
  9. More than 60 apps have been downloaded for every iOS device sold

    Research · 33 comments

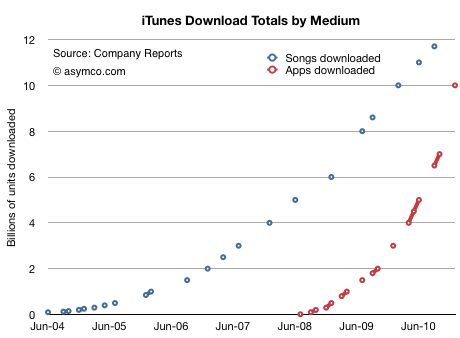
    The iTunes App Store is about to reach 10 billion downloads. That makes this a good time to revisit app growth metrics and compare them with the other digital media store that we have data for: the iTunes Music Store.

    First, the download totals as time series[1]:

    Assuming that 10 billion will be reached this month, we see how the steepness of the app curve implies that apps will overtake songs within a few months. I suspect by March.

    In September I made the prediction that total apps would overtake total songs sold by the end of 2010. That has not yet happened, but it's close.

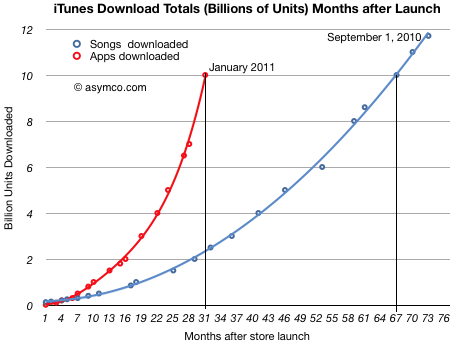
    If we measure downloads as a function of the number of months since store launch, we can see that Apps reached 10 billion downloads in less than half the time it took songs (31 vs 67 months.)

    I used polynomial curve fitting to draw the lines.

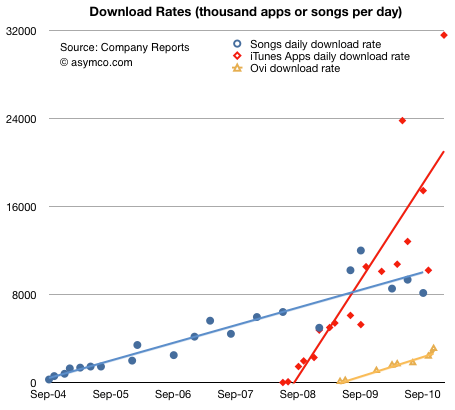
    The other way to look at the data is by measuring the daily download rate. The data is more scattered, but the trend is still clear:

    (The solid lines are linear trendlines. I added the known data from Nokia's Ovi for comparison.)

    The amazing story of this chart is not that apps are running at above 30 million download per day, but that the figure is growing. Growth like this is hard to get one's mind around. Not only are downloads increasing, but the rate of increase is increasing.

    There is one final piece to put in place on this puzzle. Some might argue that the reason these download rates are increasing is because the installed base of devices is increasing at the same rate. In other words, app consumption could be steady on a per user basis.

    To answer this we need to divide the cumulative apps downloaded by the cumulative devices sold. Using a reliable estimate for iPod touch units sold, we can get a pretty clear picture:

    The number of apps downloaded for iPhone/iPad/iPod touch is running at more than 60[2].

    In the fall of 2008, there were about 10 apps downloaded for every iPhone/iPod touch. Two years later the rate was more than five times higher. There are significant implications for the network effects related to the iOS platform. End user investment in apps is even higher than end user investment in music which created a very tight lock for iPod users.

    I draw three conclusions:

    1. Apps overtaking digital music is a watershed event. Apps are a new medium: they will impact all other media.
    2. As the number of apps attached to any single device continues to increase, apps create increasingly higher switching costs for users.
    3. Apps consumption is increasing at a rate to overtake the PC software market.

    ---

    Notes:

    1. The total apps does not include updates.
    2. The attach rate is actually higher since the figures above assume all devices are still in use.
  10. Is Android more efficient than iOS at generating search revenue?

    Research · 63 comments

    Thanks to David Chu for forwarding the data that made this possible and reader Narajanan for spotting the divergence in platform efficiency.

    iOS and Android are both growing rapidly. According to Gartner, during the first three quarters of 2010, about 44 million iOS devices and 36 million Android devices were put into use. That's 80 million devices. An amazing achievement for two platforms that did not exist 3 years earlier.

    But obviously not all devices are used the same way. Devices which have unused capabilities limit network effects for a platform and for the category of product in general. Question is: how can we measure the "smartness" of a device; how much more likely is a device to be used as a mobile computer vs. being a regular phone?

    The best proxy I can think of is a measurement of browsing use. The smarter the device, the more browsing is a joy and the more it is actually done. Browsing leads to more data load on the network and creates a virtuous circle of revenues for the mobile computing value chain.

    If we could measure the increase in browsing generated by each additional phone, we could compare whether one platform is better (specifically, more efficient) at generating value asymmetric to voice.

    Fortunately we have data from Netmarketshare.com (see sources below) which attempts to track browser consumption and hence allows us to measure this variable. What we need to pair that with is the incremental increase in the installed base of devices.

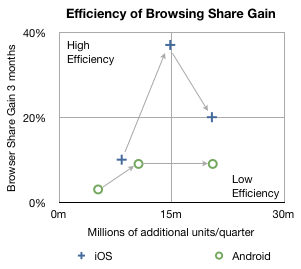
    In the chart below I plotted how much browsing share increased for every phone sold by platform over the first three quarters of 2010.

    The arrows indicate the sequence in time from Q1 to Q3. The vertical axis shows gain in share three months after the corresponding number of units shipped in the previous quarter on the horizontal axis. So, for example, the second circle means that in the second quarter approximately 10 million new Android devices created a gain of about 9% in browsing share. In the same quarter, 14.8 million iOS devices created about 37% gain in browsing share.

    In the third quarter approximately the same number of iOS and Android devices shipped (iOS  including iPads and iPod touch) but the browser gain was 20% for iOS vs. 9% for Android.

    A line drawn diagonally from lower left to upper right (0,0 to 30m,40%) could represent the average gain in share per units sold--the sort of measure we're looking for.

    Measuring that slope tells us that, on average, every million devices sold should generate a gain of 0.75% share[1]. I took the additional step of labeling two quadrants which are orthogonal to the expected trend. If browsing increases dramatically faster than 0.75%/million units then I call those devices sold as creating "highly efficient" browsing gain. If browsing increase lags dramatically below 0.75%/million units then those devices added share with "low efficiency".

    So four data points follow the trendline down the middle of the chart, however, there are two notable outliers. Finding the causes for these outliers gives clues to what's happening with the platforms.

    I believe the explanation for iOS's second quarter's extraordinary efficiency is that was the quarter when the iPad launched. It seems to have yielded a very strong spike and the trajectory of iOS improved even into the next quarter as those iPads continued to be in use. iPad seems to be a very effective way to gain browser share.

    I also believe that the cause for Android's fall in efficiency in the third quarter was that it began to be sold in large quantities in the developing world. The third quarter saw a rapid acceleration of sales without a proportional increase in what was measured as sales in the US (and Europe).

    Interpretation

    If this trend continues, and there is no guarantee that it will, then a question could be raised about Android's value to, of all people, Google.

    The core value of Android to Google is the increased use of browsing and hence search. All the other Google services and in-app ads are tiny opportunities in comparison to the potential of search on mobiles. One could argue that the raison d'être for Android since day one was to create browsing consumption. In that regard it's not as good at doing that as iOS is.

    Perhaps Google can justify the under-performance of consumption of browsing (and hence search) on Android devices as benign since there is no marginal cost added to supplying Android to non-consuming devices.

    But I wonder. There is the problem of opportunity cost: Those iOS devices that create more browsing activity are going to take more share. The more they do that the more Google will have to pay Apple for placement as the default search in mobile Safari.

    It may be a stretch, and perhaps the data is wrong, but that's what this exercise is all about: how much can we learn from fragmentary data? Without a hypothesis there is no discovery.

    -----

    Notes:

    1. Since these platforms have very low shares (less than 2% for iOS and 0.3% for Android by November) almost all the gains can be assumed to be against other browsers (e.g. Internet Explorer) and not against each other.
    2. Update: the original Unit estimates excluded iPad and iPod touch which have since been added.

    Sources:

  11. iPod touch made up 37.7 percent of all iOS devices sold so far

    Research · 13 comments

    On September 1st, Apple announced that 120 million iOS devices were sold to date.

    We know that there were 59.6 million iPhones sold through June (from SEC filings)

    We also know that 3.2 million iPads were sold.

    If we assume about 8 million iPhones and 4 million iPads were sold during August and July, the total number of iPod touch sold is 45.2 million.

    That is 37.7% of total units.

    In April I wrote that 41% of all iOS units sold were iPod touch to date.

    The expansion of iPhone distribution plus the addition of iPad as reduced the platform footprint for the iPod, but it's still a sizable chunk. More than one in three iOS units in use are non-cellular devices. As the iPad rolls that number could move toward 50%.