Asymco

Asymmetric Intelligence

iPod

  1. The iPhone at four; growing up or just growing?

    Research · 74 comments

    Ever since the iPhone launched four years ago (to the day), the question on everyone's mind has been: When will Apple expand the portfolio to reach into all market segments? I remember thinking in 2007 whether it would be in six months or a year that they would create a "mini", "nano" and "classic" line-up which served them so well with the iPod.

    Apple however took a different approach. To their credit, they focused on the platform and built a consistent experience around a fixed screen size to nurture an ecosystem. They also improved the power of the device so that experience would improve to be better and more robust. In other words, they treated every iPhone as not being good enough, needful of every megahertz of power, every pixel of screen and every minute of battery life. They polished the OS constantly and added APIs by the thousands.

    In other words, they acted like a computer software company, not like a "device vendor" or like a handset manufacturer which was everyone's (including mine) frame of reference.

    Having expanded from iPhone to iOS and built the platform into non-cellular centric computers like iPad and iPod touch, they clearly showed a nonchalance about the operator channel and the amplification power it offers (an amplification which comes with a hefty price of dependency and strategic illusion.)

    But the mind always wonders back to the question of portfolio. Now that the product is maturing, the hardware is getting nearly "good enough". Perhaps even Apple might now consider letting go of the "frontier" of what's technologically possible and consider expanding its reach to the broader audiences it has willfully kept out of reach.

    And broad they are.
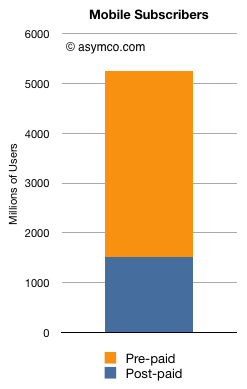
    Based on data published by Deutsche Bank and the ITU, we can calculate roughly how many customers Apple's current iPhone positioning has left unserved. I chose to use pre-paid/post-paid split as a proxy for unaddressed/addressed. This is an imperfect proxy but a pretty good one as most pre-paid subs see a full price for the iPhone (retail around $700 to $1000) vs. post-paid customers seeing a price of $200 or below. The $200 happens to be an important psychological price inflection point where volumes increase dramatically.

    The first chart shows the global split between pre-/post-paid subscribers as of 2010. Roughly 1.5 billion are post-paid and 3.7 billion are pre-paid. That means that nearly 70% of the world is not being addressed by the iPhone as it currently stands. Put another way, a shift in positioning might result in a 250% increase in addressable market.

    Tim Cook alluded to this in the last conference call when he said pre-paid markets, especially in China, are huge with share figures "starting with a nine". He also said separately that they would not be ceding any market--a hint if there ever was one, given the broadening of Android into previously feature-phone price bands.[1]

    We can even see the situation more clearly on a regional scale. The following chart shows the same pre-/post-paid split by region.
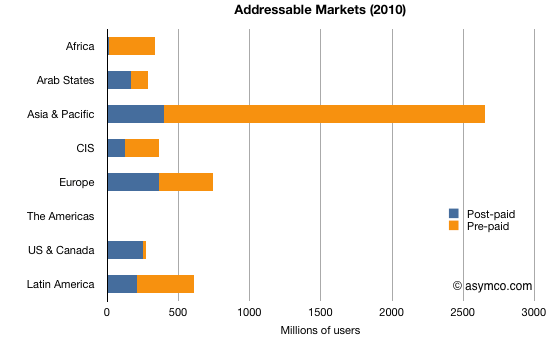
    You can visualize the iPhone having spent the last four years penetrating into the blue areas of the chart through the expansion of carrier agreements. With half the US & Canada area being finally filled in this year, most of the blue is now more-or-less within reach.

    Given the constraints on production, and given the improvements in the product and the improvements in the hardware (learning curves and price points) it may mean that Apple could finally be turning its attention to those orange areas.

    The time may be soon at hand that maturity coupled with limits of organic growth are leading the four-year-old iPhone to finally be re-defined as more than a post-paid skimming entrant. It may be time for the iPhone to more than just grow. It may be time for it to grow up and take on the whole market. Five billion people are waiting.

    ---

    Notes:

    1. Contrary to a commonly held belief, Apple does not shy away from market share. In the case of the iPod and even the original Apple 2, the company sought and obtained the top share ranking. In fact, the decision to pursue share vs profit is "context sensitive". Steve Jobs, at least, thinks so.
  2. When exceptional growth is not an exception

    Research · 69 comments

    Apple's last quarter's sales growth was an impressive 83%. It was not as high as the 92% earnings rise because there was a higher mix of iPhones this quarter than in the past. The iPhone is the most profitable product in Apple's portfolio so it impacts the gross margin significantly.

    The iPhone is, in fact, a huge part of Apple's business. In units it reached 5% global share and 14% US share. I'll go over the overall industry data as soon as all the major reports are in, but already it has been estimated that Apple is the largest phone vendor by profit and sales.

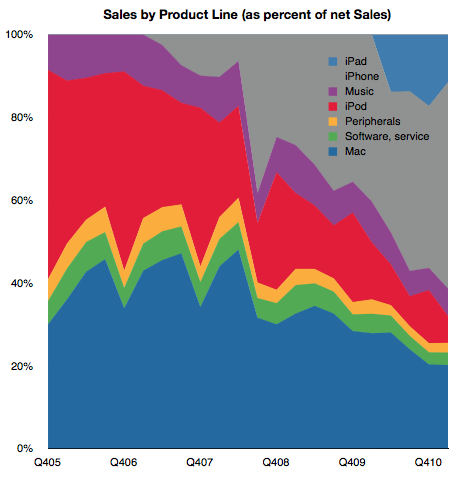
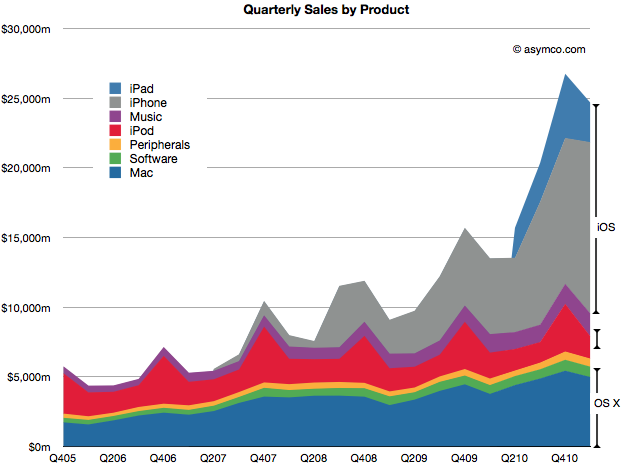
    In the following chart, you can see just how important the iPhone has become. Together with the iPad and iPod touch, iOS-powered devices make up about 65% of sales. That's almost three times the value of OS X based products which make up 23% of sales. That also leaves just 12% of sales not directly affected by these two juggernaut platforms (though music and peripherals are clearly indirectly affected by Apple's own platform products.)

    The following chart shows the same information as shares of total net sales.

    I've read that some of the uncertainty around Apple's future prospects is driven by the perceived vulnerability of these new blockbuster iOS products. At first glance this growth looks quite unprecedented and hence risky. 65% of sales from iOS did not exist four years ago. If you look at the sector it's hard to find any company that has doubled its sales in a few years from completely new product lines. Especially a mature company over 40 years in the business.

    Well, there is one.

    If you look again at the second chart above, you'll note that the proportion of sales held by iOS devices has mostly replaced the sales share that used to be held by iPod, itself a product that did not exist four years prior to the time of these charts.

    Apple consistently doubled its sales on the basis of the iPod. It's now consistently doubling on the basis of iOS.

    Exceptional claims require exceptional evidence. But that's exactly what the investment thesis for Apple should be: Exceptional growth is no exception.

    Steve Jobs himself said it well once: "I wasn't alive then, but from everything I've heard, Babe Ruth only had one home run. He just kept hitting it over and over again."

    Even this exceptionalism is not unique. It happens not just at Apple, but at another of Jobs' creations: Pixar.

    Perhaps this magic formula for exceptionalism is itself a fluke but what if it's not. What if blockbusters are really something that can be built with repeatable consistency. What would that be worth?

  3. Revisiting Estimates for Apple’s second quarter earnings (ended March)

    Research · 29 comments

    Estimates for Apple’s second quarter earnings ending March | asymco.

    Since making the original estimates In January,

    • Revenue: $24.5 billion
    • EPS: 5.89
    • iPhone unit sales: 18.4m
    • iPod unit sales: 10m
    • Mac unit sales: 3.6m
    • iPad unit sales: 7.3m
    • Gross margin percentage: 38.8%

    I revised them at the end of March to the following:

    • Revenue: $25 billion
    • EPS: 6.21
    • iPhone unit sales: 17.5m
    • iPod unit sales: 10m
    • Mac unit sales: 3.6m
    • iPad unit sales: 7.3m
    • Gross margin percentage: 39.6%

    In the past I was comfortable keeping untouched estimates made three months in advance. This quarter however there have been several developments during the quarter which were unforeseen and cause me to revisit my estimates.

    1. The Verizon iPhone launch. Observations of the event focused on line lengths and buying activity. However, Apple reports shipments not sell-through. I believe the deal structure was such that Apple obtained a very large order as condition to the relationship. The January and March update analysis did not consider this order size. We have also more data on sales from HTC and RIM and there is no letup in the market's growth. As a result I am revising the growth for the iPhone back up to 110% y/y and 18.4 million units.
    2. Crucially, I'm increasing iPhone ASP to $625 on the basis of this new demand and the likely delay of iPhone 5 launch.
    3. The iPad 2 launch. This product is still too young to see production and sales patterns. However, demand for the second version seems higher than for the first. Distribution is broader too. The unknown is production. I am keeping the unit number at 7.3 million which is the same as the level of CQ4.
    4. China is booming. The Chinese New Year occurred in the quarter and since last year that has meant a sequential increase in device sales for Apple. But it's a double edged-sword. Almost all production activity is shut down during the holiday period. Apple depends on China exclusively for manufacturing so they will certainly be affected. So whereas it's likely that we'll see increased demand from China this year due to even better distribution, macroeconomics and brand value I'm unsure if supply rose to match. Overall, I'm not changing unit growth due to his increased demand but I'm cautioning that there could be downside bias in my estimates.
    5. The tsunami disaster in Japan will affect some demand in Japan and some of the supply chain will be disrupted. However, the effect will be felt more by weaker competitors. It's possible that the event will amplify the shortages that Apple's pre-purchase agreements already created. The consequences are bad news for Apple's competitors but I rate it as neutral for Apple.

    Given these new facts coming to light, I would update my estimates as follows:

    • Revenue: $25.5 billion
    • EPS: 6.43
    • iPhone unit sales: 18.4m
    • iPod unit sales: 10m
    • Mac unit sales: 3.6m
    • iPad unit sales: 7.3m
    • Gross margin percentage: 39.9%

    Resulting EPS growth would thus be 93%.

    For the record, I value my January estimates since they are based on long-term pattern recognition rather than transient events and thus are more useful in forming a market theory.

    However, these transient events cannot be ignored and analysis needs to be informed by both theory and events. I will be watching to see which set of predictions (early, mid or late) will be more accurate.

  4. iOS distribution: do operators hold the keys?

    Research · 31 comments

    As iPad shipment volumes increase and as the iPod touch becomes the de-facto iPod, it's time to look at the overall split between iOS devices.

    I will focus the discussion between iPhone and iOS "others" because I believe the two categories differ greatly in terms of their positioning and market strategy due to the different channels.

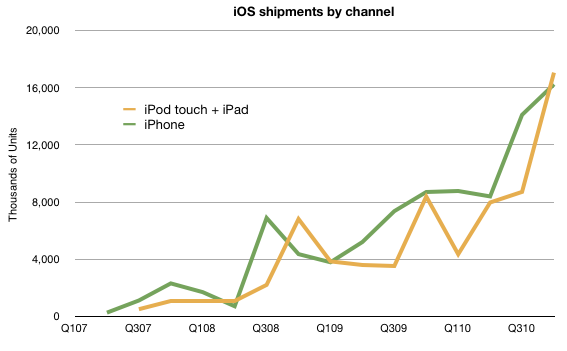
    The company does not provide iPod touch units shipment data but it can be estimated that, based on overall iOS numbers released in September, iPod touch represents approximately 50% of iPod units sold.

    If we put all we know together about volumes, we have the following chart:

    Note that iPod touch has, occasionally outsold the iPhone. The pattern of approximately equal volumes for the two types of products is likely to continue depending greatly on the growth rates.

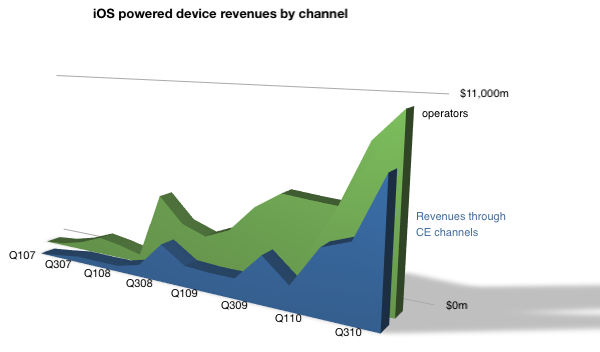
    Next, I turn the spotlight on revenues.


    Over $10 billion flowed in from Operators, and a bit under $8 billion from other channels.

    Note that I labeled the iPod touch and iPad as non-operator channel (Consumer electronics) distribution. Although this is not entirely true (and conversely iPhones are often sold through Apple stores) this gives a rough indication of split.

    The iPhone business is staying ahead of the other iOS businesses but the gap is narrowing.

    As previously noted, the iPhone is a unique product in Apple's portfolio. It depends on a distribution channel that no other product was designed around. This has advantages and disadvantages. The advantage is a high margin due to service revenue sharing but the disadvantage of network incompatibilities, politics and a range of telecom-related regulations.

    What I believe is that the non-operator channel will grow as a proportion of iOS revenues. This is both as iPad grows to disrupt personal computing and as the iPad emerges as a communications tool.

    As time passes, I believe Apple is motivated to also move revenues to its traditional channels. Whether, or to what extent, cellular phones will move in that direction remains to be estimated.

  5. Why operators will find it hard to sell tablets

    Research · 107 comments

    On the eve of iPad 2.0, it's time to think again about this curious new computer. My intuition tells me that this product category will behave very differently from the iPhone and will not be subject to the same sales ramp.

    The iPad has been on the market for less than a year but it's still a puzzle for many. It's a product that's often seen as an iPhone product line extension. From a hardware point of view, it certainly seems to be. It has an almost identical internal architecture and uses almost the same software. An engineer would look at it and reasonably say it's the same thing.

    However, from the way it's used and the way it's sold, it has very little in common with its smaller cousin. There are plenty of experts who can detail how the products are used differently, but I would highlight the portability of the iPhone makes it suitable for a completely different set of tasks than the less portable but more immersive iPad.

    But what I want to dwell on here is how differently the products are sold.

    I'll build the case from evidence that Apple provides. The most important observation is that the iPad is an unlocked product. Although you can hire an operator to provide you with data services for it, the product is designed not to rely on that. As a result the product is effectively "divorced" from the operator channel. This means it does not typically benefit (or suffer) from subsidy.

    This may seem an interesting side-note to the iPad story, but I think this is a central pillar of the market strategy. The iPhone was designed around a high-ARPU data plan. I've even suggested that the iPhone is nothing more than a data plan wrapped in glass and polished metal. Because it was designed to enable migration of cellular voice users to data plans, it's priced to skim profits from the migration. At some future point in time when a skimming strategy is no longer optimal, the iPhone might be re-positioned for penetration, but that time is not now.

    As part of a skimming strategy, the iPhone has a limited distribution channel. It's only sold through special agreement with selected operators. Again, timing is crucial. That channel is expanding, but for nearly four years the product has not been positioned for sale through any channel other than Apple retail and Operator retail.

    On the other hand, the iPad is marketed for penetration. It had a low price and an unlimited distribution strategy. It could be sold through any consumer electronics product point of sale. And then some. It could conceivably be sold through as many if not more points of sale as the iPod (i.e. tens of thousands.)

    It can be sold in any country, can be distributed through middlemen and can be priced arbitrarily [1]. It can be bought in bulk by companies or schools or hospitals. It can be re-sold in a secondary market. It is essentially a perfectly liquid commodity.

    Now we can step back and ask why and what are the implications for competitors.

    The reason the iPad was positioned asymmetrically to the iPhone is, I believe, because it could be. I believe that the iPhone is sold the way it is (through operators) because that's the only way it could be sold effectively. Cellular products have always come with lots of fine print, footnotes and asterisks rooted in the regulatory environment that underlies the industry.

    The iPad is a product built and sold along the lines of the Mac and the iPod--unrestricted by orifices and aligned with the unregulated environment that computers have always enjoyed. Essentially, for the iPhone, Apple chose to go along with the telecom industry's rules but as soon as it had a product that did not need to comply to those rules, it ran back to its comfort zone: control.

    If we take this to be the cause, the implications for competitors become clearer. Apple is more in its element selling the iPad than it is in selling the iPhone. Other tablet contenders however are in an opposite strategic stance. Almost all the credible tablet alternatives rely on the telecom channel for distribution. The rush to build iPad alternatives is as predictable as the derision that was poured on the product when it was launched.

    But the alternative products are positioned in different ways. They are positioned as big phones.

    Which brings me to my final point: selling big phones is hard.

    These products are not compliant with what users expect from an operator: a service plan. As a result they are also not competitively priced with the iPad. Apple engineered a price for the iPad that makes comparisons extremely favorable. Buyers know the thing they are buying is not a phone so they look at the price carefully.

    But the most crucial weakness of alternative vendors is the fact that operators don't know how to sell tablets. Tablets are small computers. They are bought in the same way that buyers buy laptops: in-store testing. Notice that except for the iPhone operators only provide phone mockups in their stores. This is because they want buyers to discuss their purchase with a sales rep. This is not the way laptop hunters shop. Another tell-tale sign of a disconnect between operators and tablets is that operator shops are physically tiny. PCs (and tablets) need large tables for users to look, touch, heft and fondle. Just on square feet alone, operators and tablets are not a good match.

    If you need any more evidence, consider the plight of operator-subsidized netbooks.


    ---

    Notes:

    1. I realize that this is not currently true and the distribution is limited but that's only a matter of supply constraints. There is no theoretical positioning limitation.


  6. iPhone and iPad: Fine Young Cannibals?

    Research · 35 comments

    The iPad and iPhone came, saw and conquered new markets. But since the products launched the question on every analyst's mind has been on how much have these products "cannibalized" their brethren the iPod and the Mac.

    This notion of "cannibalization" applies when a product is designed to compete and "eat" the share of another product in a company's portfolio. It has some negative connotations since it implies loss but many times the thinking is that it's better to cannibalize oneself rather than have it done by a competitor.

    But have iPhone and iPad taken share from their competitors?

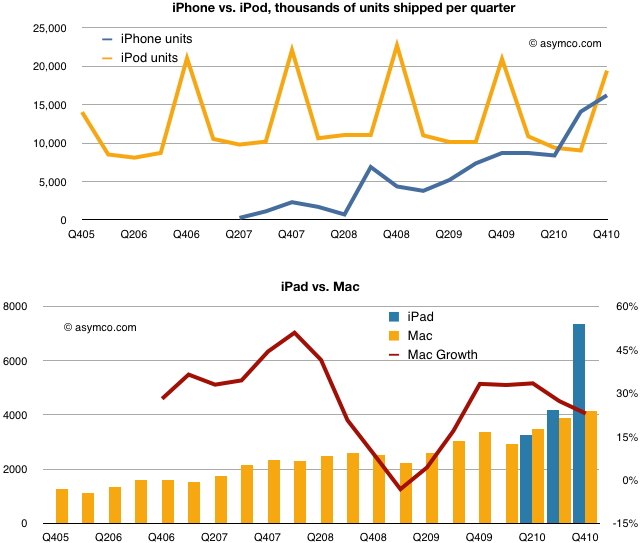
    The following charts compare the total units of iPhones vs. iPods and iPads and iPads vs. Macs.

    The evidence does not show cannibalization.

    Although both iPhone and iPad have crossed over and are selling more units than their internal competitors, the old guard has not faded away.

    Indeed, the Mac shows resilience and the iPod, although not growing in units has maintained sales value. What we don't see is a clear gain for the entrants at the expense of the incumbents.

    We can't be sure how long this happy co-habitation will last, but for now the new products are fine and young but not cannibals.

  7. iOS enables 71% of Apple's profits. Platform products power 93% of gross margin

    Research · 17 comments

    As the highly profitable iPhone makes up an increasingly larger proportion of Apple's sales, the overall gross margin would be expected to grow.

    Sure enough that's what's been happening.

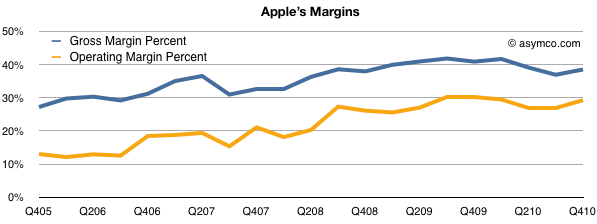
    The gross margin percent, which measures the direct or variable costs of production vs. price, shows a healthy rise in the last five years from slightly below 30% to around 40%. The Operating Margin, which also includes the overhead or fixed costs like R&D and SG&A, shows a similar rise, reaching about 30%.

    Margin expansion while sales quadruple is a good indicator that a company is producing real value not just trading sales volume for profit.

    Focusing attention on individual product lines, it's clear that the iPhone is the largest component of sales and of profits. We don't have specific product line-item gross margins from management, but we can estimate a figure for the iPhone by several means.

    First, we can work out roughly what every other product line's margin is due to their longer histories. (Mac and iPod have reliable profitability estimates). What's left can be deduced to make up the iPhone's margin.

    Alternatively, we can get estimates of the bill of materials and add in some of the other direct expenses like manufacturing, warranties, shipping and incidentals to get an estimate of the cost of production.

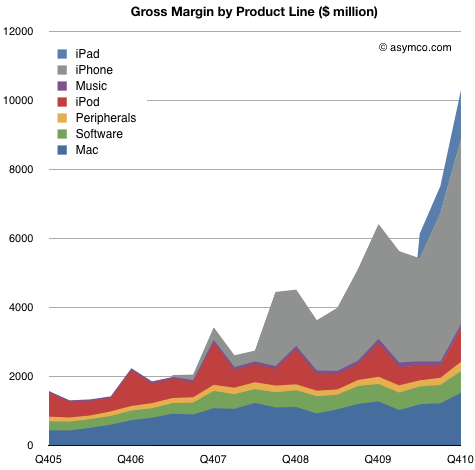
    These methods allow me to guess at a margin for the iPhone of about 50% for the last quarter. Based on these inputs we can plot the gross margins for the entire company's product lines:

    Overall, gross margins have reached over $10.3 billion in the quarter, increasing 543% from five years ago and 61% from a year ago.

    That's great, but by knowing product line profitability we can get a better feel how the company changed strategically.

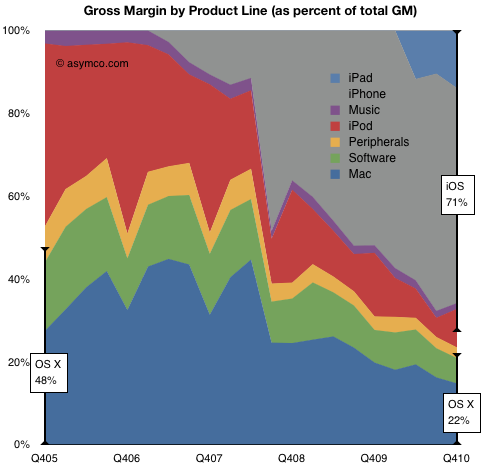
    In the following chart I show the percent of gross profit captured by each product line.

    What we can observe is that at the end of 2005, OS X based products made up nearly half the profits. The rest was mostly the iPod, which was not a software platform product.

    A short five years later, OS X products which, although having grown in volume, made up only 22% of total margin. The rest was mostly iPhone but with significant contributions from iPad and iPod. What's most important to note is that the non-OS X profits are almost all powered by iOS.

    iOS powers about 70% of Apple's current gross profits. Combined with OS X, 93% of profits are from platform products.

    So again the question about Apple being a software, hardware or media company comes back. Perhaps, those categories are not relevant. Perhaps Apple is a platform company.

  8. Apple's Growth Scorecard: 63% average earnings growth over 16 quarters

    Research · 30 comments

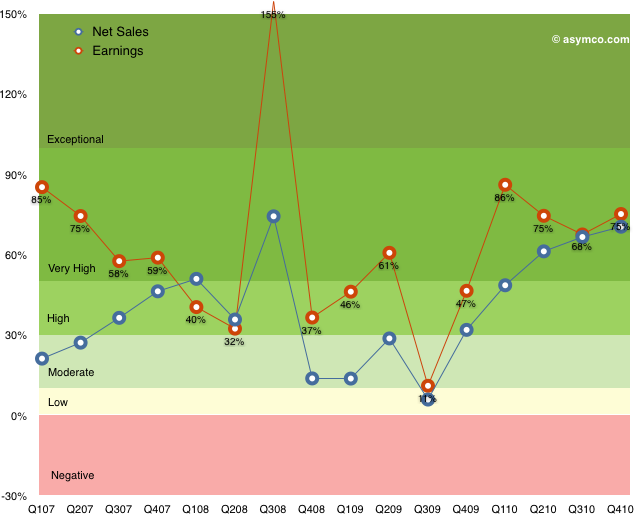
    In the last quarter Apple's top line grew by 70% and the bottom line by 75%.

    For a historical perspective, the following table shows year-on-year growth for products[1] and sales/earnings color coded with an arbitrary scoring range.

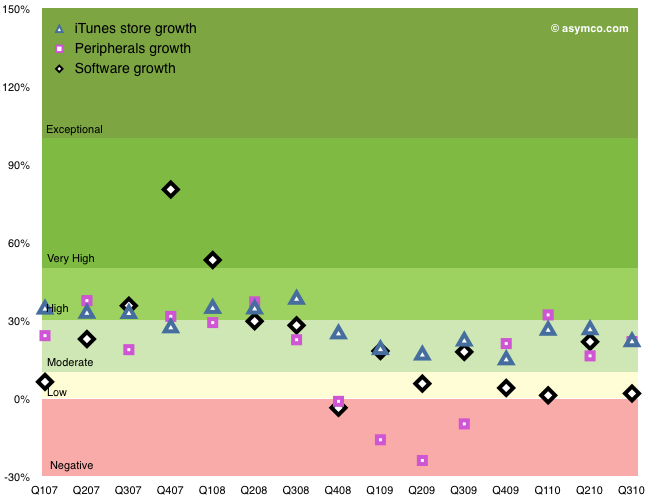
    The major changes from the last quarter were the acceleration in software sales and the return to growth in iPod sales. iPod benefited from the continuing shift to iOS as the mix is now 50% touch in the portfolio.

    Software growth reached a level not seen since 2008. It's not clear to me yet  which products drove this increase.

    Overall the growth is both wide and deep. I'm most impressed with the iPod as it was a surprise to hear such a high mix of touch.

    The following chart shows the top and bottom lines plotted over time with color bands corresponding to the score system in the table above.

    Note how earnings growth has been in the high or very high or exceptional range for all but one quarter over in the last four years[2].

    Apple transcends the mythical "rule of large numbers"[3]. It's not only a mega-cap, but the second largest company in the world by market cap. Not only has this enormously valuable asset just grown in intrinsic value creation by 75% but it has maintained a growth of 70% for the last five quarters.

    If that weren't enough, the average earnings growth has been 63% for the last sixteen quarters.

    ------------

    Notes:

    1. The iPad is not included since we don't have more than one year of sales and this is year-on-year not sequential growth.
    2. The low growth for Q3 '09 was due to the corresponding spike the year before when the iPhone 3G was launched. That launch quarter in 2008 was a seminal turning point in the history of the phone industry when it became clear that the iPhone was not a passing fad. Steve Jobs famously participated in the conference call calling attention to the data which was obfuscated by subscription accounting. Alas, the news was lost in a sea of credit crunch panic.
    3. I have an aversion to this rule as "large" is never defined except in relative terms. For example a $1 trillion market cap may be large because it's unprecedented, but it may be a trifle if the company is priced at book value.
  9. The iPhone is not superfluous, not easily copied, not revolutionary and not a premium product

    Research · 61 comments

    The release of the iPhone is rightly acclaimed as a watershed event in the history of telecom. It was a sensation. But it was also a product that was widely underestimated and dismissed. Even today expert opinion is divided. The critics of the product transitioned directly from labeling it a superfluous bauble to an obvious and copyable sustaining innovation. Advocates of the product describe it as revolutionary and dazzling with the potential for capturing significant profit share due to premium pricing and positioning.

    So which is it?

    I'll argue that it's none of the above. The iPhone is not superfluous, not easily copied, not revolutionary and not a premium product. What it is is disruptive.

    First, we have to quickly define disruptive potential.

    A product is disruptive if it competes with an existing, incumbent set of products on a new basis. It competes along a new measure of performance. That means it's either "low end" and hence cheaper, simpler, more modular and conformable, or it creates a "new market" where completely new measures of performance or quality are relevant.

    In both "low end" and "new market" disruptions the product is usually wrapped in a business model that insulates it from incumbent response due to inherent asymmetries. Incumbents will find the economics of the entrant product unattractive and will be motivated to ignore it or actively avoid copying it.

    The consequences of disruptive product entires are often catastrophic for the incumbents because, over time, the disruptor product vacuums up all the profits in the industry, robbing the incumbents of the fuel to respond by the time they become motivated to do so. In essence, the transfer of value to the new basis of competition happens so slowly that the threat is imperceptible until it's too late.

    If we look at this definition, it's startling that the iPhone does not seem to fit.

    As a phone, it's not cheaper, nor modular and hence not "low end". It did not create a new market.  As a phone, although it did recruit more regular phone users into becoming smartphone users, it was not the first or last phone to do so. Its phone business model was not a radical departure. It was not ignored by the mobile phone incumbents who reacted with various degrees of urgency and vigor. It was actively copied in every way from the UI to the ecosystem to the pricing model and distribution.

    The only thing that seems to have happened according to the disruptive formula was the transfer of profits from incumbents to Apple, at least temporarily.

    So the iPhone seems to be correctly classified as a sustaining innovation. Something that moves the phone market forward and which, except for a temporary misallocation of profits, will entrench the incumbents after they manage to copy it effectively.

    However, here is where we have to dig a little deeper.

    Market analysis easily becomes myopic when looking only at a market defined by a product. I've argued in the past that strategic insight comes from looking at products that cross over their market boundaries. Especially products that are hired to do different jobs than the same products in their categories. The iPod may seem like an MP3 player but it caused catastrophic profit collapse in multiple industries. It knocked out the CD business, it crippled the component audio system "Hi-Fi" industry, it razed the music retail business and affected the entire music value chain. It's still pounding at the gates of video and TV production. And, almost as a side-show, it crushed the Walkman.

    Even though it was a music player, the MP3 device market was the smallest target for the iPod. It turned out to be far more dangerous to ancillary industries. The reason is subtle: it competed as an integrated ecosystem. You hired the iPod to serve you music everywhere, not just in your living room. And it did the job in an integrated way from source to earbuds taking what was a hodgepodge of modular components built around analog music and smoothly integrated them to deliver music in new, non-consuming contexts.

    The lesson is therefore that when looking at the iPhone one has to look at ancillary industries not just at phones.

    Phones have always been a component in a wider inter-related telecom value network. Even today they are often called "terminals" in the industry meaning that they are the end points of a network. Similar to the PC, the iPhone enables a migration of intelligence away from the center toward the edge of the network resulting in a de-valuation of the network itself.

    I argue that the real disruption of mobile computing (i.e. iPhone) is made possible not by the smartphone technologies but by mobile broadband. Once broadband became mobile with 3G the smartphone could shift its focus (jobs it's hired to do) from voice to data. That shift is disruptive to incumbents because they built their businesses around operator distribution and operator service economics. With apps, mobile computing brings with it services which allow all communications to be independent of operators. Selling ringtones, maps, email and video-on-demand are all dead business plans today. But operators clung on to these hopes for many years and forced vendors to comply to this strategy.

    The incumbents relied so much on the telecom value chain, where the value flows from the monthly service charge, that they would not deploy technologies or business models that were asymmetric to operator business models. This is the root cause for Nokia and Samsung and Motorola and LG "missing the boat" on smartphones. All the vendors had the pieces of technology on their shelves. But when they took these technologies to their customers, the customers rejected the package.

    This is why entrants like RIM and Apple could easily gain a foothold and grow. They had modest volumes, sold new concepts like business email and new UIs with iconic designs, but did not go after the core business model. This is similar to how iPod/iTunes got a toehold with the record labels. By the time the disruption took hold, operators were addicted to the new high-ARPU being generated even though they were all pure bitpipe plans. A bird in the hand is worth two in the bush, so the new device brands stuck.

    Do the incumbents still have time to respond effectively? It's less and less likely. They cannot build the new computing ecosystem without the distribution power of operators. Note that iPhone 'clones' in Android are still sold via operators and that nobody is interested in making either iPod touch clones or iPad clones sold independent of the operator channel/subsidy model. This is not because of technical or economic reasons but because of a lack of distribution (and lack of integrated content).

    When you step back and look at the phone in the context of the network business model as well as the shifts in consumer jobs to be done you realize the potential is far greater than taking share from incumbents. The iPhone is not divided into a portfolio of different phones, but it's a part of a portfolio of new mobile computing products. It just happens to be the only one which still depends on the cellular operator distribution network.

    Seen as part of a new mobile computing paradigm and following the trajectory of the mainframe, mini-computer, PC and laptop, the iPhone is an essential, non-superfluous device for a vast population of new users.

    Seen as an integrated app ecosystem with strong network effects, it's not easily copied. Responses that only account for it as a glass and metal object of desire will fall way short of being competitive. As the hardware was always available to competitors, it's not a revolution in hardware or even in user experience.

    Most importantly, seen as a computing alternative merged with a communication appliance, it and its siblings are not premium products. The pricing and service structure around it make it seem a low cost alternative for solving the jobs it's hired to do.

    In other words, it is as disruptive as it gets.

  10. Postcards for Asymco: metropolitan distribution of views by operating system

    Research · 26 comments

    Based on a reader query, I tried to find out where, by city, my readership is concentrated. I also sought to break this audience down by operating system.

    Here are some observations:

    For the last 30 days, here are the top operating systems used to reach Asymco.com, with the number of views from each.

    1. Macintosh 153,768
    2. Windows 101,329
    3. iPhone 78,716
    4. iPad 34,878
    5. Linux 7,262
    6. iPod 5,516
    7. Android 4,869
    8. (not set) 1,236
    9. BlackBerry 447
    10. SymbianOS 396

    Looking at each OS, I can list the top cities where readers came from.

    Macintosh 153,768

    1. London 6,513
    2. San Francisco 5,316
    3. New York 5,089
    4. Cupertino 4,293
    5. Austin 2,589
    6. Sydney 2,182
    7. Helsinki 2,131
    8. Los Angeles 1,918
    9. Seattle 1,847
    10. Portland 1,482

    Windows 101,329

    1. London 3,827
    2. New York 3,275
    3. Helsinki 1,598
    4. San Francisco 1,504
    5. Seoul 1,409
    6. San Jose 1,260
    7. Chennai 1,226
    8. Sydney 1,116
    9. Seattle 1,100
    10. Melbourne 1,035

    iPhone 78,716

    1. San Francisco 5,203
    2. New York 4,406
    3. London 4,053
    4. Chicago 2,328
    5. Seattle 1,836
    6. Los Angeles 1,638
    7. Melbourne 1,430
    8. Seoul 1,402
    9. (not set) 1,376
    10. Sydney 1,261

    iPad 34,878

    1. London 1,759
    2. New York 1,060
    3. San Francisco 1,020
    4. Chicago 857
    5. Melbourne 739
    6. Outremont 694
    7. Santa Rosa 585
    8. Seattle 555
    9. San Jose 456
    10. Santa Clarita 440

    Linux 7,262

    1. San Francisco 376
    2. London 233
    3. Helsinki 180
    4. New York 131
    5. Cambridge 126
    6. Bangalore 109
    7. Nantes 109
    8. Sydney 107
    9. Perchtoldsdorf 93
    10. Paris 86

    iPod 5,516

    1. Eau Claire 471
    2. Melbourne 396
    3. Seattle 290
    4. Abuja 248
    5. San Jose 214
    6. Hudson 197
    7. Sydney 195
    8. Budapest 109
    9. Boston 95
    10. London 86

    Android 4,869

    1. Seoul 761
    2. (not set) 325
    3. Dallas 248
    4. New York 169
    5. Amsterdam 148
    6. Calcutta 131
    7. San Francisco 81
    8. London 74
    9. Los Angeles 74
    10. Bergen 72

    BlackBerry 447

    1. New York 121
    2. (not set) 78
    3. Waterloo 56
    4. London 50
    5. Buenos Aires 16
    6. Hong Kong 9
    7. Oldsmar 9
    8. Fairfield 7
    9. Wappingers Falls 6
    10. Boston 5

    Symbian OS 396

    1. Helsinki 216
    2. Kauniainen 23
    3. London 21
    4. Seoul 13
    5. Tehran 10
    6. Frederiksberg 6
    7. (not set) 4
    8. Chennai 4
    9. Krakow 4
    10. San Francisco 4

    The first surprise for me is that Seoul is the most popular source for Android views.

    The second is that London is so prominent. Although the US is the biggest source of traffic by far, London is a very concentrated source from the UK.

    The third is how there seem to be no Blackberry readers in the SF area.

  11. Apple's Growth Scorecard

    Research · 14 comments

    Every quarter I try to score growth by top, bottom and product lines. As unforeseen growth is the only driver creating shareholder value, it's of paramount importance to measuring a company's performance.

    For Apple, the analysis is fairly straight-forward. There are relatively few product lines (seven including the iPad). I measure y/y sales growth and try to form a picture that is easy on the eyes and mind.

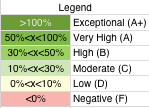
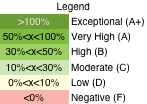
    The method I'm using now is color coding growth for each line according to the legend to the left.

    The table that follows shows each product plus the Net Sales and Earnings lines according to this color coding. I also added an average column for reference.

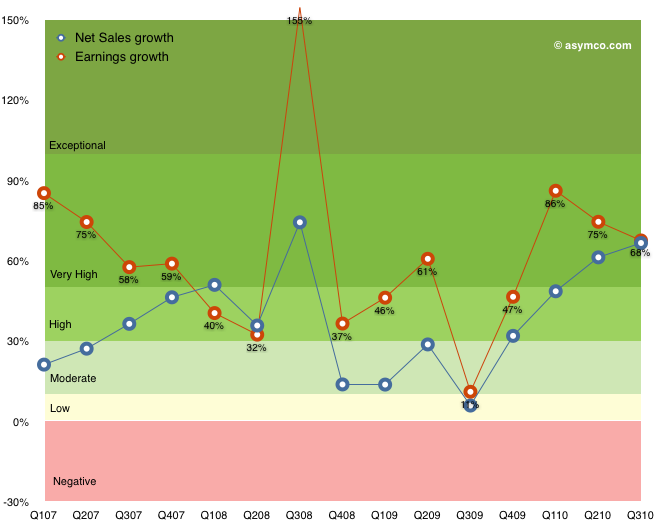
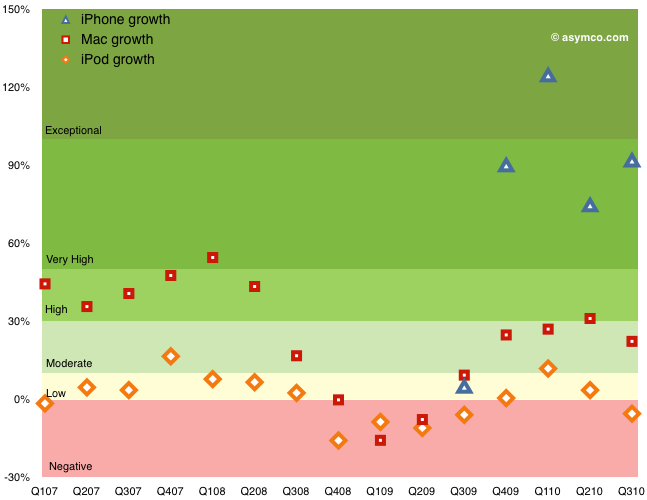
    The following graphs show the same data with color coding for the rates as they change over time. I broke the data into three charts: Top/Bottom lines, Hardware Products, Other Products.

    Discussion

    Hopefully this representation describes the company's growth without requiring too much explanation. Earnings growth, which determines ultimate value created is near all-time highs, well into the "Very High" (A) growth band. Apple have recovered from the Moderate-to-High (B/C) bands during the recession and are near the levels of 2007 when the company was trading at a P/E of 50 (today's P/E for Apple is 20). Sales growth broadly followed earnings growth.

    Within the products, the iPhone again shows exceptional performance. The growth during the first five quarters was (literally) off the scale (above 150%--see table for actuals). The average quarterly y/y growth has been 234%! Last quarter's 92% growth is very near the 100% threshold for exponential growth. This after three years in the market.

    The Mac growth is Moderate (B) and that may be because it was not a launch quarter for portables. The Mac underwent Very High (grade of A) growth for a period of 2008. The iPod shows weakness. The product has been in a Low-to-Negative  (D to F) band of growth since the iPhone launched. Clearly a mature product line but one which has been largely subsumed into the iPhone and iPad. The iPod touch is increasingly a large proportion of the iPod line.

    The non-hardware product lines are Low-to-Moderate growth products. The Peripherals business tracks very closely to the Mac business and dipped negative during the recession.

    Overall, the growth scorecard is in the "Very High" category, or a grade of "A", mostly driven by the iPhone and iPad. Whether this growth will be reflected in the share price is a question reserved for a future discussion.