Asymco

Asymmetric Intelligence

iTunes

  1. The Conundrum of iTunes' Recognition of Revenues

    Research · 10 comments

    An excerpt from a report titled "iTunes Business Review" which I'm currently writing:

    Revenue Recognition

    Before proceeding it’s also important to understand one more detail: The company does not report all transactions through iTunes as revenue. To quote the 2012 Annual Report (10 K):

    For third-party applications sold through the App Store and Mac App Store and certain digital content sold through the iTunes Store, the Company does not determine the selling price of the products and is not the primary obligor to the customer. Therefore, the Company accounts for such sales on a net basis by recognizing in net sales only the commission it retains from each sale. The portion of the gross amount billed to customers that is remitted by the Company to third-party app developers and certain digital content owners is not reflected in the Company’s Consolidated Statements of Operations.

    What this means is that App revenues are only reported at the 30% level that is retained by Apple. The 70% paid to developers is excluded from Apple’s financial reports. The same is true for other products for which it considers to be acting as an agent. The difference seems to be mostly in cases where Apple does not define the end user pricing. This is mostly true for ebooks however that may not be true for all book titles.

    This distinction between “gross” revenues and “reported” revenues is maintained in this report but both are presented for consideration. Gross revenues are needed for comparing the media businesses against each other and for competitive assessment but reported revenues are needed to test assumptions against ground truth.

    This can be explained with an example:

    If a song sells for 99c then Apple reports all 99c as Revenue and then pays the record company about 70c and uses 30c to operate the store and pay for transaction costs. In the case of music it means the Gross Revenue is 99c and the Reported Revenue is also 99c.

    However, if an app sells for 99c then Apple reports only about 30c as Revenue. It does not consider the portion paid to developers as revenues for itself. It spends a portion of the 30c to pay for transactions, hosting, and the time testing and accepting the apps. In the case of apps and books it means the Gross Revenue is 99c and the Reported Revenue is 30c.

    So if Apple sells one song and one app then the Consolidated Gross Revenue is 2 x 99c or $1.98 but the Consolidated Reported Revenue is only $1.29 (99c + 30c).

    The difference in accounting is sometimes called "agency" vs. "wholesale" and it applies in some retail businesses. Another term sometimes used for used goods is selling items "on consignment".

    The reasoning for why some media are treated one way or another is cited in the Annual report as "the Company does not determine the selling price of the products and is not the primary obligor to the customer". In the case of Apps, the price is set by the developer and the developer is obligated to deliver on the promise. Apple acts as transaction processor and they don't consider that they ever owned (and hence never sold) the app. Note that this accounting is probably discretionary. They decided to do it this way and it's not clear that it was necessary to do it this way by any regulation.

    This distinction between two treatments of revenue makes it difficult to understand the complete story behind iTunes.

    --

    If you're interested in the full report, contact me directly.

    UPDATE:

    Apple’s rationale can be partly justified from a reading of a Financial Accounting Standards Board statement titled “Reporting Revenue Gross as a Principal versus Net as an Agent” (Emerging Issues Task Force Abstract EITF 99-19 http://www.fasb.org/pdf/abs99-19.pdf) a portion of which is quoted below.

    “Indicators of Net Revenue Reporting

    15. The supplier (not the company) is the primary obligor in the arrangement— Whether a supplier or a company is responsible for providing the product or service desired by a customer is a strong indicator of the company's role in the transaction. If a supplier (and not the company) is responsible for fulfillment, including the acceptability of the product(s) or service(s) ordered or purchased by a customer, that fact may indicate that the company does not have risks and rewards as principal in the transaction and that it should record revenue net based on the amount retained (that is, the amount billed to the customer less the amount paid to a supplier). Representations (written or otherwise) made by a company during marketing and the terms of the sales contract generally will provide evidence as to a customer's understanding of whether the company or the supplier is responsible for fulfilling the ordered product or service.
     

  2. Measuring the iBook market

    Research · 49 comments

    In June of 2011 Apple announced that 130 million ebooks were sold through iTunes. In October of 2012 it announced that 400 million sold.

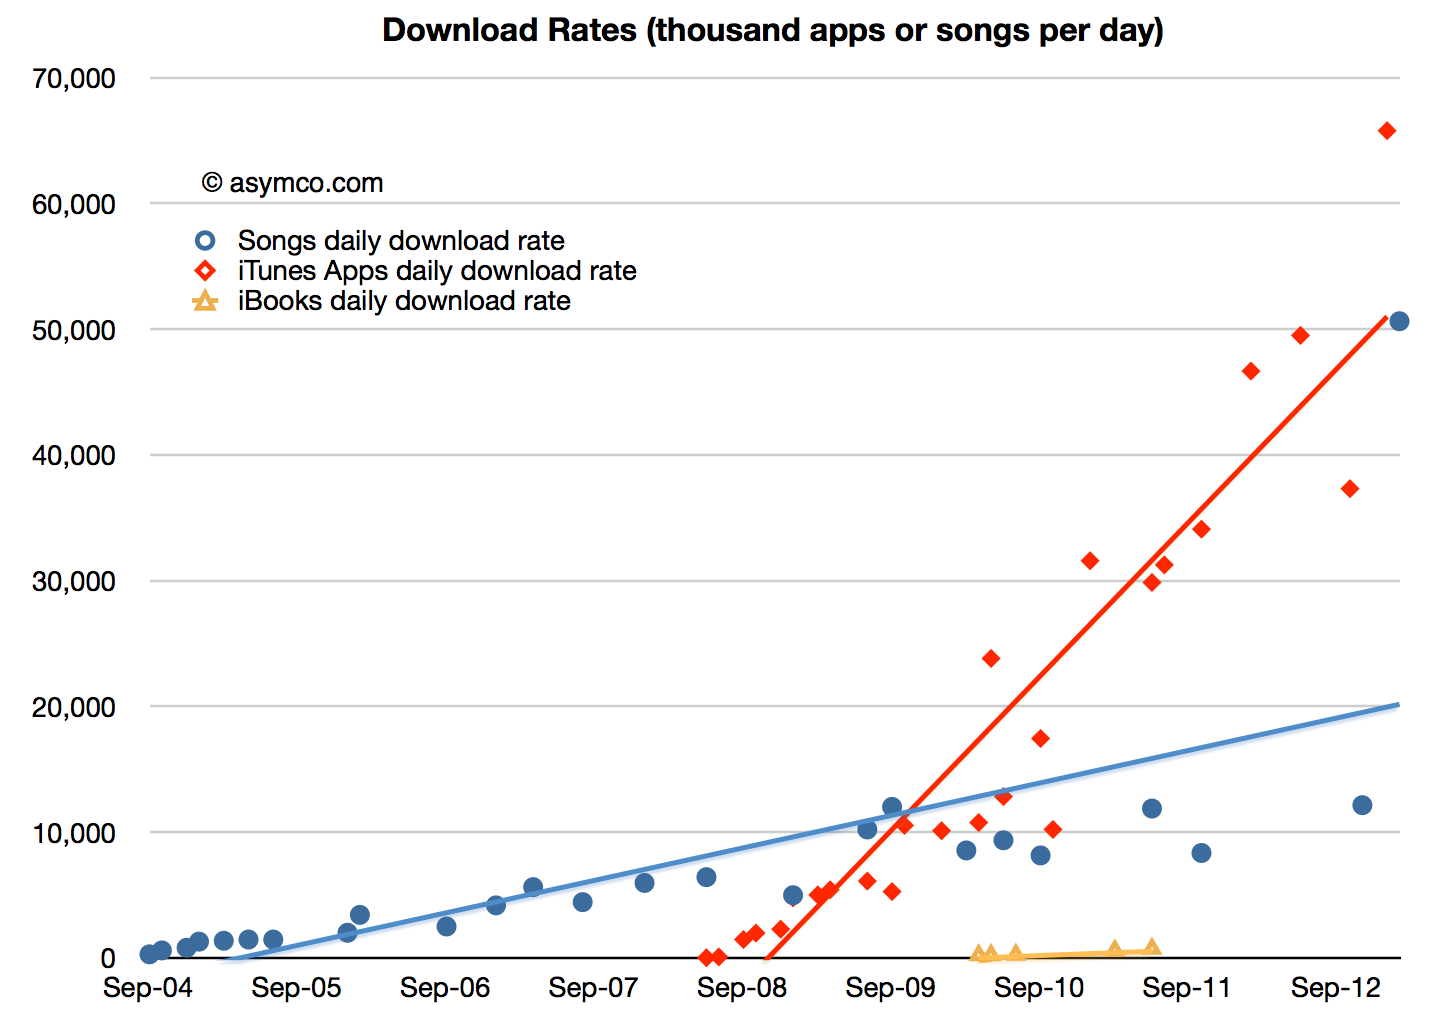
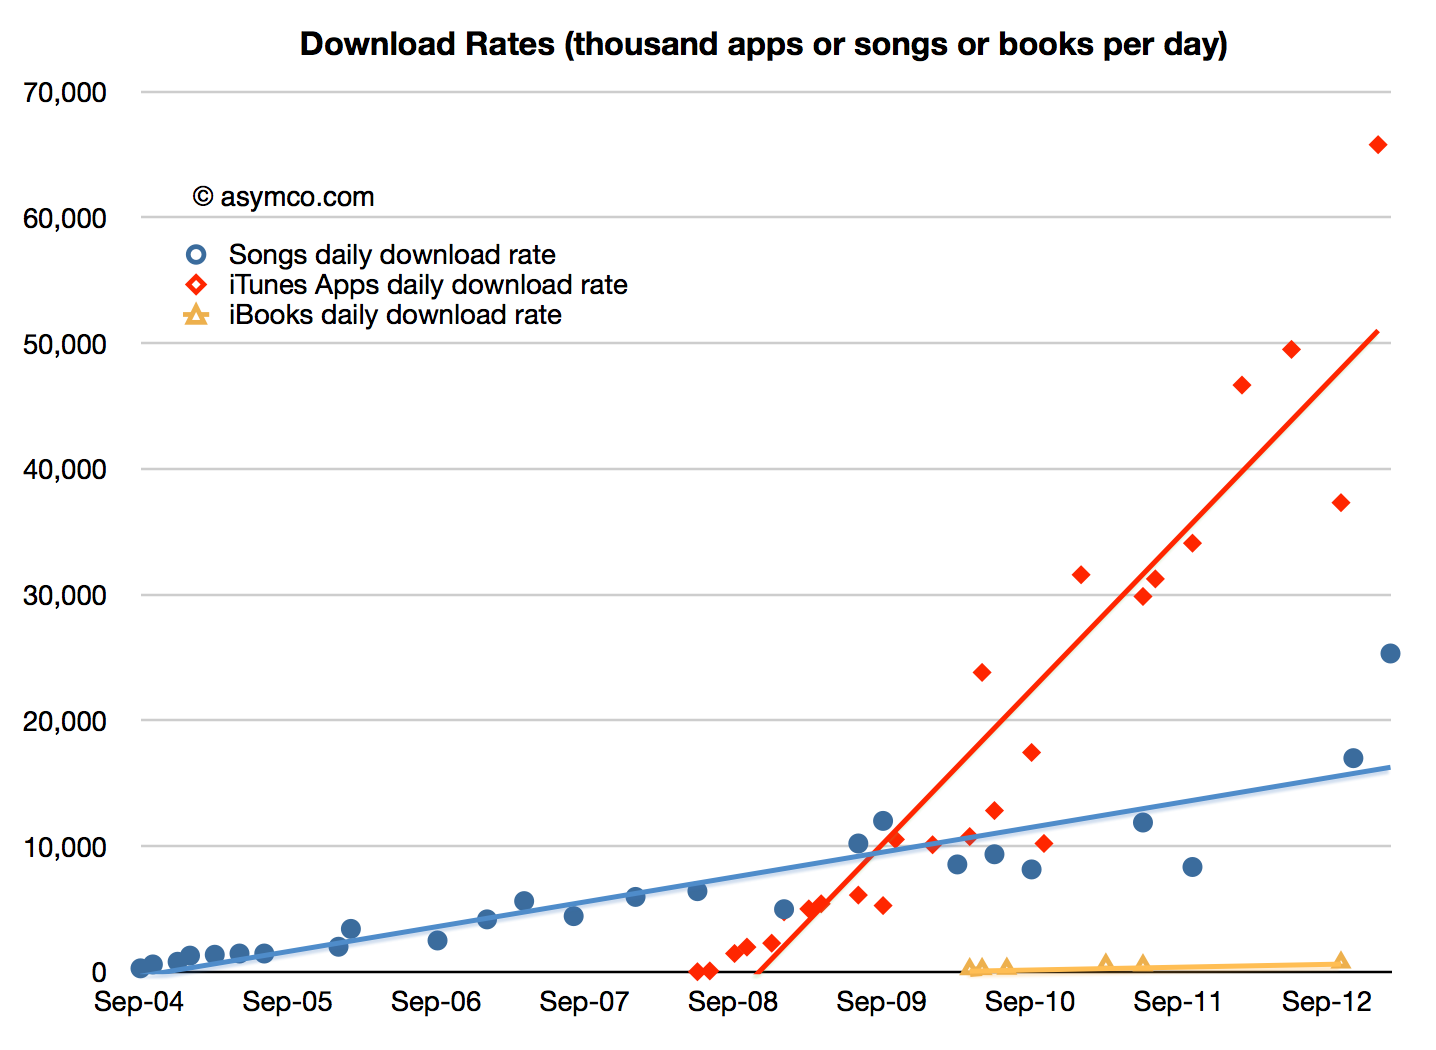
    That means 270 million ebooks were sold in 16 months. Or about 17 million units per month, on average. It also suggests 2012 ebook sales of about 200 million units.[1] The following graph shows the download rate of books relative to apps and songs:

    Screen Shot 2013-02-28 at 2-28-3.09.25 PM

    The download rate looks paltry but we need to remember that Apps have a very low average selling price (about 23 cents including in-app purchases) and that Songs are probably priced around $1.1 on average. In contrast each ebook could be generating about $10 per download.

    However that may be a bit high. We don't know the mix of lower priced and higher priced books. Many best sellers are $13 or $14 but there might be some free books in the mix as well.

    If I choose a more conservative $9 average selling price and assuming a 70% share for the publisher then Apple's iBooks generated about $1.3 billion in payments and grossed about $1.8 billion.

    In the past few posts I measured the iTunes App ecosystem and the Music economy. With the iBook market now measured we can derive the size of the only remaining media type: video.

    Screen Shot 2013-02-28 at 2-28-3.17.57 PM

    ---

    Notes:

    1. I've seen one estimate that world-wide ebook unit sales reached 860 million implying Apple's share was about 24%.
  3. The iTunes Value Structure

    Research · 19 comments

    The International Federation of the Phonographic Industry (IFPI) reported that global digital revenues were $5.6 billion in 2012. This represented about 9% growth from 2011 and accounted for 34% of total industry revenues[1].

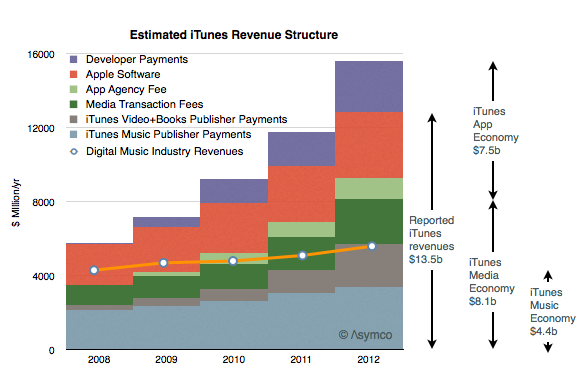
    Apple regularly reports iTunes as a separate revenue item and occasionally it also reports payments data for developers and app download rates. By interpolating the data published and combining it with some assumptions it's possible to estimate the mix of revenues (and costs) associated with iTunes.

    My yearly estimates are summarized below.

    Screen Shot 2013-02-26 at 2-26-6.04.23 PM

    Note that I also included historic digital music industry revenues (as a line). I also included the following summary items:

    1. iTunes reported revenues were $13.5 billion (including Apple's own software sales)
    2. iTunes gross revenues were about $15.6 billion (including payments to developers)
    3. The iOS and OSX "App Economy" was about $7.5 billion while the iTunes "Media Economy" was about $8.1 billion (both figures include transaction costs.)
    4. The iTunes Music economy was $4.3 billion of which $3.4b was paid to music labels.[2]

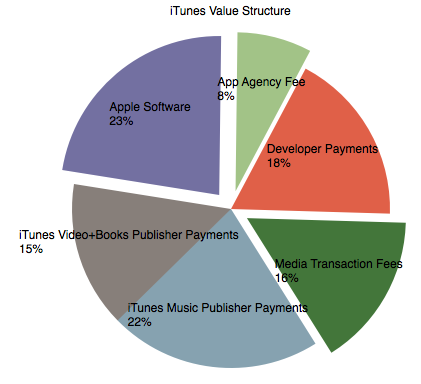
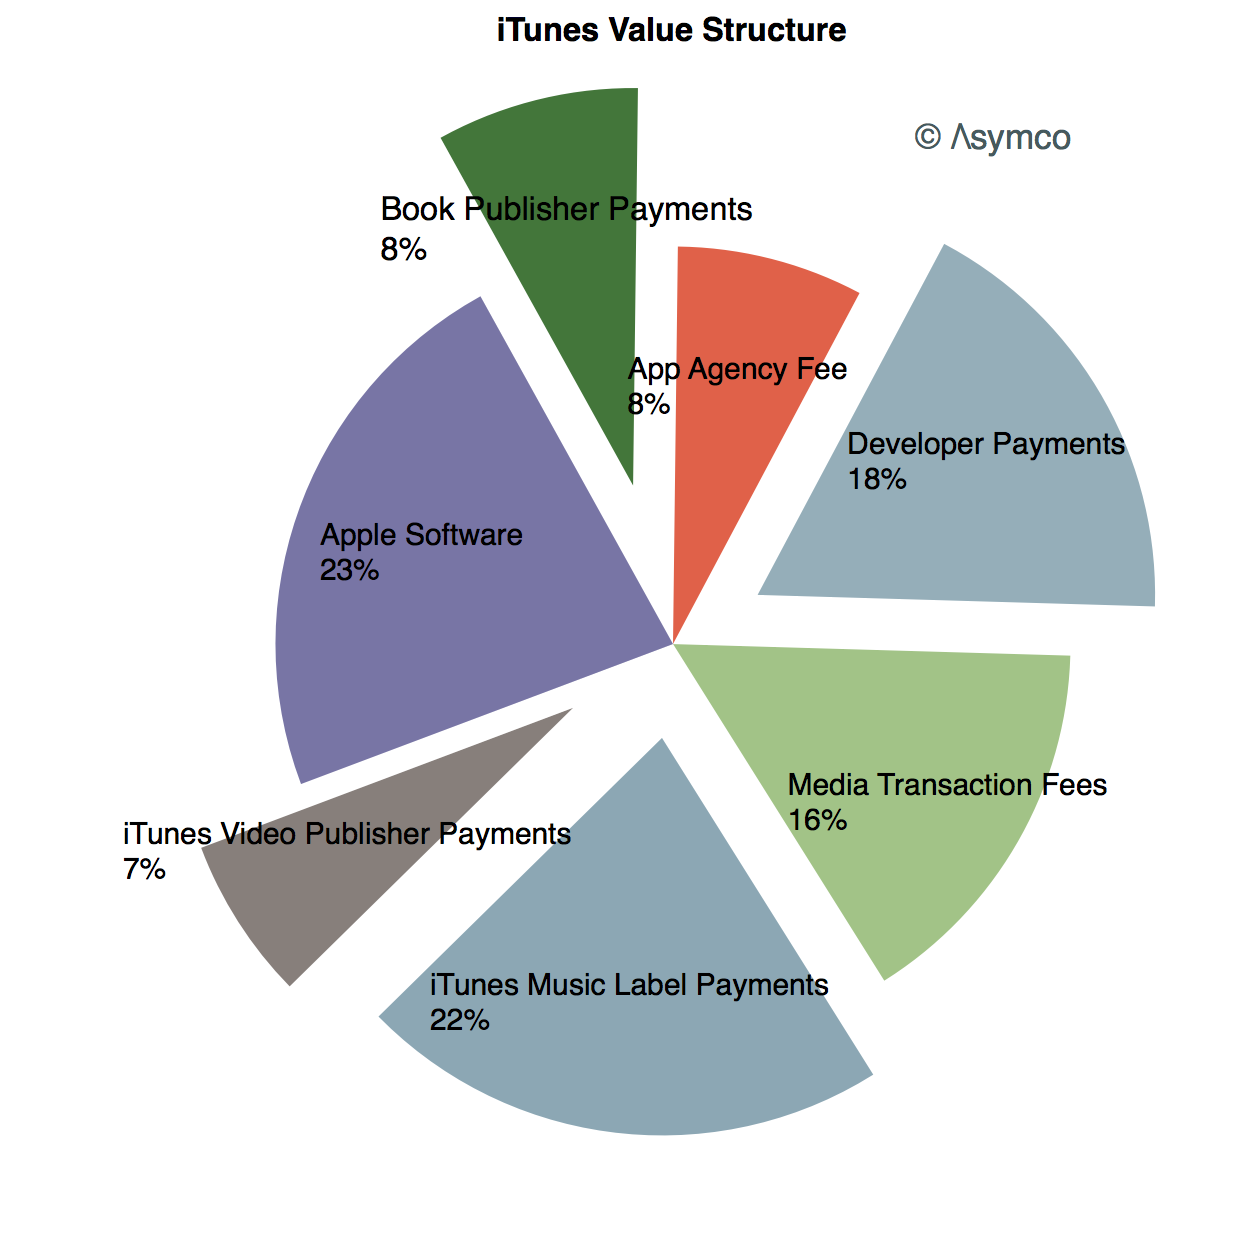
    In terms of percent of total value the components are:

    Screen Shot 2013-02-26 at 2-26-6.09.12 PM

    Looking at growth, these estimates imply that App revenues are growing at about 50% while iTunes Music is at 10% and Video+other at 90%.

    Looking at profitability, there is potential for operating margin in Apple Software and App Agency Fees and perhaps some of the Media Transaction Fees (exploded wedges above). Historically, Apple suggested that their App and Media stores ran at break-even but that may no longer be the case. Operating margins from Software may be significant.

    ---

    Notes:

    1. These revenues were from recorded music and don't include live performance
    2. My estimate for the iTunes Music payments to publishers is equivalent to about 60% of total industry revenues.
  4. Right on Cue

    Research · 27 comments

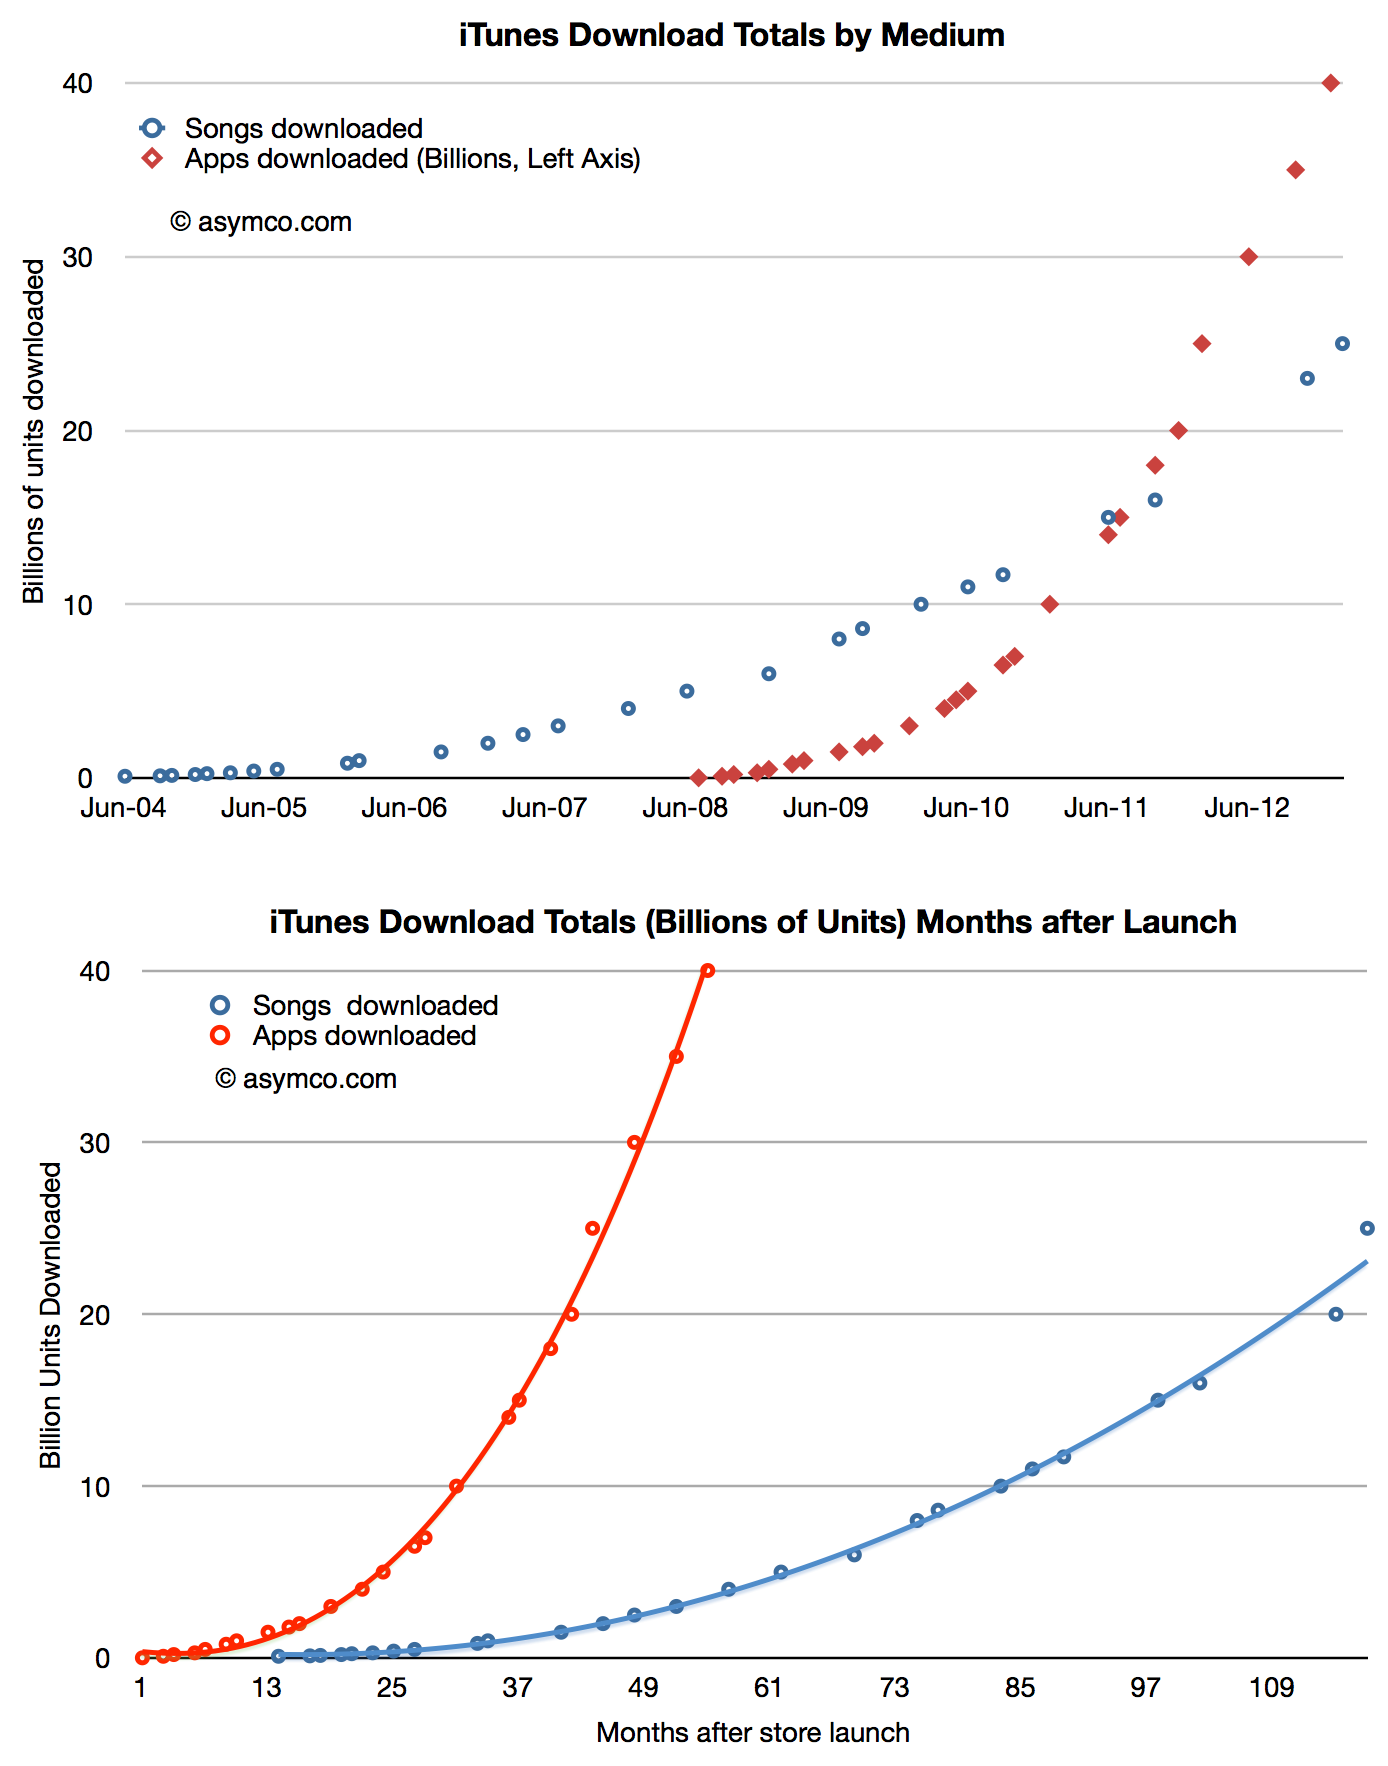
    On February 6th, 2013 Apple reported that a total of 25 billion songs had been downloaded from its iTunes music store. The previous definitive value was in October 2011 though there was mention of "more than 20 billion" in November. App download totals have recently been much more frequently updated as the following chart shows:

    Screen Shot 2013-02-12 at 2-12-2.17.06 PM

    [I estimated 21 billion for the November total.]

    The latest two data points point to a surge in iTunes song download rates. Prior to last fall the download rate seemed to be hovering around 10 million songs per day.

    Screen Shot 2013-02-12 at 2-12-2.20.10 PM

    The new data implies that the rate may be now perhaps 20 million per day however I would be cautious about this estimate given the latest point being such an outlier. One reason for the surge might be the opening of new stores in previously unserved countries. Another could be the usual post-holiday surge driven by gift cards.

    Given this data, it would be interesting to calculate the share of overall music downloads that iTunes has been able to secure.

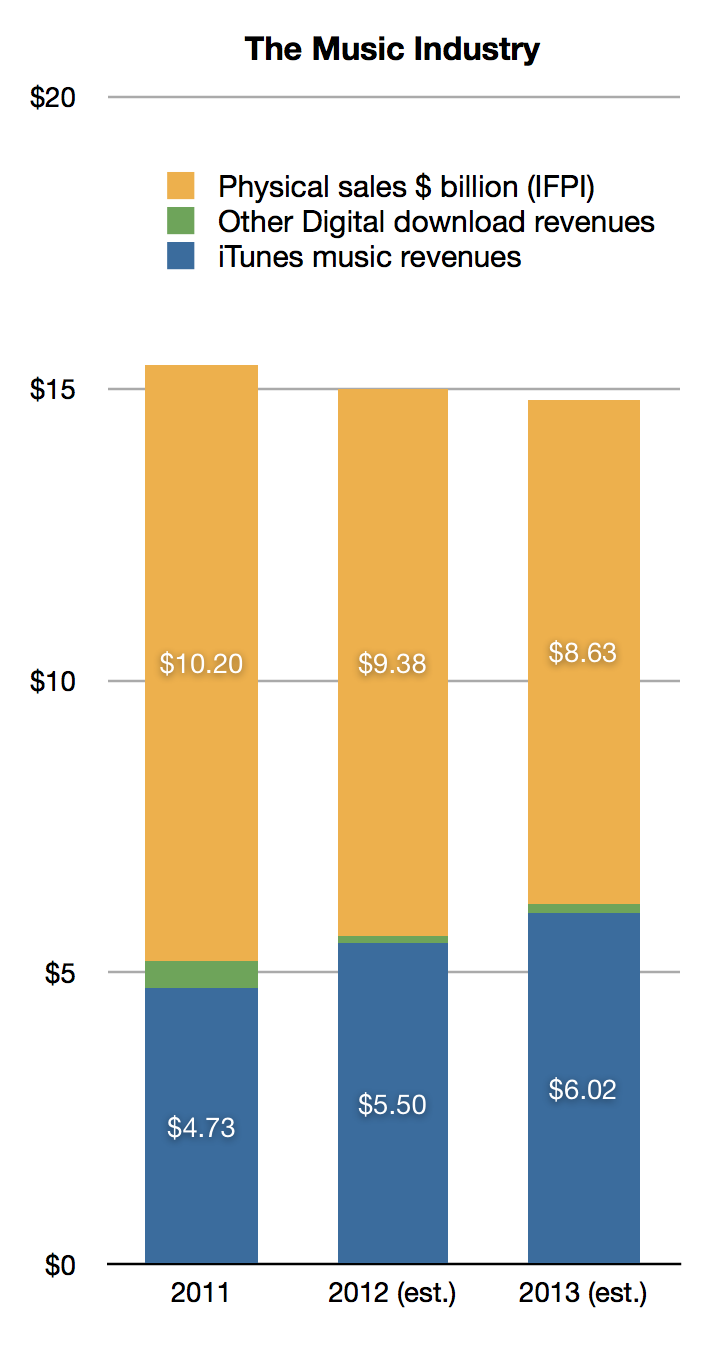
    Based on the samples offered by Apple, and the data from International Federation of the Phonographic Industry (IFPI) we can estimate that in 2011 iTunes captured 90% of digital music revenues and 31% of the total music industry. (I estimate iTunes was responsible for about 4.3 billion downloads and I applied a price per download of $1.1).

    Looking to 2012, applying a growth rate of 8% to digital sales (same as that of 2011) and an 8% decline in the physical business (vs. 8.7% decline for 2011) we get 98% iTunes share for digital and 37% share for all music. (I estimate that iTunes was responsible for about 5 billion downloads and I applied a price per download of $1.1).

    Therefore it seems reasonable to estimate that Apple will reach 97% share for iTunes music in 2013. That assumes a 10% growth in the music download business and translates into 5.5 billion downloads or about 15 million songs per day. That's well within the trajectory seen above.

    These data result in the following market overview:

    Screen Shot 2013-02-12 at 2-12-2.21.25 PM
  5. Counting stool legs

    Research · 140 comments

    As Apple introduced a new set of revenue categories, the performance of its "minor" businesses has become clearer. The changes include re-statement of what used to be called "Software" revenues as part of iTunes. Apple Software includes sales of OS X, iWork and its pro tools. These products are now sold through the Mac App and since that is a part of iTunes its inclusion makes sense.

    However, we have to understand that iTunes now is a blend of many business models. Some, like music, use a wholesale revenue recognition method and have very low to zero margins, others, like eBooks and Apps, are sold using an "agency" revenue model with potentially higher margins and some, like Software, are recognized at full value with very high margins.

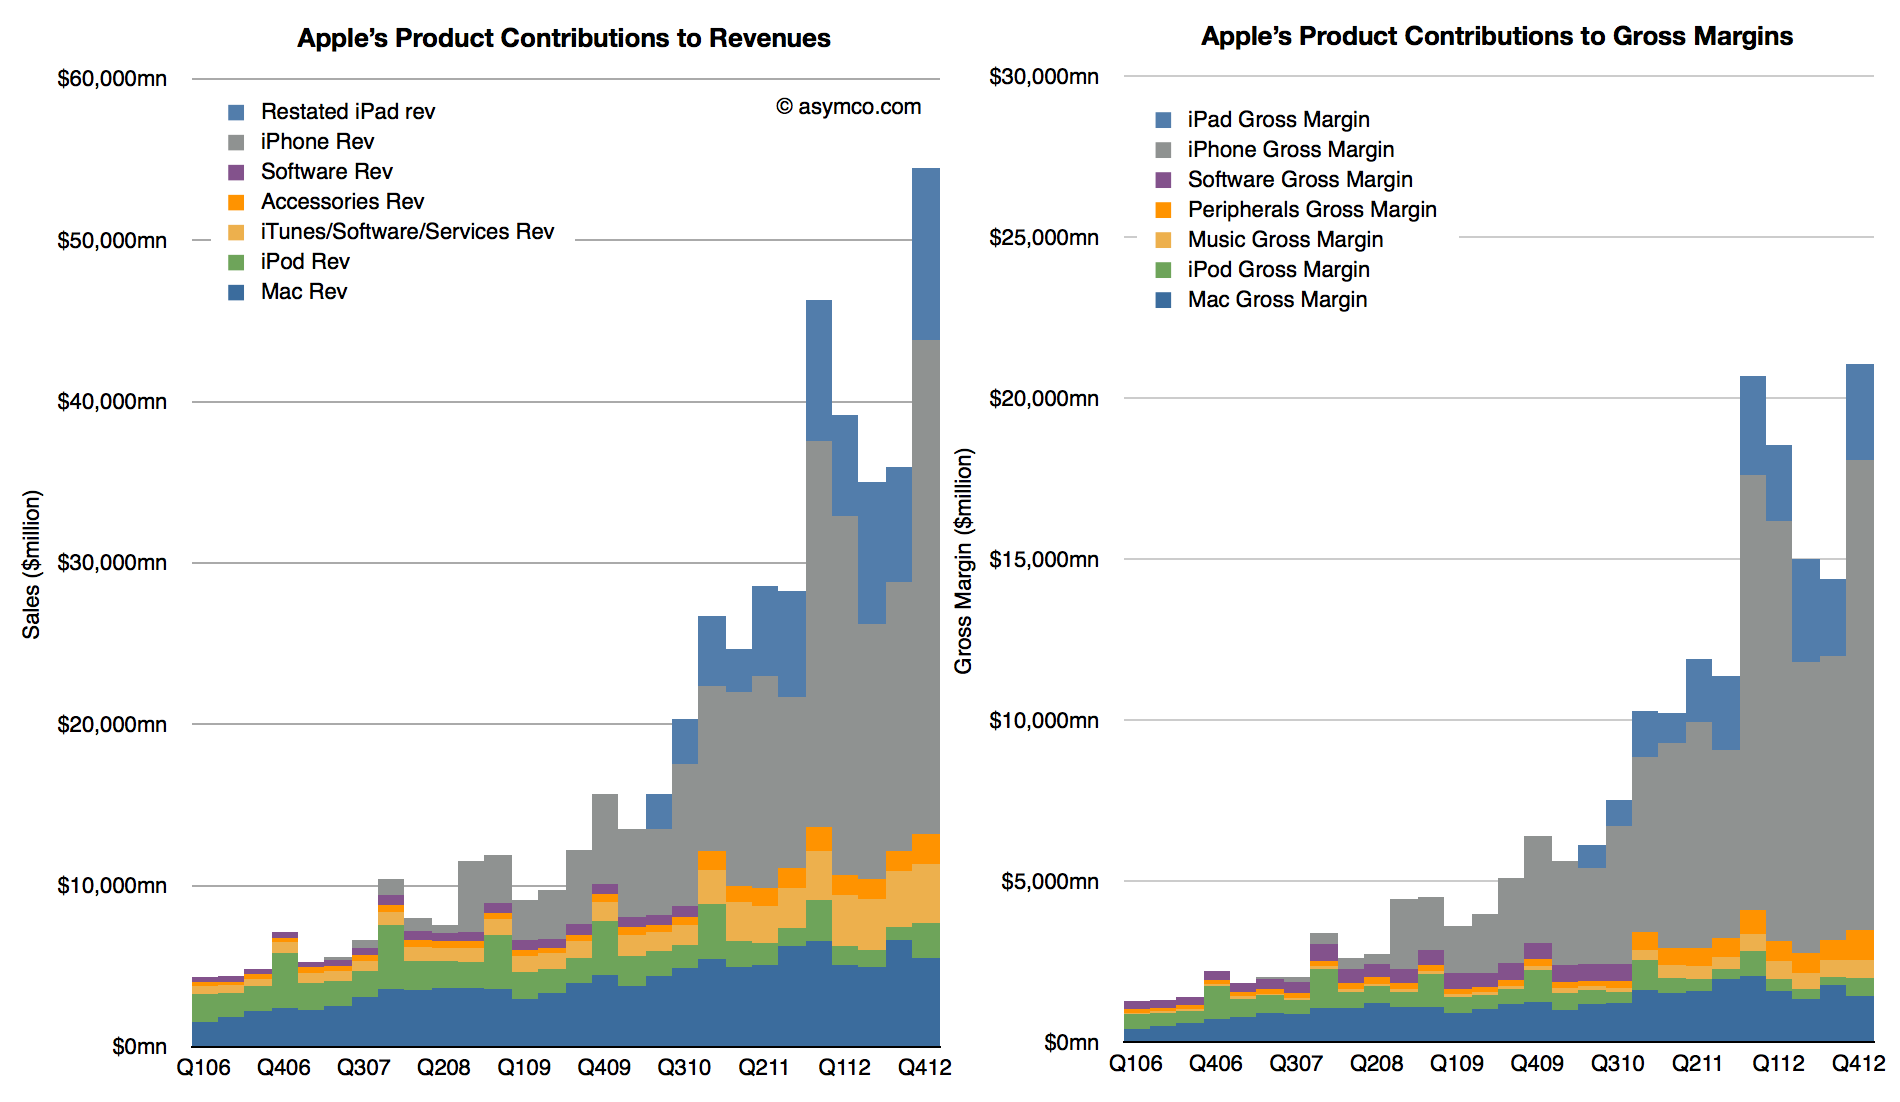
    When re-stated this way, iTunes becomes much more than a "break-even" business. My own estimate for its gross margin as currently reported is between 15% and 17% but it could be even higher. This allows the following picture to emerge:

    Screen Shot 2013-02-11 at 2-11-12.06.08 PM

    These graphs show contributions to Revenue and Gross Margins of the various reported product categories. Note that restatements for Accessories and iTunes only extend back to Q4 2010 and the older "Software" is still shown for earlier periods.

    Note also that Accessories are now including some of the revenue that used to be reported as part of iPad and iPhone revenues. This was discussed in more detail here.

    There are several observations we can make:

    1. iTunes now becomes a steadily and rapidly growing business. Growth over the previous two years averages well over 30% and is consistent across seasons.
    2. The absolute revenue number is substantial: $13.5 billion for 2012 (up from $10.2 billion in 2011).
    3. Assuming a gross margin of 15% to 17% yields contribution of $2 billion in margin in 2012 and $1.6 the year before.
    4. iTunes is now Apple's fourth largest business, having overtaken the iPod in revenues two years ago
    5. iTunes growth relative to the Mac means that it could become the third largest business during this year.

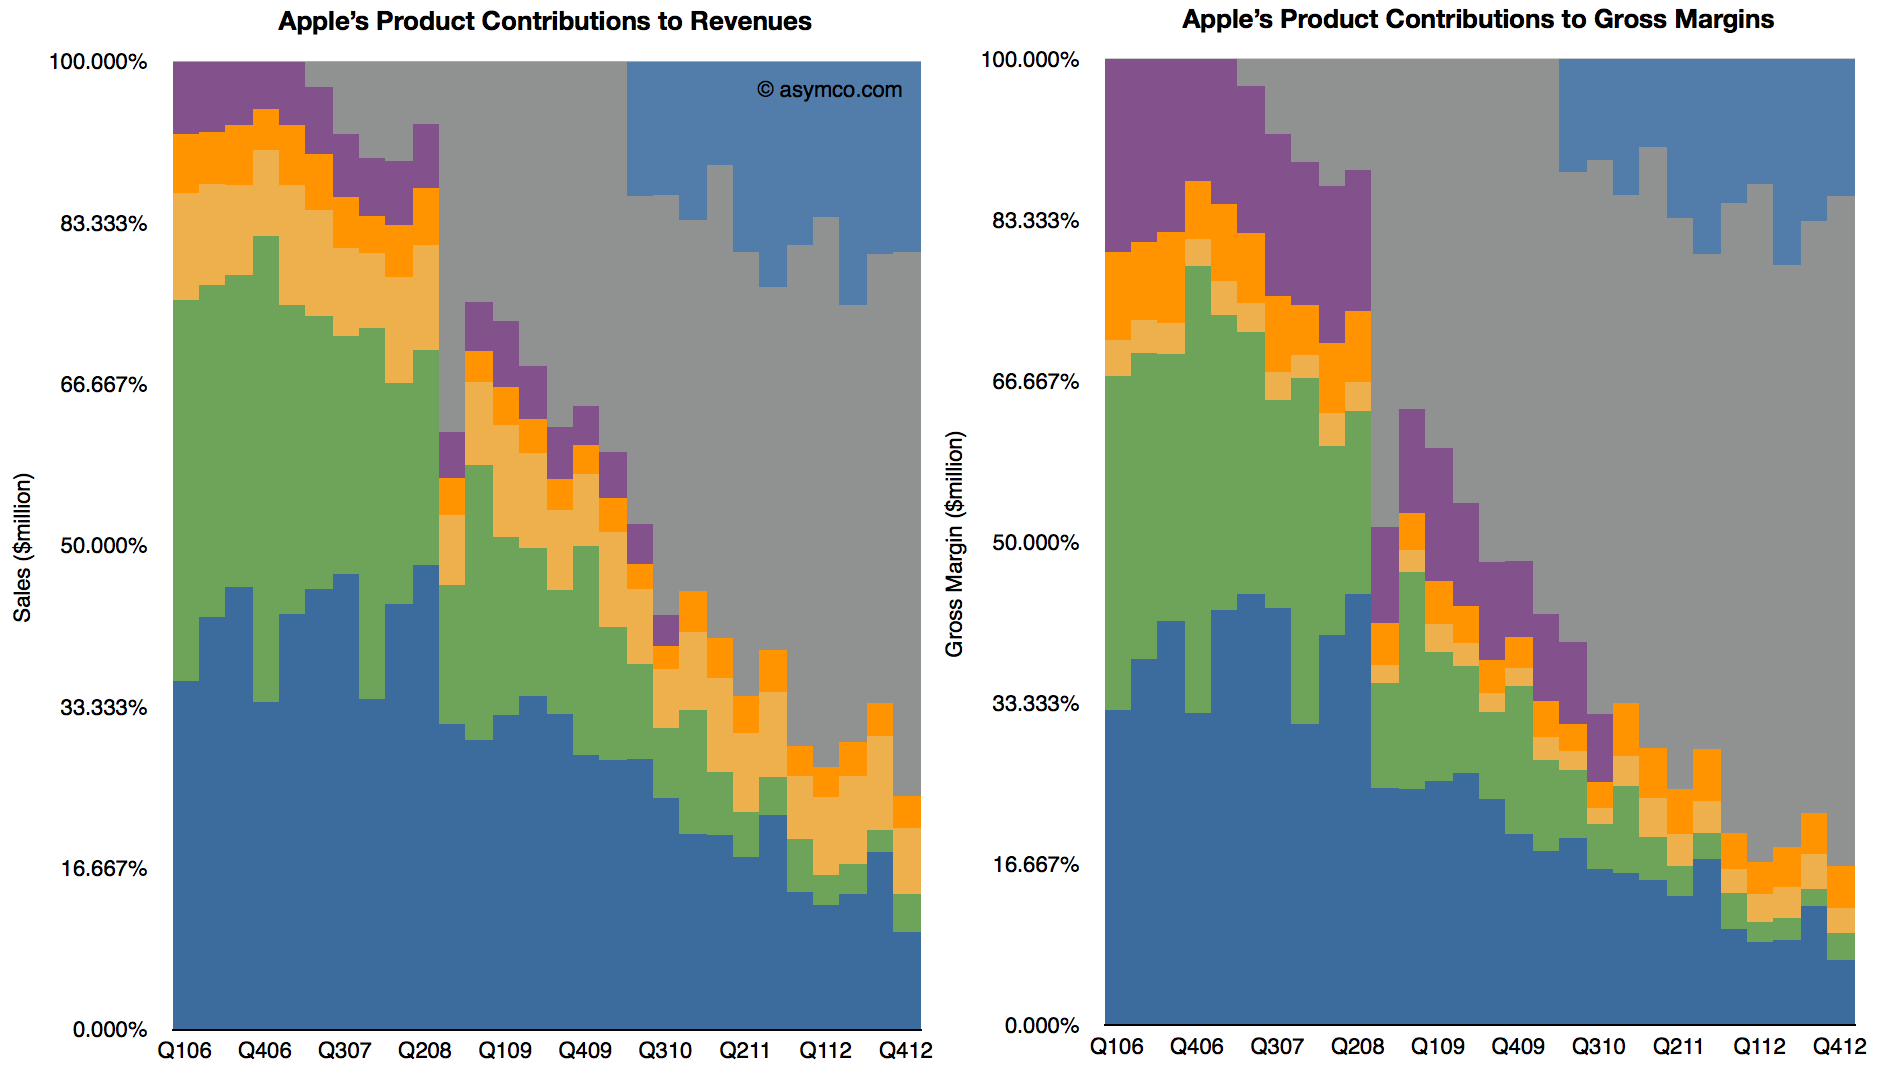
    When seen this way, as a percent of total, iTunes begins to look increasingly as a viable "leg stool" upon which Apple rests. Note that in the following charts the percent of total for iTunes holds steady while Mac and iPod decline.

    Screen Shot 2013-02-11 at 2-11-12.24.44 PM

    Adding the Accessories business (which includes Apple TV and is showing in Orange above) these "other" businesses are already bigger than the Mac. Of course, content, software, accessories and services depend on a healthy device business, but the size of these ancillaries are beginning to be substantial and Apple's ecosystem may begin to be valued more than just as an incentive to buy the devices.

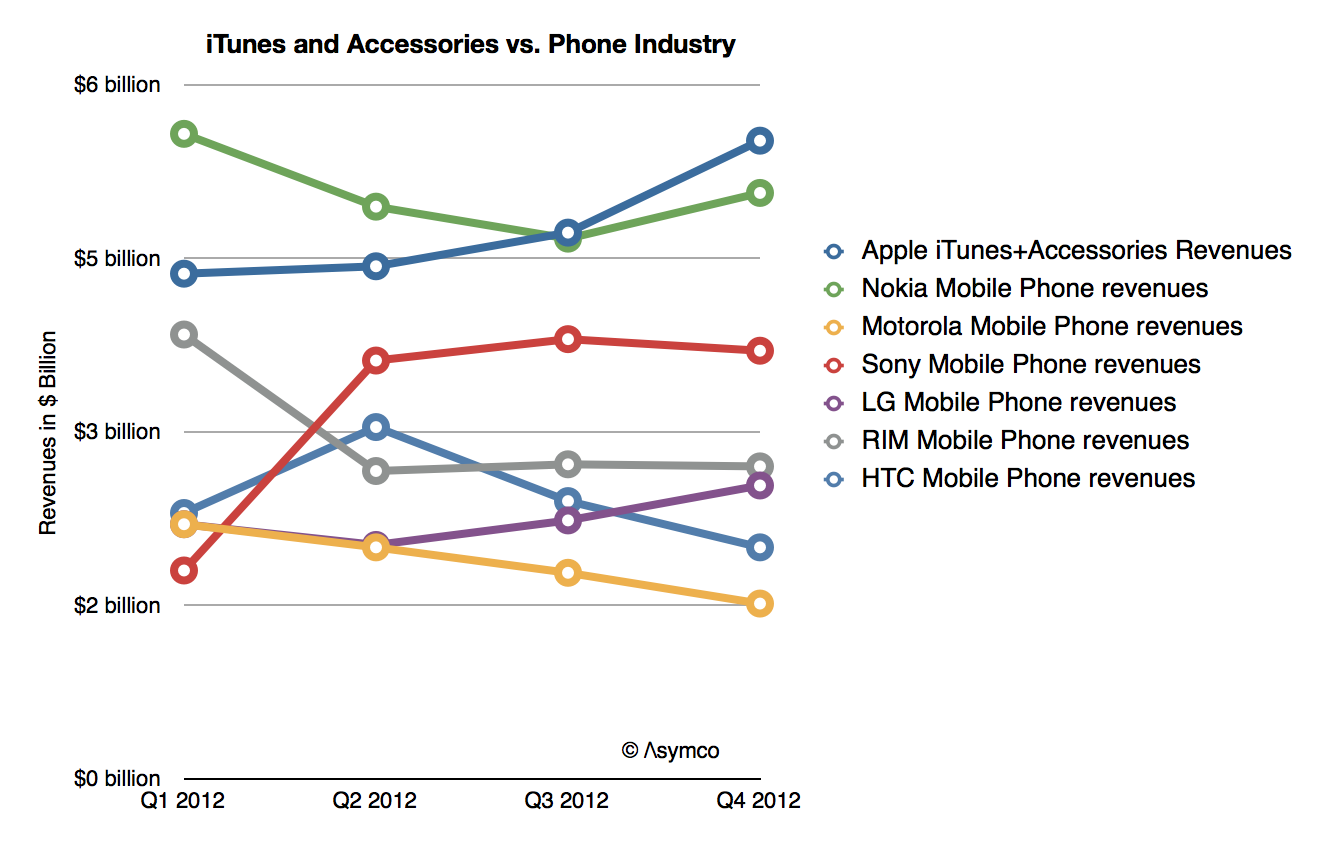
    Indeed, if seen in isolation, iTunes+Accessories combined is a bigger business in terms of revenues than any of the other phone vendors except Samsung:

    Screen Shot 2013-02-11 at 2-11-12.36.14 PM


  6. Apple's Calendar Fourth Quarter 2012 Growth Scorecard

    Research · 20 comments

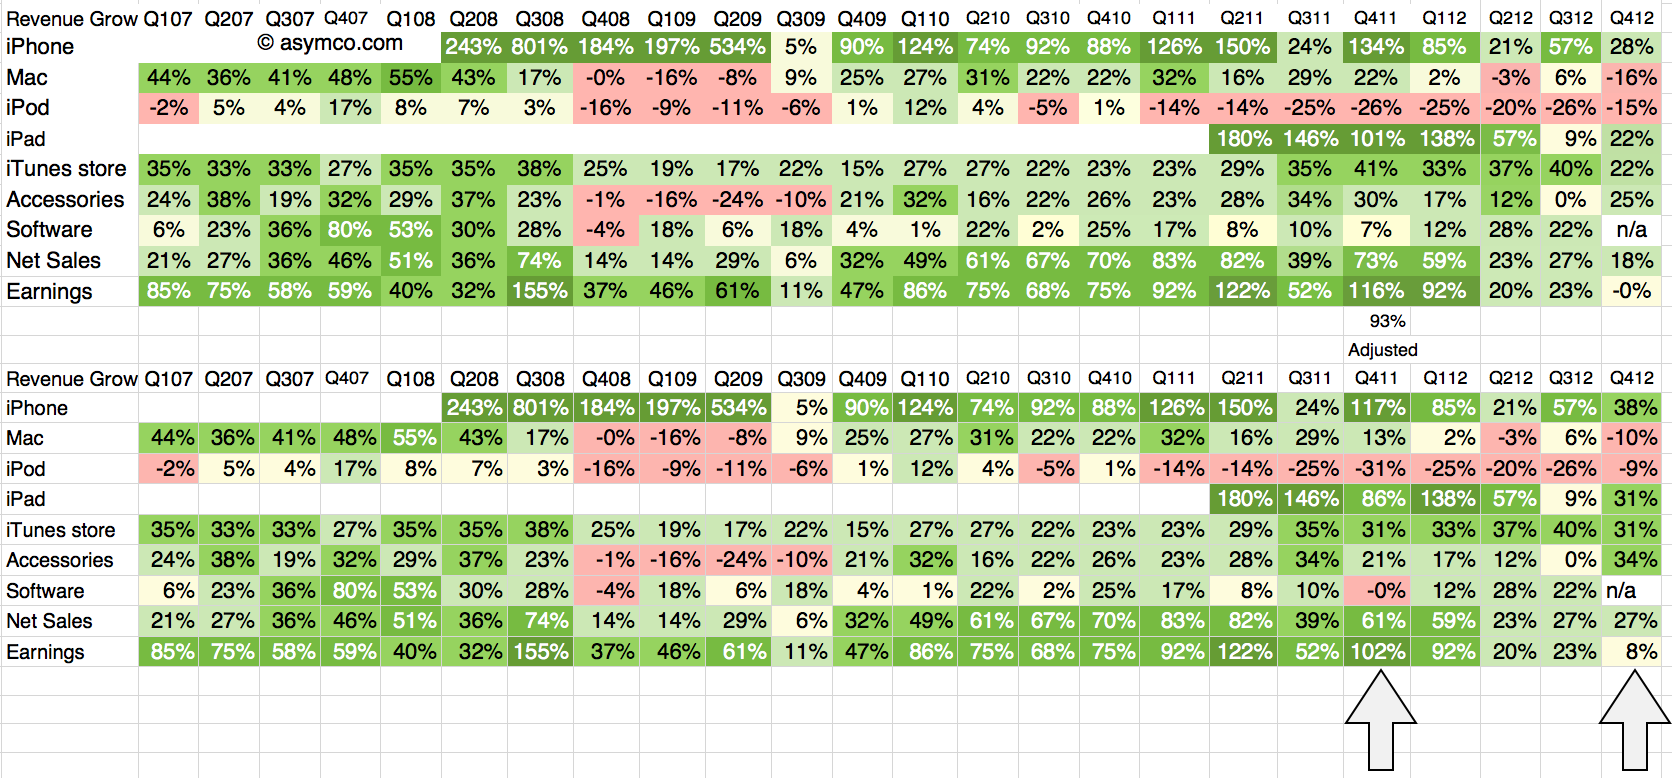
    The fourth quarter of 2012 was 13 weeks in duration while the fourth quarter of 2011 was 14 weeks. The difference implies that a comparison of revenues should be done with an adjusted 93% of the 2011 values. The growth for 4Q 2011 relative to 4Q 2010 should also be adjusted on this basis.

    The following tables show the unadjusted and adjusted growth rates. The adjustments apply to the bottom table and the columns highlighted.

    Screen Shot 2013-02-04 at 2-4-7.19.18 PM

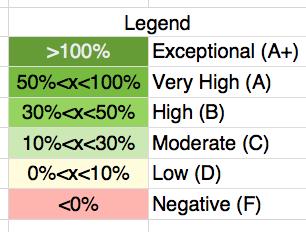
    As in previous scorecards, I used the following color scheme to "grade" the performance.

    Screen Shot 2013-02-04 at 2-4-12.14.53 PM

    The adjustment brings growth in sales to a respectable 27%, well above the 18% unadjusted level. In fact, using the color map grading system four lines increase their rating from "Moderate" to "High" growth: iPhone, iPad, iTunes, Accessories all move from the 20's to 30's  percent growth.

    The bottom line moves from 0% to 8% growth but it's still low relative to historic performance. That had to do with margins; more about that later.

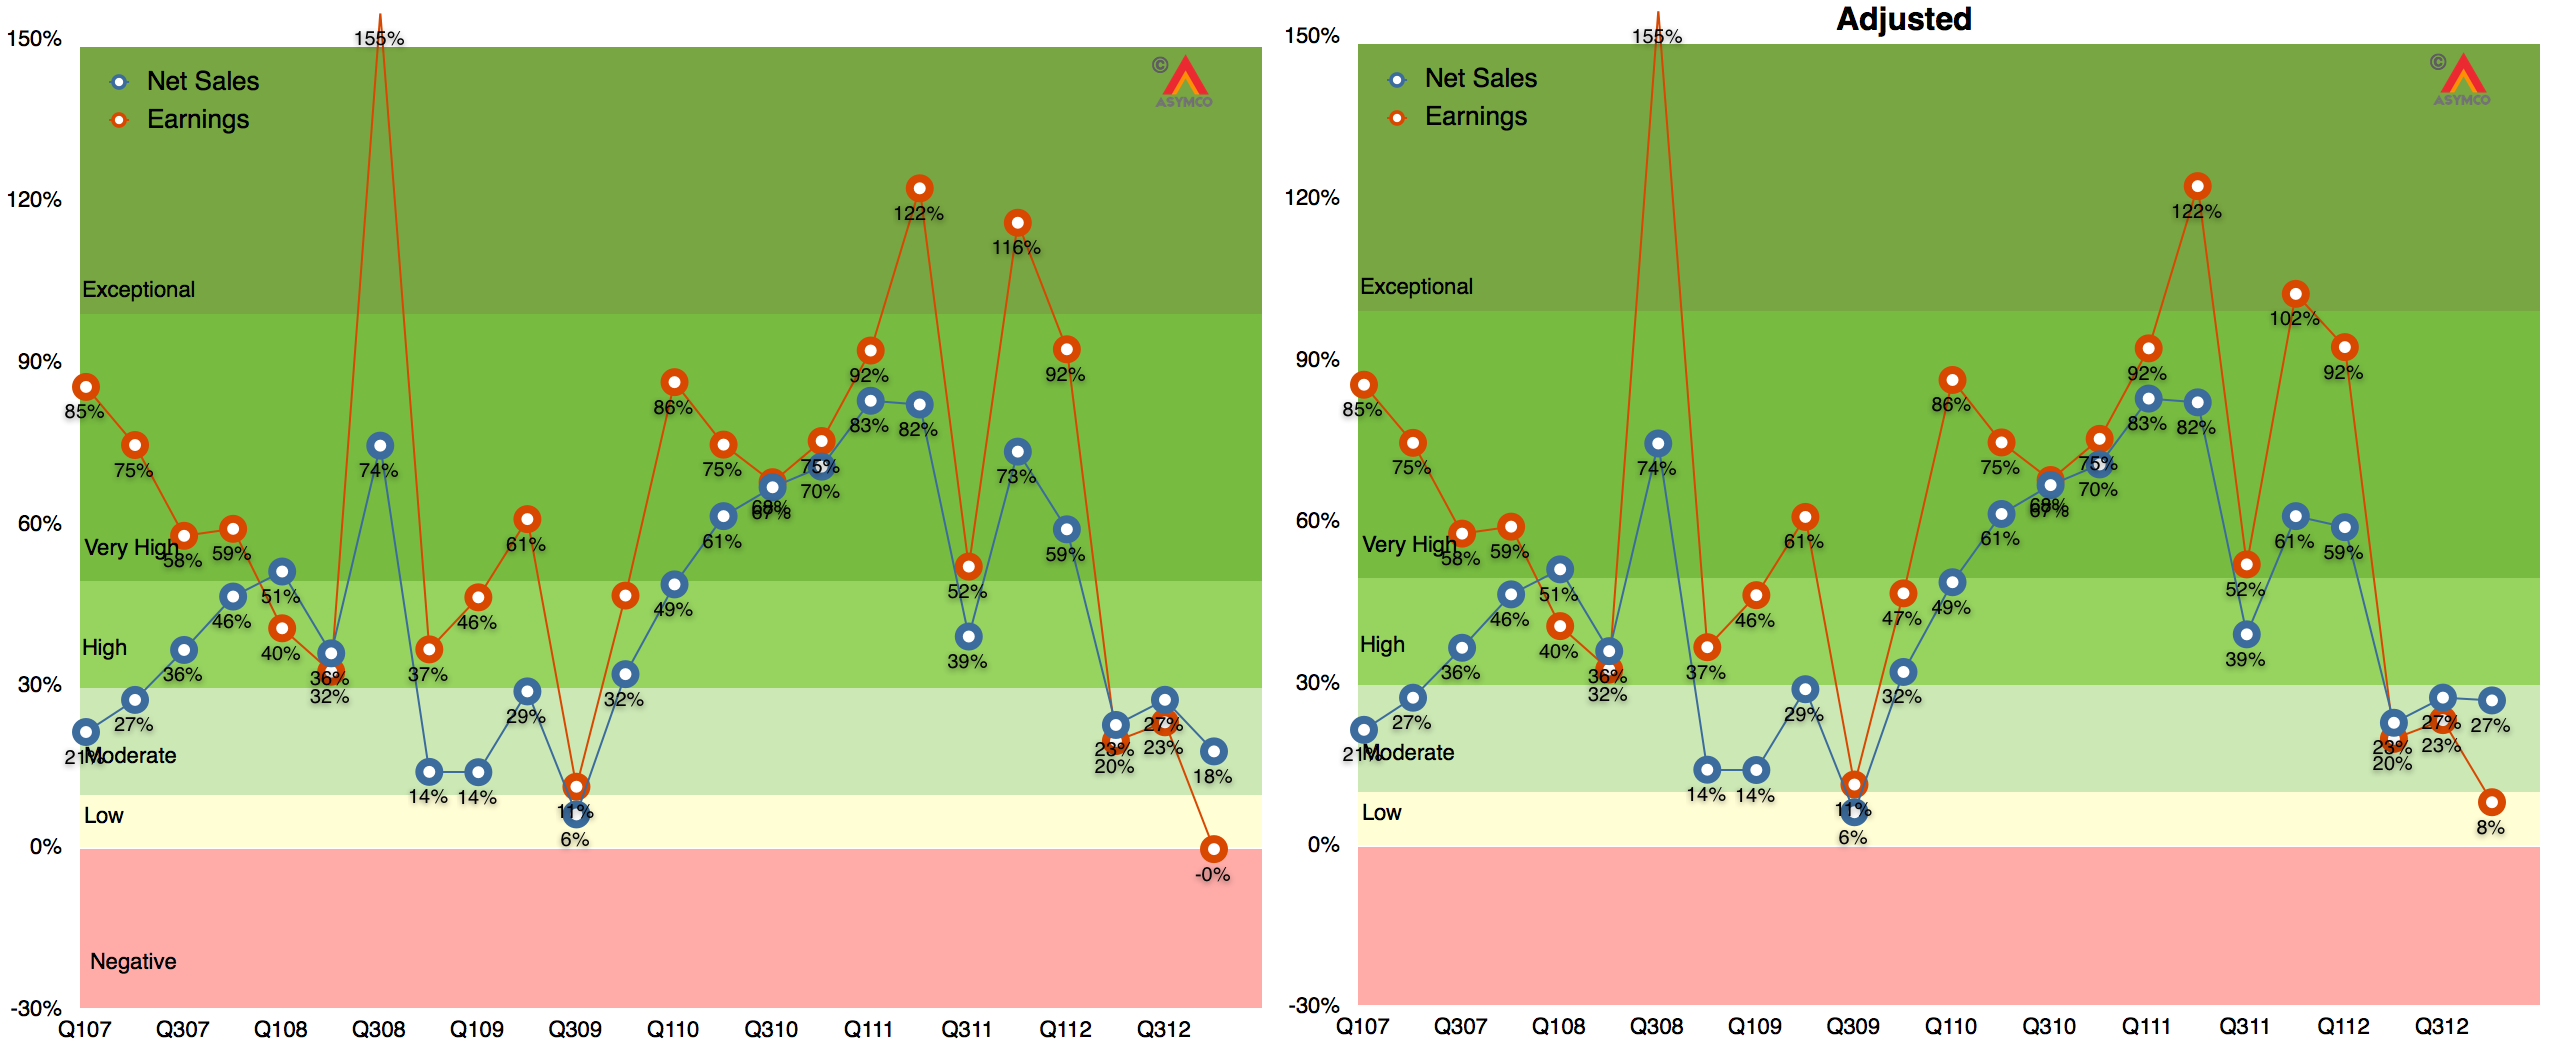
    The graphs showing Revenue and Earnings growth with and without adjustments are shown below:

    Screen Shot 2013-02-04 at 2-4-7.21.34 PM

    Note that iPad, iPhone, Accessories and iTunes/Software are based on re-stated figures.

    Note also that the adjusted 2011 growth rates do not change dramatically with only iPad changing from Exceptional to Very High.

  7. A more complete picture of the iTunes economy

    Research · 59 comments

    As it did yesterday, on occasion Apple reports the cumulative total downloads and payments to developers. Since this is done in variable time intervals, it makes analysis of the value of the app store difficult.

    But not impossible.

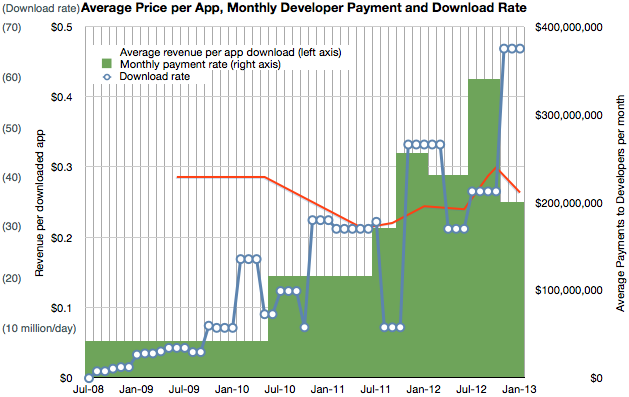
    The provision of developer revenues means we can determine the pricing of apps. The pricing of apps and the download totals allows us to determine the revenue of the store. Using the time stamps of the reports allows us to determine these quantities over time.

    I've combined the data we have so far into the following graph.

    Screen Shot 2013-01-09 at 1-9-3.17.11 PM

    It shows three quantities (on three separate scales) at a monthly resolution:

    1. Download rate (in millions/day, interpolated from download totals)
    2. Payment rate to developers (reported change in payment to developers/reported time interval)
    3. Resulting revenue per download (in red, trailing average over a 10 month period)

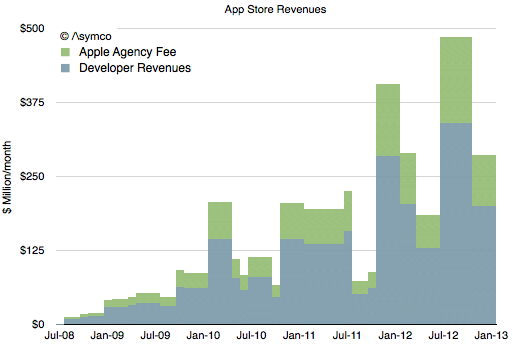
    Having a price and quantity of app downloads allows for a complete picture of App Store revenues over time, shown below:

    Screen Shot 2013-01-09 at 1-9-3.22.02 PM

    Note that I've separated the developer revenues from Apple's own revenues. The blue area should total cumulative developer payments (to a degree of error.)

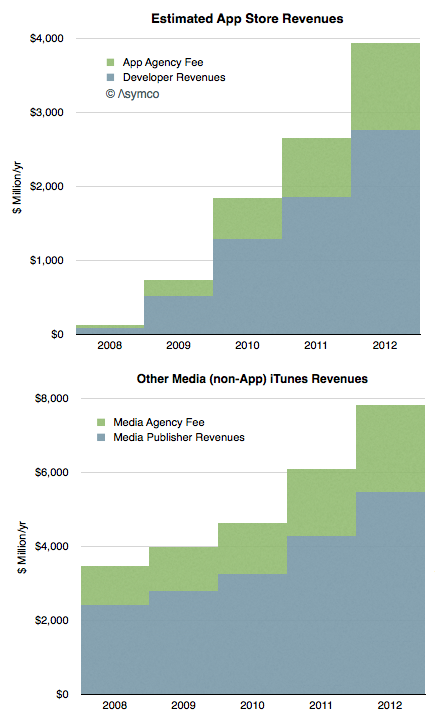
    The green area above is what Apple includes in its financial reports as part of "Music" revenues. If we annualize these App Store revenues we can strip them out and show them separately from "other media" revenues.

    Screen Shot 2013-01-09 at 1-9-3.25.04 PM

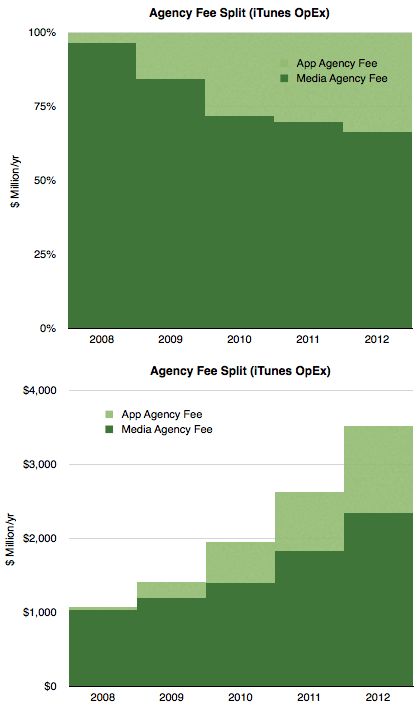
    Concentrating on the green areas which represent what Apple "keeps" we see the following split:

    Screen Shot 2013-01-09 at 1-9-3.28.55 PM

    Considering that Apple reports the iTunes store to being "slightly above break-even" then we can summarize the chart above as the operating expenses for the store.

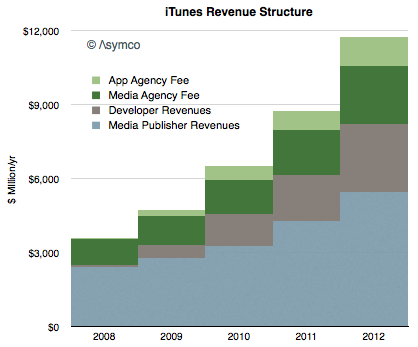
    Finally, taking into account all the information above we can draw a complete picture of how revenues flow through the App Store:

    Screen Shot 2013-01-09 at 1-9-3.34.23 PM


    Here are some conclusions:

    • The iTunes economy defined as gross revenues transacted through it is now about $12 billion/yr.
    • Over the last five years content owners (media and app) received a total of $24 billion while Apple spent about $10 billion to create those sales
    • Seen as a retail business, iTunes costs about $3.5 billion/yr to operate. This includes merchandising, payment processing and "shipping & handling".
    • Total revenues have risen steadily in a range of 32 to 38% compounded over the last 4 years.
    • Apps are now a third of all iTunes revenues, (about $4 billion/yr) having taken that share in only 4.5 years.
    • Non-app media still make up 2/3 of iTunes in terms of sales value but their growth is now 28% vs. about 50% for apps.
  8. Projecting iOS devices sales through iTunes account growth

    Research · 16 comments

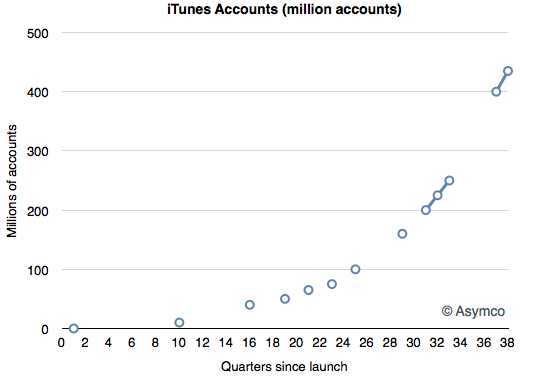
    During the iPhone 5 launch event, Apple announced 435 million iTunes accounts (with credit card numbers) with one click shopping.

    The account total is updated occasionally by Apple and the history of these updates is shown below:

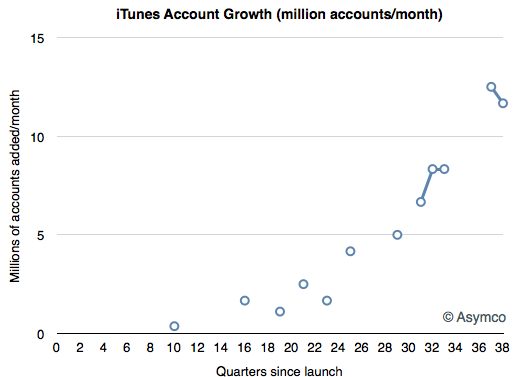
    Measuring the growth in accounts shows steady acceleration.

    The current rate is approximately 12 million new accounts per month.

    The growth in iTunes accounts mirrors the growth in iOS usage as shown the following chart:

    The alignment between the circles and the red line should offer an alternative method of projecting the platform's growth.

    Projecting the growth forward would imply one billion accounts in another two years. As iPhone and iPads growth increasingly converges with iTunes (of which there are 400 million units sold), the same time frame could apply to iOS cumulative sales.

    This is not a very precise forecast, but late 2014 to early 2015 could see one iOS billion units sold.

  9. A more precise measure of Apple's device installed base (and device longevity)

    Research · 43 comments

    Apple announced that the total number of iTunes account (with credit cards attached) has reached 400 million. This was touted as being the largest collection of credit card accounts for any retailer and I have no reason to doubt it. However, looking beyond the bragging rights, there are more interesting patterns to observe about this asset.

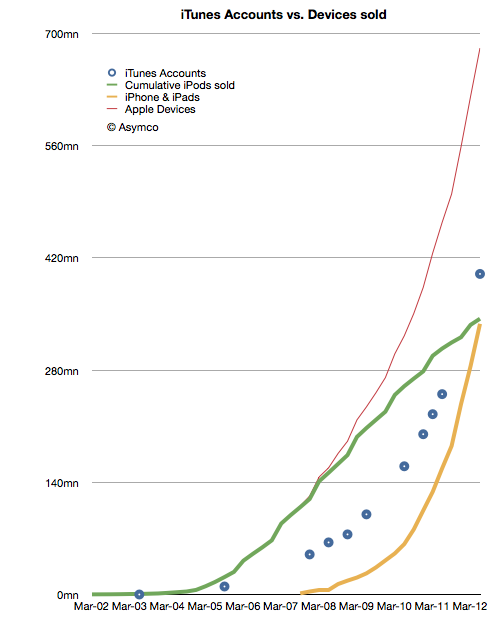
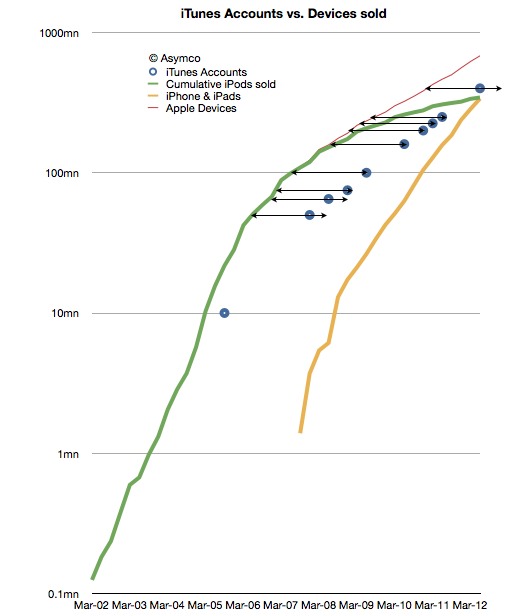
    What I plotted was the cumulative number of iPods sold (green), the cumulative number of iPhones and iPads (yellow), the combined devices total (red) and the reported number of iTunes accounts (blue).

    The first observation is that the combined total iPhones + iPads have overtaken cumulative total iPods. The iPhone started in Mid '07, more than five years after the first iPod shipped. The acceleration in that product line is still evident while the iPod decelerates gracefully.

    The second observation is that the total device count has reached 680 million in the last decade. It's a big number but it is still a number that is dwarfed by the overall device market. Apple is still around 10% of the devices market today. It should give an idea of how many devices could still be sold in the next decade.

    The third observation is the ratio between the iTunes accounts and the total devices sold. Since iPods, iPhone and iPads have been dependent on iTunes, the number of iTunes accounts gives a rough indication of active users. Combining active users with total devices sold should give a rough estimate of the number of retired devices. In other words, if we assume that account holders typically use one device then by taking the difference between devices sold to date and accounts at that point in time we should know how many devices have been retired.

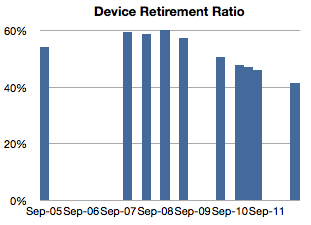
    Dividing that number of retired devices by devices in use should give us the retirement rate and that is shown in the following chart:

    Note that as the iPod was slowing and the iPhone was still a small part of the total, the retirement ratio was increasing. As the iPhone accelerated, the ratio began decreasing and is still decreasing.

    Projecting the retirement rate should give us a way of more precisely estimating  the addressable market for developers, accessories makers, and other ecosystem participants.  Currently that means that about 60% of all Apple's devices sold are still in use. We can tune that figure upward in the next few quarters and make better estimates as Apple releases their shipment data.

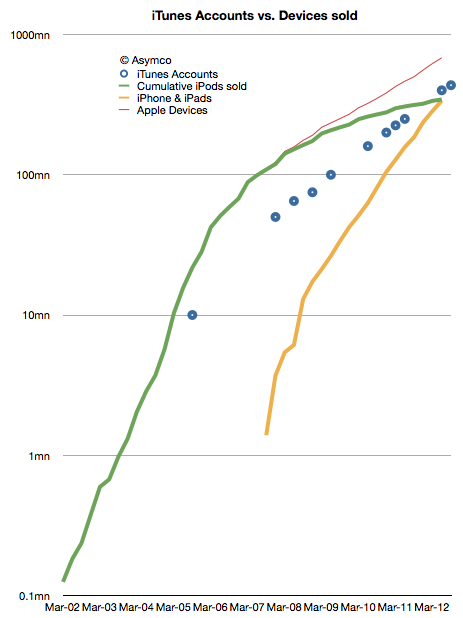
    The iTunes account data is not just a way to calibrate addressable markets but also a valuable method for measuring device longevity. The distance between the red line and the blue happens to be nearly a constant 8 quarters as shown in the following chart (note change to log scale for the vertical axis).

  10. The iOS App market sales run rate is $4 billion per year

    Research · 54 comments

    At the 2012 WWDC, Apple released new data concerning its App ecosystem. Namely:

    1. 30 billion apps downloaded to date (excluding updates)
    2. $5 billion paid to app developers
    3. 400 million iTunes accounts

    These three data points allow us to update our picture of the app economy. First, the app download rate.

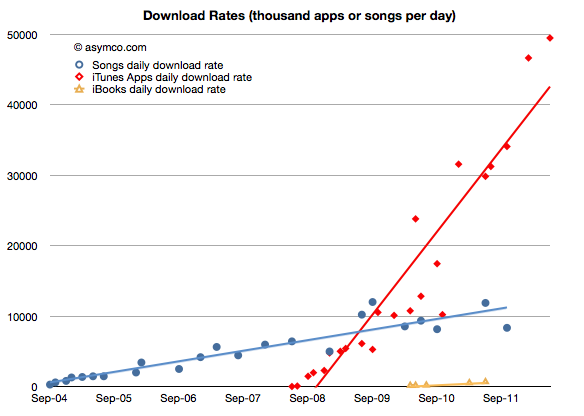
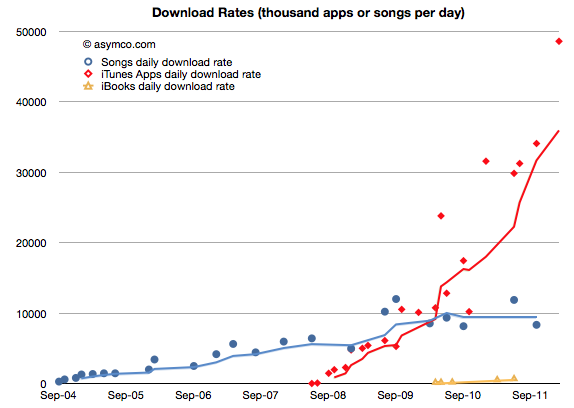
    As would be expected from an expanding user base, the app download rate has been increasing. It is now at about 49.5 million apps downloaded every day. The history of this rate is shown in the chart below:

    I added the same data for iTunes songs and book downloads for comparison. Note that although music and books are available to the same user base (actually higher due to Macs and iPods which do not run apps,) apps are being downloaded at a far faster rate--at least four times faster.

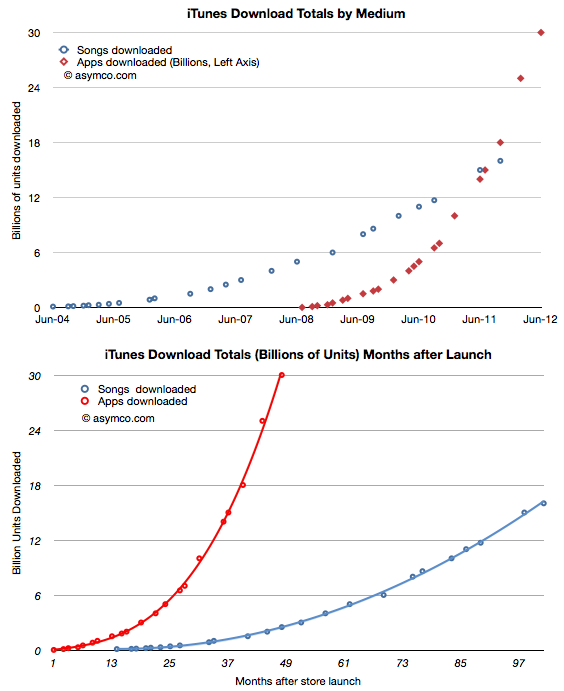
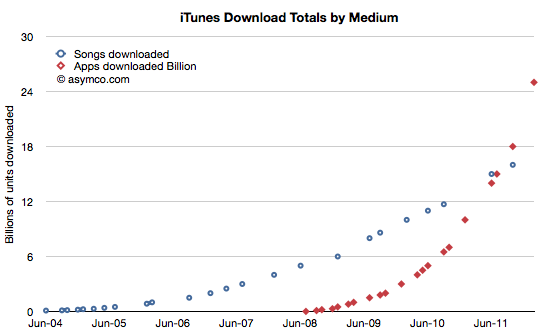
    In terms of total, cumulative downloads, the comparison is even more stark:

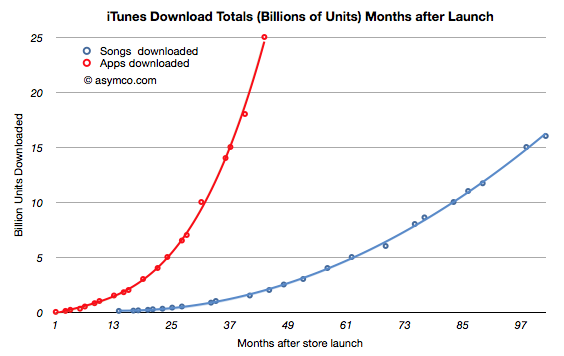
    It won't be long before total app downloads will be double total song downloads. Put another way, in the time it took the App store to reach 30 billion, the song store sold only 3 billion.

    On average, songs are more expensive than apps ($1.29 vs. $0.24). What is the difference in value, not just units?

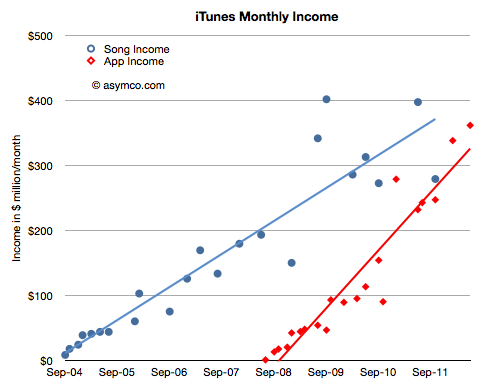
    The data shows that apps have very likely overtaken songs as "gross" income. Apple does not book all app income, only the 30% share they keep, but in terms of transaction value, clearly apps are now a bigger business.

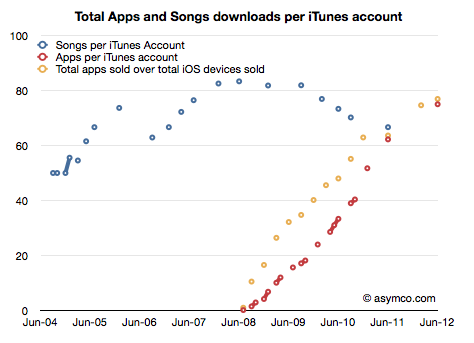
    What about consumption? Are individual iTunes account holders buying a constant or variable number of songs or apps?

    Here again apps show a distinctive pattern of out-performing songs. As far as digital media is concerned, apps are taking the download business by storm.

    What about pricing? Is the expansion of the user base into the hundreds of millions leading to a collapse in app pricing?

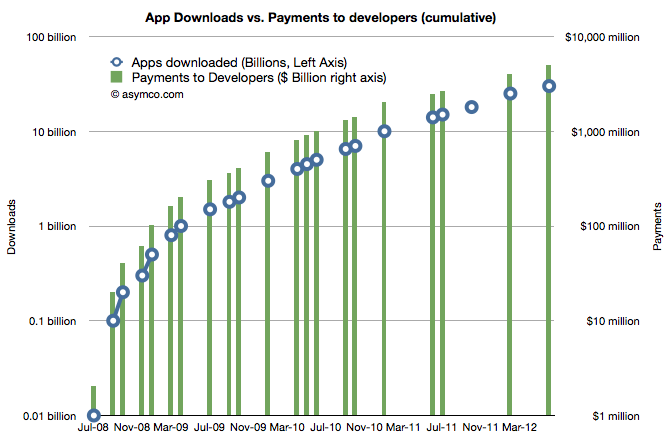
    No. You can see the price as the ratio between the downloads and the revenue to developers. If downloads scale more rapidly than payments then pricing is decreasing. As it turns out the average price of an app has held steady since approximately 1 billion downloads were recorded. That price is now about 24 cents per app (including free).

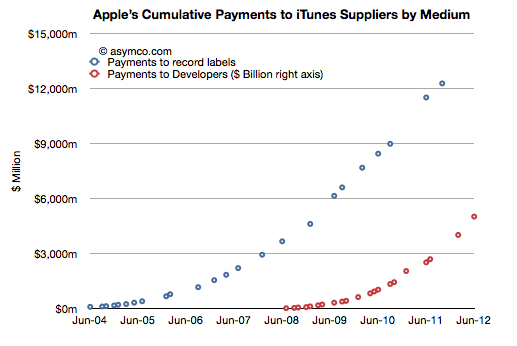
    Finally, how about the content owners? Are payments to the owners of the media beginning to favor developers over music publishers/promoters?

    Developers still have a long way to go. We can't be sure about how revenues are shared with music labels, but it's probable that they are still receiving bigger checks than developers. However, under some scenarios this will change quite soon.

    The bigger story here is that the iOS app economy has reached a run rate of $4.3 billion per year from a standing start four years ago.

    How big will the TV app economy be four years from the launch of an Apple smart TV?

  11. App developers receive $12 for each iOS device sold

    Research · 38 comments

    One of the more interesting numbers reported by Tim Cook during the last earnings conference call was the total payment to developers during the fourth quarter. This is the first time that Apple reported a quarterly payout to developers.

    The figure was $700 million and it was mentioned in reference to the total payments to date of $4 billion. The $700 million is interesting at least because it gives an idea of what Apple obtained in total sales of Apps. As it retains 30% and pays 70% to developers then it follows that it retained $300 million and the total "gross" sales was $1 billion in Q4.[1]

    The $700 million is interesting for another reason. The $1 billion in gross income can be tested against another set of data. As the countdown has already started, sometime in February Apple will report 25 billion total apps downloaded. The last such milestone was October 4th when it reported 18 billion downloads. Assuming that they will cross 25 billion by February 25th, then we can obtain an estimate for the download rate per day: about 48.6 million apps/day.

    That is a figure we can plot historically:

    I plotted it in relation to the songs download rates obtained through a similar method. Although we don't have an update on total songs downloaded, the rate is unlikely to have accelerated as much as apps did. The following charts also shows the reported total downloads by media:

    Normalizing to the same starting date, the two media ramps are shown below:

    But back to the figure of $700 million paid to developers and the implied $1 billion in gross revenues. Taking that figure and dividing it by duration of the quarter yields a figure of $310 million per month gross app revenues. The 25 billion downloads to date paired with the $4 billion in payments to developers gives us an approximate revenue per download of 23c. Computing the monthly revenue from the 48.6 million/month rate we get about $316 million per month. Pretty close to the $301/mo that the quarterly payout implies. This therefore also confirms the 23c per download (it looks a bit high but not by much.)

    So the $700 million payout and the $4 billion payout to date and the 25 billion downloads all fit together as consistent pieces of a puzzle that give insight into the iTunes economy.

    1. Apple reported nearly $7 billion in iTunes stores revenue (though the apps were only counted for the 30% agency fee.) during 2011.
    2. If gross revenues were measured, the iTunes economy was about $10 billion in 2011.
    3. Payments to content publishers were in the vicinity of $7 billion of which $2.1bn was paid to developers.
    4. Operating costs for iTunes were therefore approximately $3 billion/yr.

    One other interesting result: Since iOS devices started shipping, there have been over 335 million units sold. As 25 billion apps have been downloaded into them then about 75 apps were downloaded for each unit sold. Since we know the average price (23c) and the payout ratio (70%) then all this boils down to the fact that each iOS device generates $17 of iTunes income from Apps alone. That also means that each iOS device sold results in a minimum payment of $12 to iOS developers.

    I've noted that Apple should be valued as a recurring payment from a satisfied customer base. A contributor made a comment that summarized it well: the payment schedule is approximately $1/day per computing unit (device or computer or tablet).

    Now it becomes clear that Apple should also be seen as a recurring ecosystem payment system. Given a 24 month lifecycle, the amount is approximately $0.5 per device per month.

    In other words, if you are an iOS developer you should note iOS device sales and use the rule of thumb that each one sold creates fifty cents of monthly income for you and your peers to share.

    ----

    Note:

    1. Apple reported its iTunes income (as the anachronistic "Music" line item in its Income Statement) as $2.027 billion in Q4.It would be tempting then to think that Apple got $1 billion from apps and $1 billion from songs and videos and iBooks. This is not the case however.
      Apple does not report all its app income (what I call gross income). Under the "agency" model of retail sales it reports only the part it retains, keeping the 70% paid to developers off its books. Therefore, of the $2 billion in iTunes income, only $300 million were actually booked from apps. That therefore implies that Apple's "everything-but-apps" iTunes revenue was $1.7 billion.
      Note however that the non-app income is mostly gross income and the payouts on that income will be significant (as much as 90% depending on many factors).