Asymco

Asymmetric Intelligence

iTunes

  1. The TV store

    Research · 74 comments

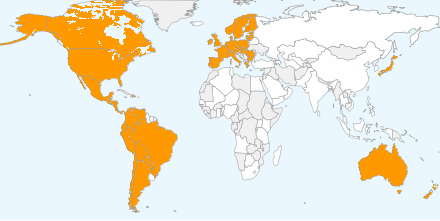
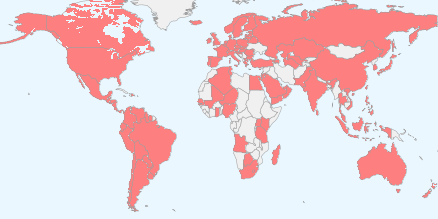
    The following map shows the countries where iTunes Apps are available.

    It represents 123 countries. It also shows where the iPhone is currently available.

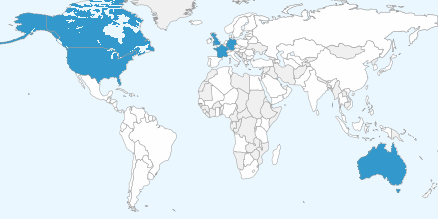
    The following map shows the countries where iTunes music can be purchased.

    The countries in white are countries where apps are available but music isn't. There are 51 countries where you can buy music and 72 where you can buy apps but not music.

    The following map shows the countries where iTunes TV shows can be purchased.

    As in the previous chart, the countries in white are those where apps are available but TV shows aren't. There are six countries where you can buy TV shows and 117 countries where you can buy apps but not music.

    The data is here (along with a widget which lets you generate the maps--if there are errors, please correct them and let me know).

    Digital music (as iTunes defines it) started expanding outside the United States in 2004 and managed to reach these 50 other countries in seven years. TV shows took a much slower route. Not only has there been a limited selection of countries in six years of expansion but even in the US, the programs available are a tiny subset of what is being produced.

    Is the TV business going to expand digital distribution at the glacial rate of music or not at all? In either case, the distribution of Apps as a digital medium is positively viral.

  2. Hiding in plain sight

    Research · 67 comments

    Guessing the next Apple product has become the parlor game of choice for a whole generation of technology journalists and analysts. The premise of the game is that given a track record of breakthrough products, there is always another one just around the corner. Being the one to predict this next breakthrough product creates credibility and demonstrates the domain knowledge of the predictor. If the prediction fails to materialize there is consolation in dismissing the actual announced product as disappointing, unsophisticated or, worst of all, uninteresting.

    Most often, these guesses are as much a reflection of the analyst as they are an analysis of the company. Too many predictions are designed to impress or demonstrate the imagination or knowledge of the predictor. They typically anticipate a giant leap of functionality, power or market re-structuring. They envision revolution not evolution; a cutting of the Gordian knot not a polishing of ugly rocks.

    Yet nearly all of Apple's launches have been sustaining improvements in existing products, technologies or platforms. To name just a few:

    • The iPad is an evolution of the iPod touch
    • The iPod touch is an evolution of the iPhone
    • The iPhone uses OS X and Objective C from the Mac
    • OS X came from NeXT
    • The app store market model came out of the iTunes store
    • The iTunes store came from iTunes which came first to the Mac as a media sync tool for the iPod
    • etc.

    John Gruber explained the process last spring as it relates to many of Apple's launches. Although the iPhone did introduce a new user input method and experience that takes consumption in a new direction, its building blocks were there for all to see for many years. The iPhone is a natural evolution of the computer with a handy little "Phone" app.

    Likewise, the iPod came seemingly out of nowhere but by watching the original launch you see it as part of a "media hub" strategy that envisions the Mac as a personal server. The very products which ended up disrupting the Mac/PC began as extensions of their victims.

    You can trace the DNA of almost all of Apple's products to previous products. If Apple did not have these foundations, the slow-motion revolutions would not have happened. Rather than a deliberate big bang, Apple's disruptions are the result of a discovery process. A test, iterate and improve loop. This is why they seem obvious after the launch but also why they seem to be such an anti-climax.

    Therefore, the challenge of predicting Apple's next product should be tackled not only through an act of imagination but by carefully projecting the current products and understanding where they can evolve.

    So it is that I approach the question of Apple's TV disruption. My working assumption about the next Apple TV is that it already exists. It's none other than the existing Apple TV, improved.

    Here are the clues or hints I noted:

    • It uses iOS and the hardware from the devices that run it. It originally ran a PC architecture and shared a kernel with Macs.
    • It has been integrated with iTunes media stores (with the notable exception of the iTunes app store)
    • It has begun to introduce channels other than downloads (ESPN, Wall Street Journal) thus establishing its own distribution for traditional content
    • It is a global product, depending only on the Internet protocols and independent of the balkanized cable standards
    • Through AirPlay it is integrated with Macs and Apple devices.
    • Through display mirroring, iOS devices can use the TV as an external monitor and can even change their own behavior when doing so

    This last point is intriguing. I have not seen discussion of this feature, but if using an iPad 2 or iPhone 4S with iOS 5 and an Apple TV with the latest software updates it's possible to have an iOS device become a controller for TV-based game experiences. Developers are already using the API. When using a pinball game with screen mirroring, the device becomes a controller while the action takes place on the big screen. Switching display mirroring off bring the action and control back onto the small screen. There are still problems with lag and the processors are over-taxed on high frame rates, but the APIs are already there for developers. (I could also mention the potential of new a Bluetooth standard for better wireless response).

    What these signals point to is Apple defining the TV as an iOS portfolio product. This means integration with iTunes, including an app store. This, in turn, means unleashing developer/creative talent through new monetization opportunities. This means new user experiences in discovery. This means FaceTime-like communication through the TV. This means many other things but mostly it means that the TV will be a platform product.

    The only challenge is a (currently lacking) smooth interface. Perhaps that's where voice comes into the picture. But whether that is built-in at the next rev of the product or not is not the story. The story is going to be the sustaining improvement in the original Apple TV. A wonderfully asymmetric product begging to be ignored. A product that because of its apparent lack of success, effectively hides all its secrets in plain sight.

  3. At $2.9bn/yr apps are challenging songs as the most valuable online medium

    Research · 16 comments

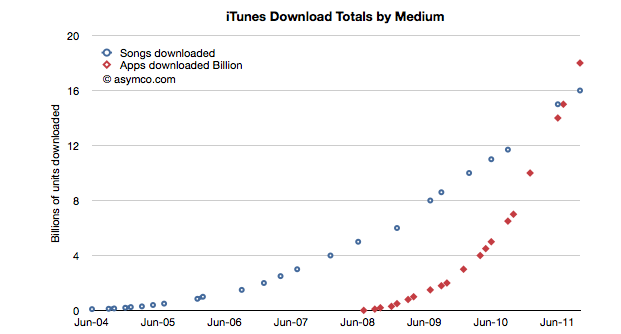
    During the October iPhone event Apple gave an update on the app and song download totals. This is a reliable gauge of the iTunes ecosystem performance and Apple has been supplying these numbers for several years.  Plotting these numbers gives us a good idea of the trend in mobile content consumption. Here is the data to date:

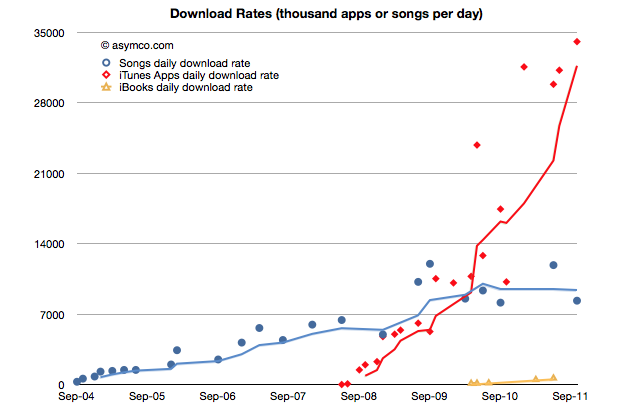
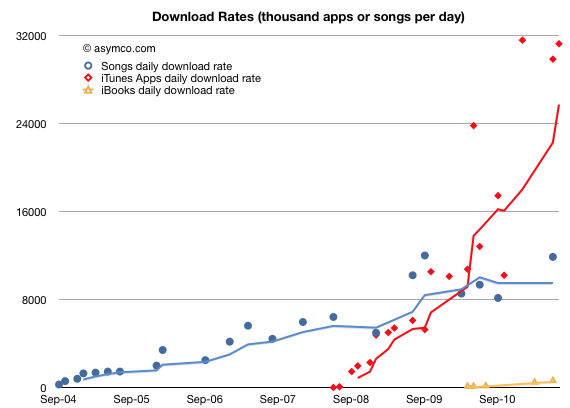
    The total number of apps downloaded (excluding updates) overtook songs in June/July and continues on its trajectory. In fact, the rate of downloads for Apps is now over 1 billion / month. Given the data points above, I calculate it to be about 34 million per day. The corresponding rate for songs is 8.3 million per day.

    You can see the rate of downloads as it's changed over time here:

    I used trailing four periods' moving average for the lines to show the trend more clearly. The gap in download rates is large and increasing.

    Now most observers would note that songs are much more expensive than apps, especially since there are no free songs and many apps are free. This would imply that the music business is probably more valuable than the app business.

    That's true, but not by much. To determine how much, I used the other data point offered: $3 billion in payments to developers. Since that represents 70% of gross revenues to Apple, we can determine that the average price per app is now 23.8c (down from 28.5c in April 2009)[1]. Knowing the app price we can plot both revenues and the margin that Apple keeps.

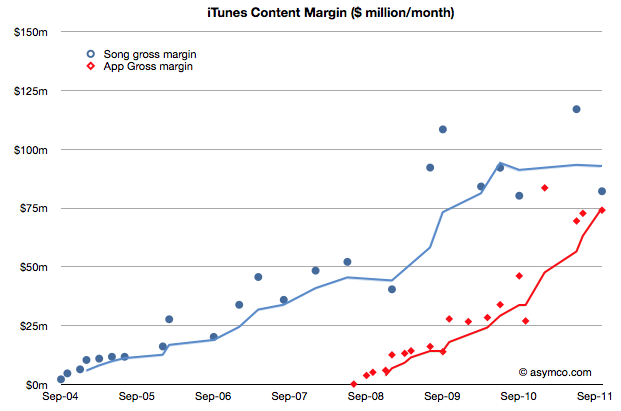
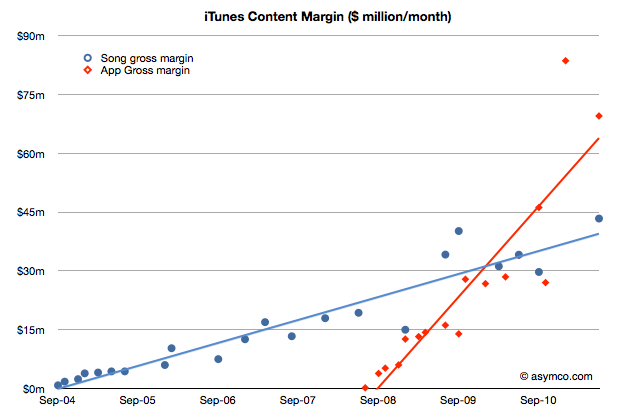
    We can compare that with the margin that Apple keeps from songs (assuming a price point of $1.2 per song and a 73% pay-out to labels.)

    The data jumps around quite a bit but the trend is pretty clear. After paying the content owners, iTunes is left with about $75 million per month from apps and $85 million per month from songs.

    Apple then needs to pay other direct costs like credit card processing, bandwidth, storage, curation and testing. Then there are other operating expenses like R&D and marketing. These costs add up such that, according to Apple, they cover revenues, yielding a break-even operation.

    Break-even or not, the way the data is trending it's pretty clear that Apps will be responsible for a the majority of content cash flow at Apple.

    At a billion downloads a month (and rising) the value in terms of revenues is already a run rate of $2.9 billion per year. This has been enough to overtake a business that has been running for more than seven years.

    ---

    Notes:

    1. The payments to developers probably includes in-app purchases.
  4. Visualizing the Steve Jobs era

    Research · 44 comments

    On October 4th, Tim Cook will take the stage at Apple’s fall event. With Steve Jobs’ transition to head the Board of Directors of Apple and after serving as CEO for fourteen years, it is time to take a look at his reign.

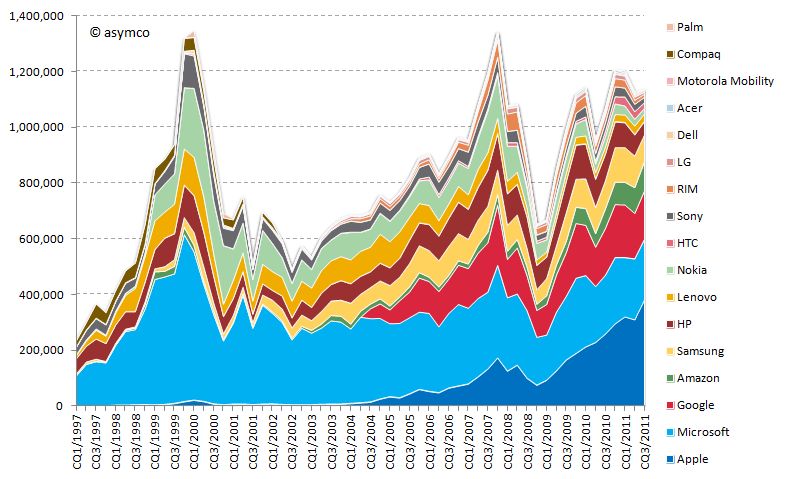
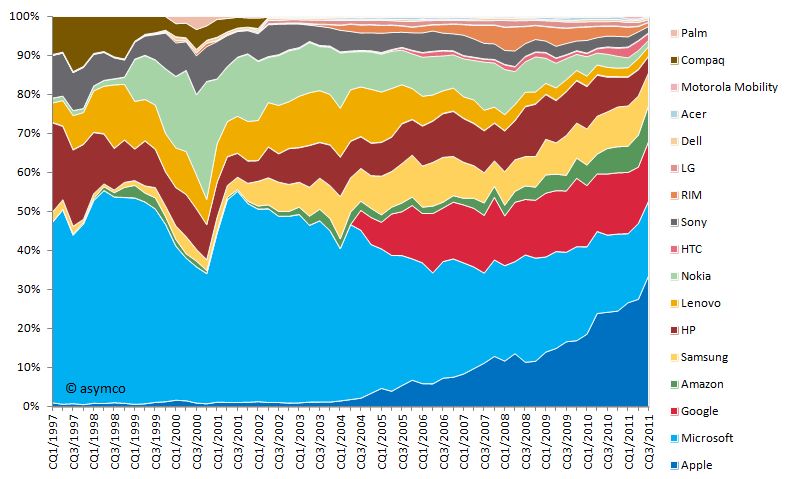
    Looking at his performance vs. peer companies from a capital market performance, I have composed the following two charts:

    Market capitalization of selected peer companies by calendar quarter in USD million sorted by most recent market capitalization (1997-2011)

    Market capitalization of selected peer companies in USD million sorted by recent market capitalization (1997-2010)

    Market capitalization as share of combined market capitalization by calendar quarter sorted by most recent market capitalization (1997-2011)

    Market capitalization as share of combined market capitalization sorted by recent market capitalization (1997-2010)

    You will note that I included more companies than in previous analysis. The new additions are:

    • Compaq (acquired by HP in 2002)
    • Palm (acquired by HP in 2010)
    • Amazon (a popular request by readers)

    I divided this era into three distinct periods:

    Restructuring of Apple 1997-2000

    In the beginning of 1997, Apple’s market capitalization was lower than almost all of its peers. In absolute terms the market capitalization moved only slightly upwards towards 1999 and the dent in 2000 is significantly lower compared to the market capitalization increase of other companies, first and foremost Microsoft's. Especially in the early part of this period restructuring and streamlining efforts took precedence. The introduction of iMac in 1998 and the iBook in 1999 set the tone in terms of design, quality and "thinking different" for many years to come.

    iTunes era 2001-2006

    With a stable core business and healthy profitability, Apple introduced the first iPod in October 2001 complementing the earlier introduced iTunes music player. Two years later, Apple introduced the iTunes Store offering downloadable music for the Mac and Windows operating systems. The venturing into the music and portable music player business and the halo effect for the Mac business is reflected in the market capitalization increasing significantly during the following years surpassing HP and Nokia.

    Mobile iOS devices 2007-2011

    Market capitalization further increased with the entry into the smart-phone market in 2007. Note that market capitalization of all selected companies combined at that time was as high as in the dot.com era of 2000. But this time Apple accounted for more than 10% of it. From 2008 to 2009 market capitalization of all companies declined severely due to the financial crisis. Rapid recovery followed during 2009 and early 2010. Apple introduced the iPad in March 2010 further fueling its rise to the top, surpassing Microsoft’s capitalization and topping Exxon Mobil as the world's most valuable listed company.

    During the time of Steve Jobs as CEO, Apple's market capitalization increased on average by 42% every year--an unprecedented track record. According to his own admission, Steve Jobs became CEO when Apple was 90 days away from bankruptcy. He resigned 14 years later after leading Apple to becoming the most valuable listed company in the world. From a value creation point of view, it's hard to think of a better performance from anyone, ever.

  5. A new way to value Apple

    Research · 38 comments

    Almost all valuation models for Apple assume it's a hardware company. The modeling algorithm for hardware is simple:

    • For each year in near future
    • For each product line
    • Compute contribution
    • Determine company value by summing contributions and multiplying by a P/E ratio

    The major difficulty is in predicting the growth of each product line. This is difficult because buyers can be fickle. Companies employs all sorts of tools in order to secure repeat customers but if switching costs are low, the company can crash in value. For this reason, analysts pick various ways to predict device  sales. Some choose to index each product on production (channel checks), demand (customer surveys,)  or even on a top-down share of total (market research on growth of whole market and assumptions of share).

    Although simple and convenient, this model does not probably match the way Apple is managed. The company does not build hardware products to sell and forget. It builds platforms which are best seen as sources of recurring revenues. Users are incentivized to continue buying devices. iCloud, iTunes and other Apple properties are expressly designed to that goal--and they are not cheap to run. So, the company must see the world through a different set of lenses than the default model shown above.

    To think about the business like they do, we need to put the data through a similar set of lenses. I began with a modest proposal last month to value each user as a source of recurring revenue. Now it's time to expand on this method.

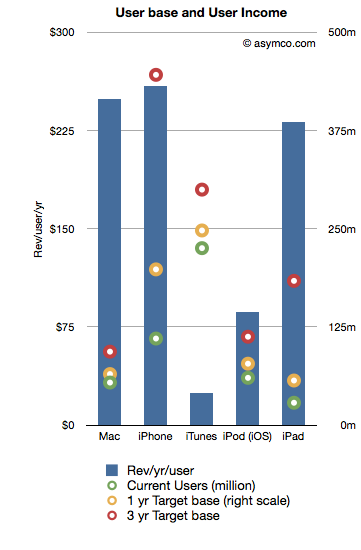
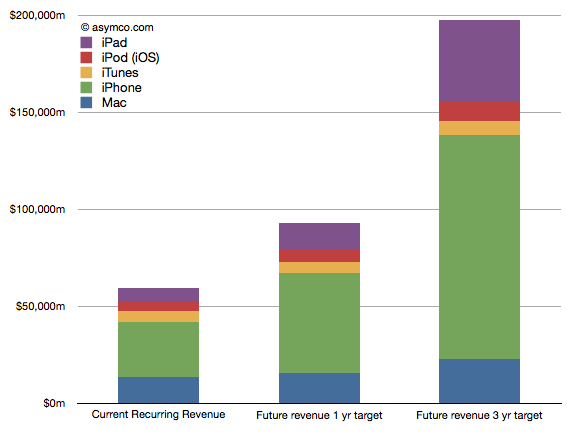
    The following chart shows the recurring revenues per user by product and the current and possible future size of user bases.[2]

    Revenues/yr/user are bars with the left axis and the User bases are various colored circles indexed with the right axis.

    The assumptions that went into the data are as follows:

    1. Device life span is as per previous article linked above
    2. User base growth for 1 year is: Mac 20%, iPhone 80%, iTunes 10%, iPod 30%, iPad 100%
    3. User base growth for 2nd and 3rd years (recurring): Mac 20%, iPhone 50%, iTunes 10%, iPod 20%, iPad 80%.
    4. The Revenue per user is assumed constant

    Note that the user base growth figures are lower than the product growth levels seen historically. Obviously, the model is highly sensitive to these growth assumptions so they need to be scrutinized and tested rigorously.

    Nevertheless, as a straw-man proposal,  the recurring revenues for all these products[1] is shown in the following chart:

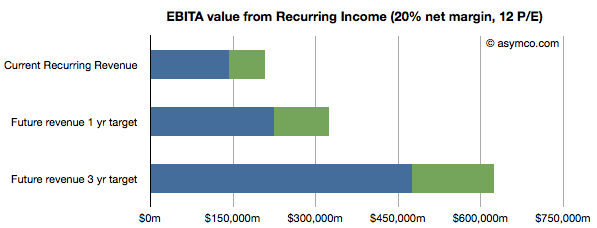
    Once the income is estimated, we can take that value and assume a profit margin (net) and then multiply the earnings by a multiple. Using a 20% net margin and 12x P/E yields the following chart.

    (I added an assumed level of cash in green.)

    This model would imply that the company today could be valued at $208 billion on the basis of its installed base alone. That value would be about $323 billion in one year and $620 billion in three years. Dividing by the number of shares outstanding (935m this year increasing at 2% a year) yields a share price of $222, $339 and $629 by mid 2014.

    These values can be considered "lower bounds" on valuation since they assume income from previously secured customers. The speculative part of investment would be based on what the future bases will look like (so, for example, if one believes these assumptions, the $629 figure could be considered a target to be discounted to today).

    ---

    Notes:

    1. Excludes Software, Peripherals, non-iOS devices, and any other service revenue.
    2. Compare this char to social media companies (MIT Technology Review)
  6. iTunes app total downloads (finally) overtook song downloads

    Research · 29 comments

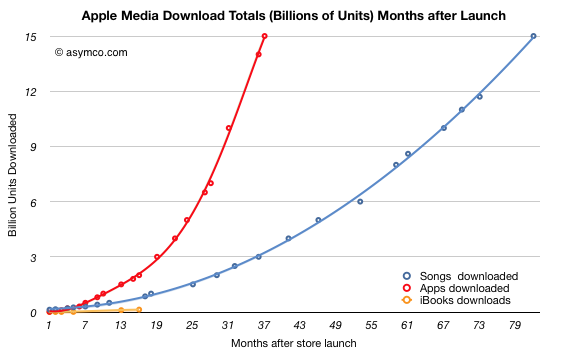
    It was only a few weeks ago (at WWDC) that we had an update on the app store growth rates. The data was presented here.

    One of the data points from the event was that iTunes hit 15 billion song downloads. Last week we heard that iTunes also hit 15 billion app downloads.

    The milestones were reached within less than a month so it's a fairly safe assumption that apps have overtaken songs. I had originally guessed that the cross-over would take place at 13 billion at the end of 2010.

    The actual performance is shown below (total downloads indexed to same starting date):

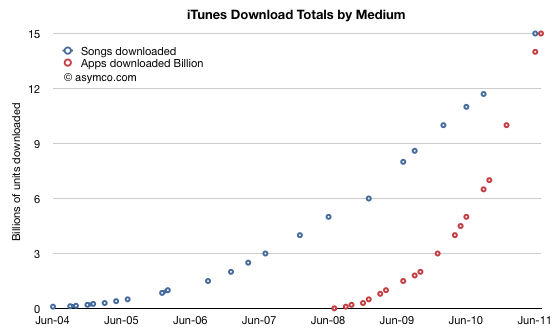
    The 15 billion app threshold was passed within exactly three years while the 15 billion song threshold was passed in six years and 10 months. Shown on the actual time scale, the chart looks as follows:

    Download rates for songs had a minor rebound in the last six months.

    The app download rate is now at least 31 million per day while the song download rate is about 12 million per month. Including books (but excluding video content), the App Store in now delivering at least 44 million new content downloads per month.

    My prediction of cross-over was off by seven months. This was due to three factors:

    1. Song downloads increased unexpectedly. There was a rebound in the last six months where daily downloads went from about 8m/day to about 12m/day which is a new high. I had expected download rates to have peaked mid 2010.
    2. App download rates proved to be more volatile than expected. As the last chart above shows, the download rates fluctuate quite a bit. The 4-period trend line is a bit more stable, but there are kinks.
    3. Polynomial curve fitting is always sensitive.

    When dealing with polynomial growth, predictions can be very dangerous. Nevertheless, I think the overall performance of the App Store is phenomenal.


  7. The app industry vs. the music industry

    Research · 25 comments

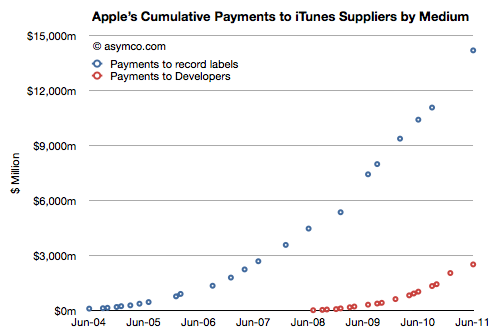
    By my estimate, Apple has paid out $16.6 billion to content owners. $2.5 billion to app developers and about $14 billion to music companies. The developer payments are published by Apple, the music payments are estimated based on total downloads and guesses about the split and pricing of that content (90% for the content and $1 to $1.2 average pricing over time.) There might be reason to move the music figure up or down but the difference will still be nearly a factor of 5.

    The cumulative payments are shown in the following chart:

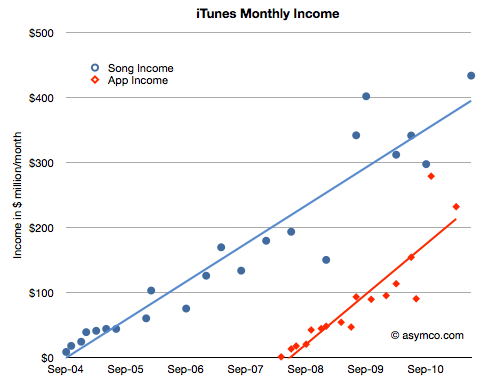
    From this perspective, the music business is still a far bigger ecosystem than apps. However that's cumulative data and digital music has been around far longer. The story can be told a different way: What's the rate of sale in the present period? From what we know about the business, we can see what Apple takes in for apps and music (I've already estimated what Apple "keeps" after paying content owners)

    The combined "sales rate" is a remarkable $665 million per month, but the split now is that music generates only twice the income of apps (i.e. cumulative is a factor of 5 but on a monthly basis the factor is 2). But what should be more impressive is how quickly the app business is ramping. By the slope of the trend lines, it would appear that app income will exceed music income within three years. Therefore, it's only a matter of time before apps generate as much income (exclusive of advertising) as music.

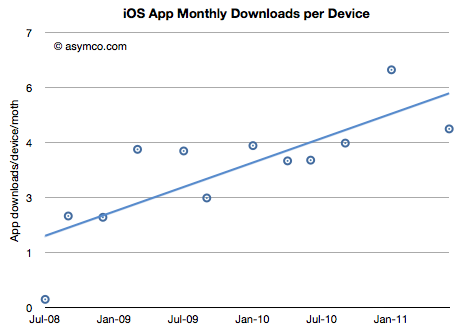
    Another perspective is the number of downloads per device per month. This shows that the rate of consumption of apps is increasing and is now about 6 apps per device per month.

    (You have to think of apps not as traditional computer applications or console games where each device has a certain number of expected apps attached, but rather that apps are more like a subscription where there is recurring monthly income).

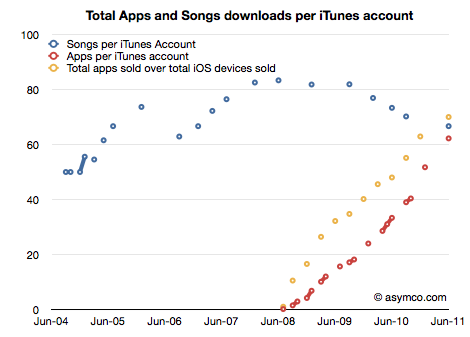
    I don't have a comparable figure for music because the number of iPods and Macs as target devices is hard to estimate, but I doubt consumption for music on a per device basis is increasing. As a consolation, I can estimate the number of apps or songs per iTunes account. Here the story is consistent.

    Each iTunes account has "consumed" about 67 songs but also 62 apps. Remarkable parity in such a short time. And the trend speaks for itself.

    All this data points again to the ascendancy of apps as a new medium. In a mere three years these digital objects have redefined themselves. They went from being tools to enhance the use of your phone to a new medium of expression and art. They have the ability to create a powerful economy of their own and will likely lead a profound shift in where value resides in mobile computing.

  8. iTunes now costs $1.3 billion/yr to run

    Research · 83 comments

    The iTunes store continues to grow. The data that Apple published in the last event included the following:

    • 15 Billion iTunes song downloads
    • 130 million book downloads
    • 14 billion app downloads
    • $2.5 billion paid to developers
    • 225 million accounts
    • 425k apps
    • 90k iPad apps
    • 100k game and entertainment titles
    • 50 million game center accounts

    As this data is added to the existing data and cross-referenced additional insight into the economics of iTunes is emerging.

    Since we know something about the average price of songs and apps, and we know the split between developers and Apple (and roughly between music labels and Apple) we can get a rough estimate of the amount Apple retains to run its store.

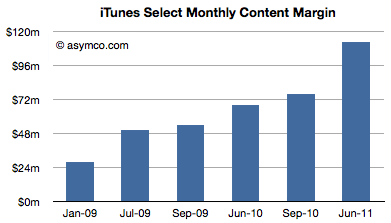
    The following chart shows iTunes "content margin" by month. This margin is what Apple "keeps" after paying content owners but before paying for other costs like payment processing and delivery/fulfillment which should be accounted as variable costs. Strictly speaking this margin is not "gross margin".

    If we add the content margins from music and apps and assume the store runs at break even we can get an idea of what it costs to operate the store.  The latest number is $113 million per month (from a total income of $313 million/mo.). It implies over $1.3 billion per year.

    Much of that cost does go into serving the content (traffic and payment processing). Some of it goes to curation and support. But it's very likely that there is much left over to be invested in capacity increases.

    I would like to hear alternative opinions, but my guess is that much of the capex that went into the new data centers Apple built came from the iTunes operating margin.

  9. Getting to one billion iTunes accounts

    Research · 37 comments

    There are 225 million iTunes account holders. 25 million joined in the three months. As the iTunes store has been operating since April 2003 it's possible to step back and look at its history and measure the rate of growth relative to other ecosystems.

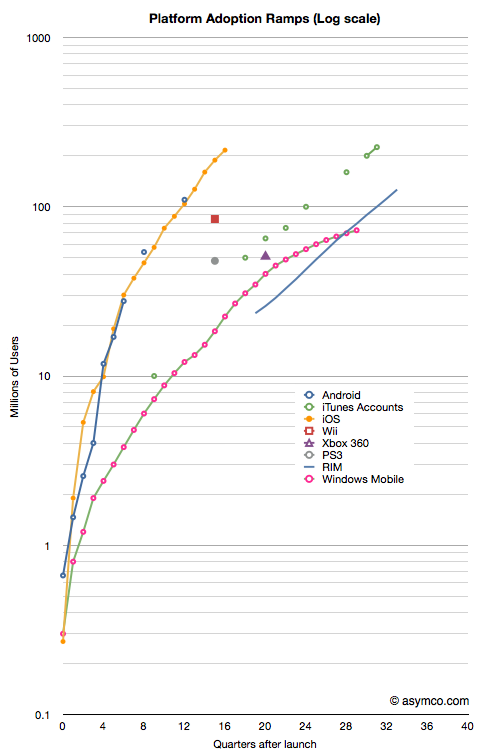
    The following chart shows various platforms/ecosystems in terms of adoption. In the case of phone operating systems and consoles, the cumulative units sold is shown. The scale is 10 years by 1 billion users with users measured on a logarithmic scale.

    What can be easily observed is that iTunes continues to grow on a logarithmic scale even at its advanced age of 7 years. This cannot be said for console-based gaming systems or for some alternative mobile phone platforms (e.g. Windows Mobile or Symbian).

    The reason for this prosperity at an advanced age may be due to the fact that iTunes has survived the transition from one device (the iPod) to a device platform (iOS). It also was able to embrace multiple media from music, to movies to TV and apps. iTunes turned out to be far more flexible and resilient given what was technologically foreseeable at its birth.

    Looking to the future, is it possible that iTunes could grow in parallel with iOS toward the 1 billion user limit that the slope in the chart implies? Much will depend on gaining users who are unlikely to have credit cards and live in emerging markets. If there is one obstacle to the iEmpire it's the addressability of markets which lack consumer credit infrastructure. I suspect, however, that these problems are not unsurmountable given that telecom infrastructure leapfrogged credit infrastructure growth with nary a ripple. Apple could certainly offer that service directly to the consumer.

  10. Android developers are more prolific but less persistent than iOS developers

    Research · 29 comments

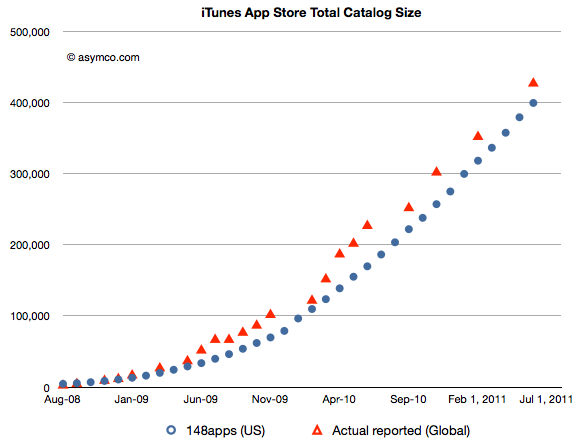
    According to 148apps.biz, the App Store has seen over half a million apps since inception. The number of available apps, according to Apple, is now 425k. (148apps claims 402k apps available in the US store.) The history of the App store catalog is shown in the following chart (showing both US and World-wide measures).

    In an interesting new post by Appsfire, APPtrition - or why app store size does not matter that much... Ouriel Ohayon makes a good point: available is very different than accepted. When comparing catalogs it's important to distinguish between these measures. Apps are published and then unpublished for various reasons. He calls this app attrition and details the reasons it might happen.

    What makes this interesting is the contrast between attrition rates on Android's Market and those on Apple's App Store. About 80k (or 16%) of Apple's catalog has been removed while nearly a third of Android apps have disappeared from the catalog. (By another measure, the submission total is tracked here and shows nearly 375k apps while Ouriel points out that there are 206k available. An apparent attrition rate of 45%.)

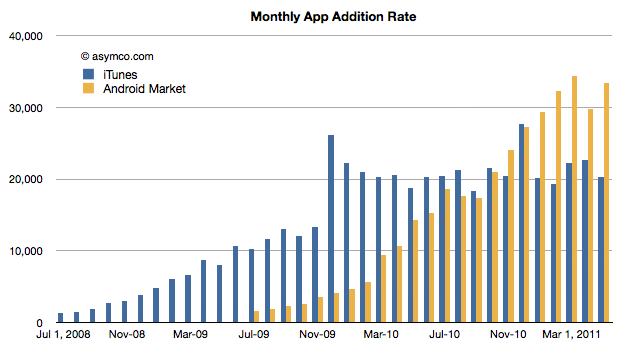
    We can compare how the two marketplaces are adding apps here:

    (The iTunes data is US only)

    This data would indicate that the iTunes App Store has plateaued at about 20k apps per month while Android is still growing and adding at about 30k per month. The challenge for an observer is to reconcile the growth in Android submissions with the apparently far higher attrition rate.

    In other words, Android developers and producers seem to be more prolific but less persistent.  With few if any constraints on submission it's understandable that there will be more apps thrown into the catalog. But why would they be so rapidly removed remains a mystery. Maybe economics, maybe policing, maybe something else altogether explains this.