Asymco

Asymmetric Intelligence

iTunes

  1. More than 60 apps have been downloaded for every iOS device sold

    Research · 33 comments

    The iTunes App Store is about to reach 10 billion downloads. That makes this a good time to revisit app growth metrics and compare them with the other digital media store that we have data for: the iTunes Music Store.

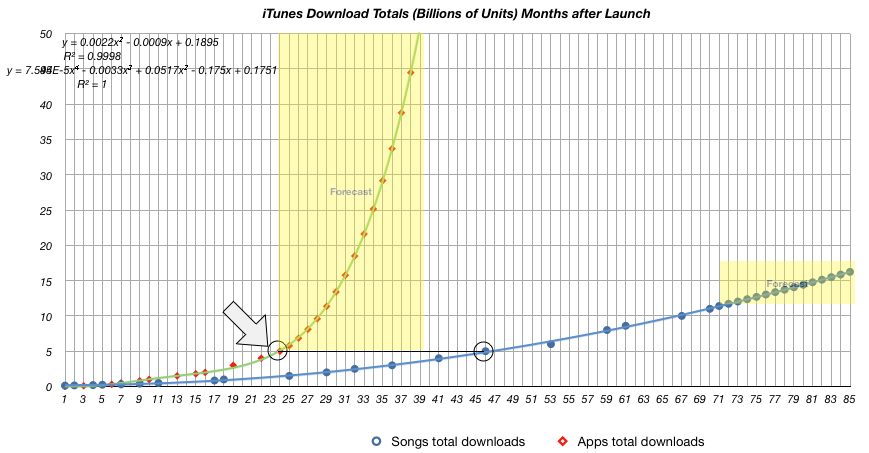
    First, the download totals as time series[1]:
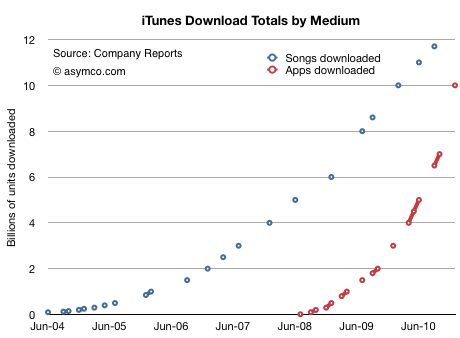
    Assuming that 10 billion will be reached this month, we see how the steepness of the app curve implies that apps will overtake songs within a few months. I suspect by March.

    In September I made the prediction that total apps would overtake total songs sold by the end of 2010. That has not yet happened, but it's close.

    If we measure downloads as a function of the number of months since store launch, we can see that Apps reached 10 billion downloads in less than half the time it took songs (31 vs 67 months.)
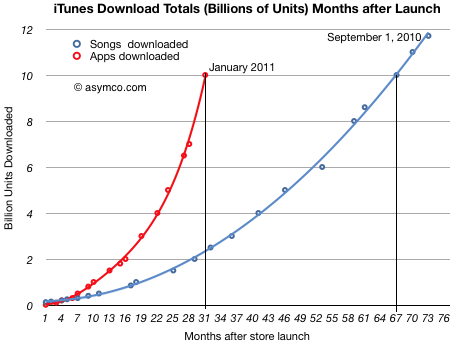
    I used polynomial curve fitting to draw the lines.

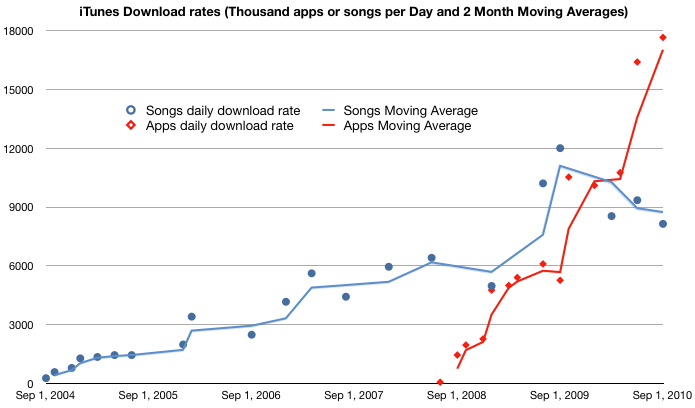
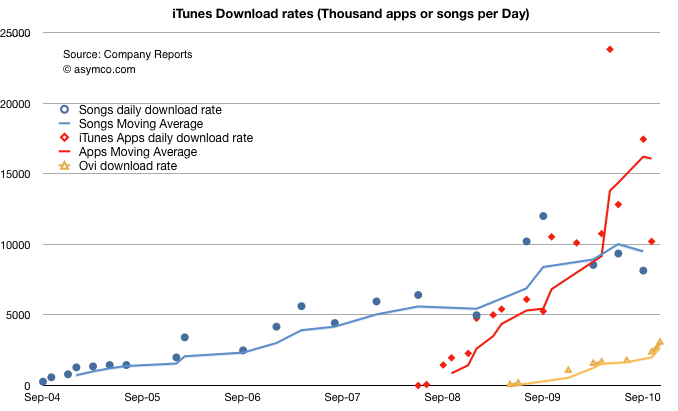
    The other way to look at the data is by measuring the daily download rate. The data is more scattered, but the trend is still clear:
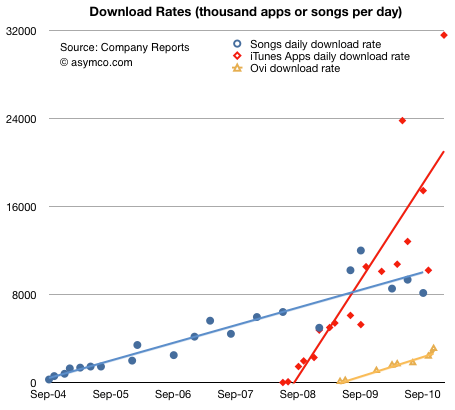
    (The solid lines are linear trendlines. I added the known data from Nokia's Ovi for comparison.)

    The amazing story of this chart is not that apps are running at above 30 million download per day, but that the figure is growing. Growth like this is hard to get one's mind around. Not only are downloads increasing, but the rate of increase is increasing.

    There is one final piece to put in place on this puzzle. Some might argue that the reason these download rates are increasing is because the installed base of devices is increasing at the same rate. In other words, app consumption could be steady on a per user basis.

    To answer this we need to divide the cumulative apps downloaded by the cumulative devices sold. Using a reliable estimate for iPod touch units sold, we can get a pretty clear picture:
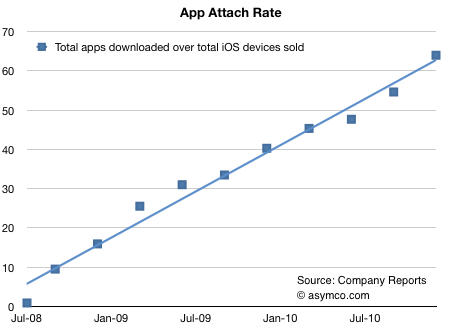
    The number of apps downloaded for iPhone/iPad/iPod touch is running at more than 60[2].

    In the fall of 2008, there were about 10 apps downloaded for every iPhone/iPod touch. Two years later the rate was more than five times higher. There are significant implications for the network effects related to the iOS platform. End user investment in apps is even higher than end user investment in music which created a very tight lock for iPod users.

    I draw three conclusions:

    1. Apps overtaking digital music is a watershed event. Apps are a new medium: they will impact all other media.
    2. As the number of apps attached to any single device continues to increase, apps create increasingly higher switching costs for users.
    3. Apps consumption is increasing at a rate to overtake the PC software market.

    ---

    Notes:

    1. The total apps does not include updates.
    2. The attach rate is actually higher since the figures above assume all devices are still in use.
  2. Nokia's Ovi Store downloads hit 3 million a day

    Research · 32 comments

    More than 400 000 new developers in past 12 months; 92 developers each top 1 million download mark; 1.5 million downloads of Qt software development toolkits

    via Nokia - Show Press Release.

    See the following chart comparing Ovi with iTunes Music and iTunes Apps download rates.

    The last data point we have for iTunes App downloads was from October 18th when 7 billion total downloads were announced. The last update was around Sept 1st when 6.5 billion were announced. That comes out to about 10.6 million downloads per day. The previous interval suggested about 17.6 million/day.

  3. Visualizing Apple's Profitability

    Research · 26 comments

    After the last earnings report, many noted that Apple's gross margins dipped. Turley Muller noted in a letter to PED that the cause was probably the aggressive ramp in iPhone 4 production which broke new records at 14.1 million units.

    That may be. My estimate of iPhone margin shows it dropping to about 49% from the more usual 55% (sometimes even higher).  We'll never know exactly how much, but sometimes margins drop. RIM and Nokia are punished for drops in the GM percent so why shouldn't Apple?

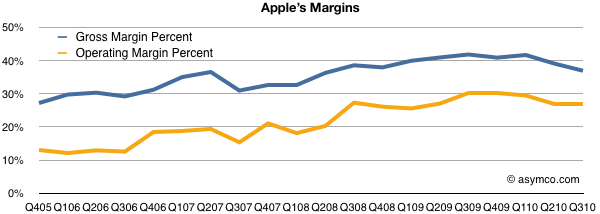
    However, there are some other factors to consider: the overall margin is currently historically very high. As the high-margin iPhone makes up more of the total product mix, the overall margin should be growing. And it is. The chart below shows the trend since 2005. GM was in the high 20's five years ago.

    Note however the other margin: operating margin. After taking the fixed costs into consideration (which we saw to be shrinking as a percent of sales), Apple's bottom line profitability has been rising slightly more rapidly than the GM. It has plateaued recently but not dipped significantly.

    Also note that there have been dips in the past from which GM expansion resumed. One such dip was at the launch of the first iPhone in 2007, though we can't be sure that was attributed to the iPhone itself or to other factors like that most cited by management: components costs.

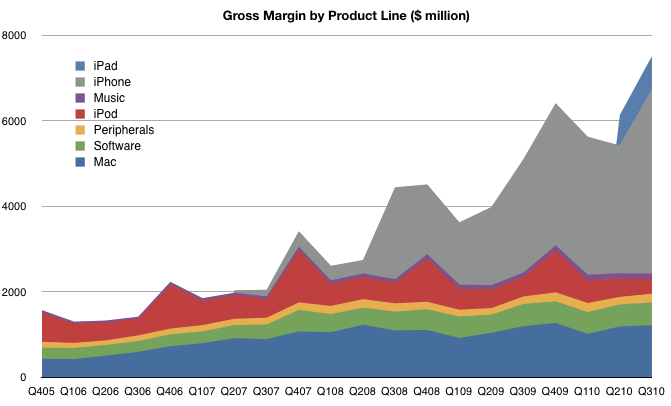
    However, the bottom line profitability is only part of the picture. It would be instructive to look at which product contribute how much. You won't see this analysis often because the gross margin by product is not published by Apple and it takes quite a bit of guesswork to get there.

    I maintain product-level gross margins and compute the overall GM bottom-up. The product-by-product line profitability is based on several assumptions which I won't detail here, but those assumptions lead to the following contribution chart:

    There are several takeaways here:

    1. The iPhone is huge (57% of gross profits). It is far more important than most people assume. Without it, the company would not have materially grown EPS since 2007.
    2. The "Music" which includes iTunes revenues is tiny. Many people assume that iTunes is a large contributor to Apple's operating profitability but operating margins on the store are 10 percent. Peripherals add more to the bottom line than the iTMS/App Store. The benefit of the iTunes/App Stores is in the hardware sold.
    3. Software contributes more now than the iPod. This is completely under everyone's radar but Apple's software business has been growing and with 80% gross margins (assumed) it's a big part of the profit picture.
    4. The iPad margins are lower than the iPhone. As it grows in volume, the profit share will grow, but it's a long way from being the profit share leader.

    This picture should also be a warning to Apple's competitors. If they seek to grow shareholder value and shift profits away from Apple they need to see just how much of that profit is captured in hardware. At the same time, they need to realize that it's the non-hardware businesses which make the hardware so desirable. Like it's products, Apple's income statement is very inter-dependent.

  4. It takes nearly $1 billion/yr to run iTunes

    Research · 44 comments

    In recent articles I highlighted the acceleration in iTunes App downloads where the rate is approaching 18 million apps per day and the cumulative total apps which is about to overtake the cumulative songs downloaded.

    We now turn our attention now to constructing the iTunes income statement: namely total sales, gross margins and deduce its operating budget.

    Gross Sales

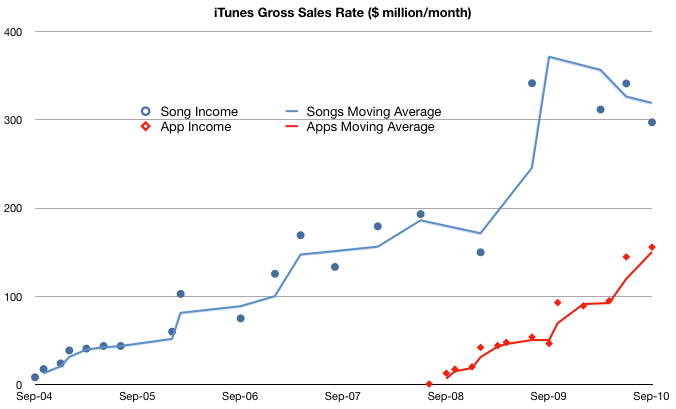
    To obtain the top line (income) for iTunes we need to know the average selling price (ASP) for songs and for apps. Apps are easy, we received that info in June: $0.29 per app. For songs, it was easy before early last year: $0.99/song. After the selective price increase, the blended price needs to be estimated. I chose $1.10 for 2009 and $1.2 for 2010. These are just assumptions and can be adjusted but should give us a rough estimate:

    I followed the convention of using income rate or $/month to show the history of sales. It shows that even with a price less than a third of the music product, apps are generating over half of the sales of music. In other words, apps are adding 50% to iTunes sales today. If the decline in music units continues and the app sales increase with the current trajectory then app sales value will overtake music sales next year, consistent with the cross-over of cumulative units sold.

    Gross Margin

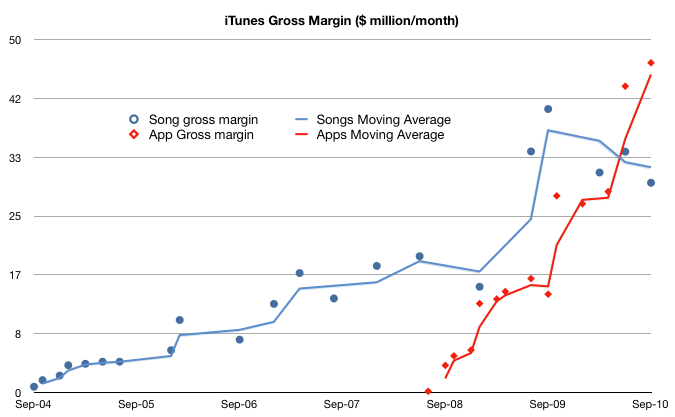
    If we know how much Apple pays music licensors and developers (i.e. cost of goods sold) we can calculate how much it keeps for operations (gross margin). Apple's app margin is 30 percent. The music margin was never official but the consensus has been 10 percent for a while.

    Using these figures, we get the following chart:

    This shows that what is left after paying the content license, Apple "keeps" about $50 million every month to run the App store (iTAS) and another $30 million to run the Music store (iTMS).

    The Operating Budget

    Apple has made a point of saying that both iTAS and iTMS are run at "break even" implying that the gross margin is used up in operating costs (CAPEX, R&D, SG&A). To be sure, the cost of bandwidth and the data center(s) needed must be considerable.

    But the operating budget for the store is beginning to reach a level that may be beyond what can be spent reasonably. The amount left over for operations has increased from ~$30 million a month in 2009 to $75 million/month today.

    In fact, if this burn rate is maintained (even though it's increasing) the operating budget for iTunes is nearing $1 billion/yr.

    I'm not an expert on the cost of operating data centers but $ 1billion a year seems like a lot. I would love to see an analysis of how this could be allocated.

    Implications

    I would also add that because of the increasing mix of apps, the overall gross margin percent is increasing. I estimate that to be a blended 17%--a healthy margin for a content store--and an increase from 10% before the app store came online.

    Finally, one implication of the economics involved is that a budget like this may provide a significant barrier to entry for any competitors looking to take on the iTunes juggernaut. iTunes has reached content critical mass (12 million songs), user base (160 million users) and wide distribution (23 countries for songs and 80+ countries for apps).

    These are non-trivial operational issues that even the best in the "cloud" business models will find challenging.

    Footnote:

    This discussion excludes video sales, rentals, book sales as we don't have solid histories for these product lines. However, we can do a spot check on the cumulative totals:

    • 450 million TV episodes downloaded implies $1 billion in sales.
    • 100 million movies downloaded probably adds at least another $1 billion
    • 35 million books adds another 500 million.
    • Compare with 11.7 billion songs at ASP of $1 for about $12 billion in song sales and 6.5 billion apps at ASP of $0.29 or about $1.9 billion.

    iTMS content downloads have generated $16.4 billion in sales to date.

  5. iOS users downloading 17.6 million apps/day. Songs, not so much.

    Research · 26 comments

    Thirty days after the launch of the iTunes App Store, Apple announced that 60 million apps were downloaded in the first month of operations generating sales of $30 million. "This thing's going to crest a half a billion, soon," Jobs said adding that it may be a "$1 billion marketplace at some point in time."

    Mr. Jobs was being modest.

    To see how modest we have the following data:

    If the current download rate is maintained (17 million apps/day) and if the pricing of $0.29/app is preserved, then $1.8 billion will have been spent on iOS apps this year.

    With the rate of downloads increasing as steeply as it is, $2 billion in sales is not unlikely in the third year of the store. Twice what Jobs was predicting for "some point in time".

    The other line in the graph is the iTunes music download rate. I've written about it before and pointed out that the point of inflection in the download rate coincided with the increase in price for songs from $0.99 to $1.29. Not much more to say here except that the trend continues and music downloads continue to slow.

    As far as Apple is concerned, the slowdown in iTMS is more than offset by the increase in iTAS. As far as the music industry is concerned, I don't think CD sales are increasing. Does anyone know?

  6. The race to a billion users

    Research · 16 comments

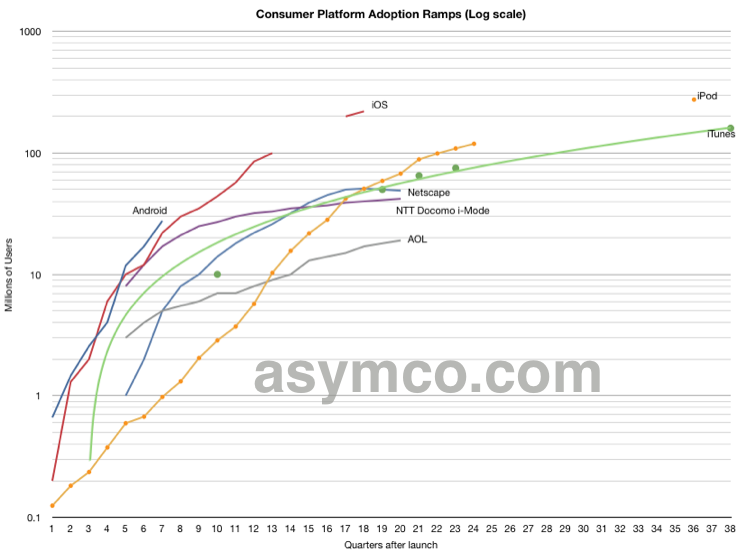
    I took the venerable Consumer Platform Adoption Ramps chart and added Android and the latest data on iTunes, iPod and iOS.

    To make it more readable (but conceptually more complicated) I put the data on a log chart.

    Discussion

    The time span covered is nine and a half years. The top of the graph marks the one billion threshold. Reaching one billion in less than 10 years is an interesting challenge for any platform and, at first glance, it seems that both iOS and Android have a shot at it. This does not seem likely for any of the other platforms.

    The challenge is that as penetration grows, it's natural for the slope for the lines to become shallower. Some platforms are simply not able to address one billion users:

    • i-Mode, AOL and other technologies with localized value networks are clearly limited to populations in their home countries.
    • iTunes is limited by the use of a PC, which has a small footprint in under-developed countries (dependency by iOS on iTunes should throw up a red flag here).
    • The iPod was embraced and extended by more ubiquitous mobile phones.

    In contrast, mobile phones in general and smartphone platforms in particular have potential to reach a billion users (per platform.)

    To wit, note that iOS and Android have similar curves to date and are both likely to overtake iPod and any other contender.

    So for the obligatory theological question: Will Android follow the curve of iOS or will it diverge and continue on a steeper trajectory? Does it matter?

    Discuss...

  7. September Music Event: Just the numbers

    Research · 20 comments

    • 300 Apple Stores
    • 10 countries with Apple Stores
    • >1 million store visitors some days
    • 80k 1:1 sessions/week
    • 120 million iOS devices sold to date
    • 230k new iOS activations per day
    • 6.5 Billion apps downloaded
    • 200 apps downloaded every second
    • 250k apps available on App Store
    • 25k iPad apps available on App Store
    • 275 million iPods sold
    • #1 portable game player: iPod touch
    • 50%+ of portable game device share US and world-wide
    • 1.5 billion game and entertainment titles downloaded to iPod touch
    • 11.7 billion songs downloaded from iTunes
    • 450 million TV episodes downloaded from iTunes
    • 100 million movies downloaded from iTunes
    • 35 million books downloaded from iTunes
    • 160 million iTunes accounts
    • 23 countries for iTunes music downloads
    • 12 million song library
  8. Warner Music slows while iTunes grows

    Research · 3 comments

    Revenue from digital sales of recorded music grew just 3.7 percent to $169 million. That's a slower pace than the 4.5 percent growth posted a year ago and 39 percent growth two years earlier.

    via Warner Music CEO looks `beyond iTunes' amid losses - Yahoo! Finance.

    For the record, iTunes did grow at 35% in the quarter that Warner Music grew digital sales by 39% two years ago.

    But the two diverged a year ago with 17% iTunes vs. WMG's 4.5% and this past quarter iTunes grew at 27% vs. 3.7%.

    Gives us an idea of how much Apps have swelled iTunes' top line.

  9. New data on iTunes: 11 billion downloaded

    Research

    When Steve Jobs announced 150 million accounts with credit cards on the iTunes Store, iBookstore and App Store, he stated that as far as he knows it has "the most accounts of any store on the web".

    More interesting is the claim that iTunes has enjoyed 16 billion downloads.

    Subtracting the 5 billion app downloads, that leads to Music+Video adding up to 11 billion (books at 5 million is still too small to make an impact.)

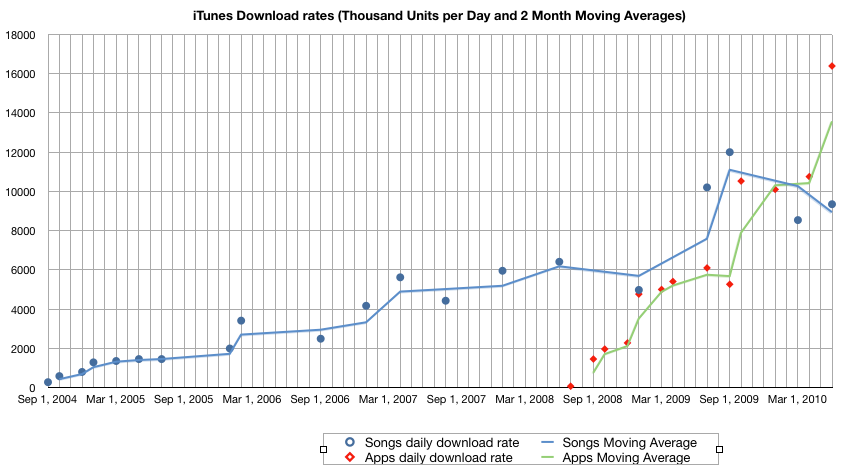
    The last download data on iTunes was in February when Apple reported 10 billion songs downloaded. The new data implies the daily download rate is about 9.3 million per day.  The forecast I had suggested 11.1 billion by June 1 so it's come in a bit less than expected.

    12 billion songs is expected in September.

    The graph that follows shows actual and forecast cumulative downloads for the App Store and iTunes store based on months after launch.  As it shows, 5 billion apps took 24 months whereas 5 billion songs took 46 months.

    This graph shows the download rates.  The green line (apps) clearly overtakes the slowing blue line (songs/media).

  10. Why Apple is on top today: the top 10 technology decisions

    Research · 91 comments

    As Apple overtook Microsoft in market cap and as Steve Jobs reminisced about some recent history, I thought I'd reflect on some of the decisions that brought Apple to the pinnacle of technology companies.  The criteria I used to select these is how improbable and hence courageous they were when taken and how much impact they have had on the industry. Since the impact of these decisions could not be felt for a long time, the courage required to act early is all the more remarkable.

    At the time they were made, none of these decisions did anything to move the stock price or cause great rejoicing. In fact, in many cases the decisions were ridiculed by those who should know better. Yet each one became a massive pillar of the foundation of Apple as it is today.  As you read through, think of the decisions that Apple competitors made or did not make in the same time frame.

    Top 10 Apple technology decisions of the 2000 decade in reverse order:

    • 10. HTML 5 (canvas). It was initially introduced by Apple for use inside their own Mac OS X WebKit component, powering applications like Dashboard widgets and the Safari browser. Still in its infancy, the canvas element is an Apple technology that promises to finally offer a credible Flash equivalent.  Remember that Flash is now over 10 years old and was incubated at a time when the Web was barely 1.0.  HTML canvas finally brings vector graphics to the modern era.
    • 9. H.264. The decision to support a standard video codec at a time when the industry was mostly arguing over whether Blu-ray or HD-DVD would win signaled a foresight that physical media was not long for this world.  The consequences are still being weighed as YouTube and other media sources are shifting their inventory to this format.
    • 8. iTunes. iTunes started as a personal music database, grew into a music and media store-front, a payment processing engine, device synchronization and updating center, and finally an application store.  It was forked into both a PC and a mobile version.  Without iTunes the iPod would have been just another MP3 player.
    • 7. WiFi. Implemented in Airport before the spec was finished, WiFi gave the laptop wings.  Think back to when you still had to plug a wire into a computer to have it communicate. PC's did not catch up in being wireless for years.  WiFi was even a rare feature on mobile phones when the iPhone shipped in 2007 with some operators (Verizon) banning it from their phones even in 2009.
    • 6. FireWire. Along with iTunes brought iPod to life.  Launched at a time when external drives required screwdrivers and a circuit board to install, FireWire made opening your computer case to expand it as common as opening the hood of your car to fix it.
    • 5. iLife. Did to user-generated media what word processors did to words and spreadsheets did to numbers. A singularly great reason to get a Mac.
    • 4. Portability. OSX migrated across three different CPU architectures in less than 10 years. Apple revealed that they built it from day one to be portable to different CPUs.  That took amazing foresight in the late 90s.
    • 3. WebKit. Speed and flexibility.  The biggest reason why we can surf on a phone today.
    • 2. Multi-Touch UI. Seven years in development and still sublime.  Starting down this road in 2003 must have seemed science fiction.  But, unlike other companies, Apple took this science experiment and went to market.  Steve Jobs said how he wanted a screen keyboard and how scrolling opened his eyes to making a phone. That took vision.
    • 1. OSX/Cocoa. The company's backbone.  Everything above hangs off OSX. Remarkably scaleable, portable, robust and reliable.  With roots going back decades, it's the canonical OS. Somebody should build a monument to it.
  11. Apple Business Review: Product Line Margins

    Research

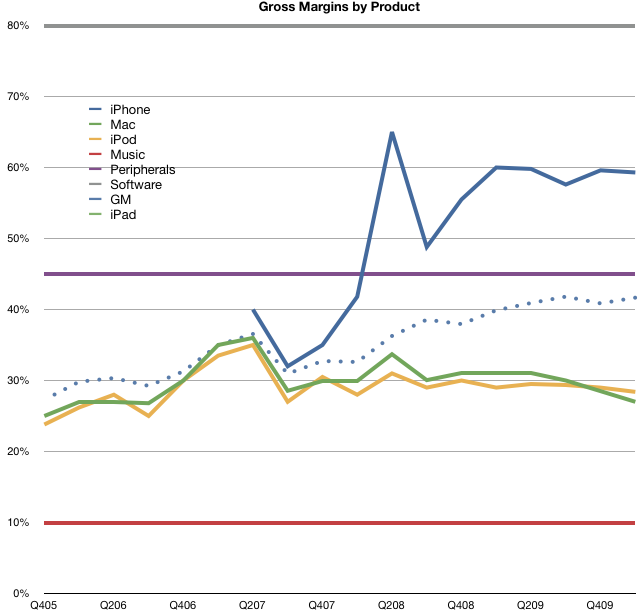
    Apple's overall gross margin reached 41.67%, the second highest ever.  The highest was 41.82% last Fall.  This should not come as a surprise as the iPhone continues to make up an increasingly larger percent of Apple's total sales.  The gross margin on the iPhone continues to be well above all its other product lines (except for software).

    Although Apple does not provide product line GM break-out, some intelligent guessing can be made.  Here are my estimates:

    • iPhone 59%
    • Mac 27%
    • iPod 28%
    • iTunes 10%
    • Periph 45%
    • Software 80%

    A historic perspective for gross growth (iTunes, Peripheral and Software sales growth) is shown in the graph below.