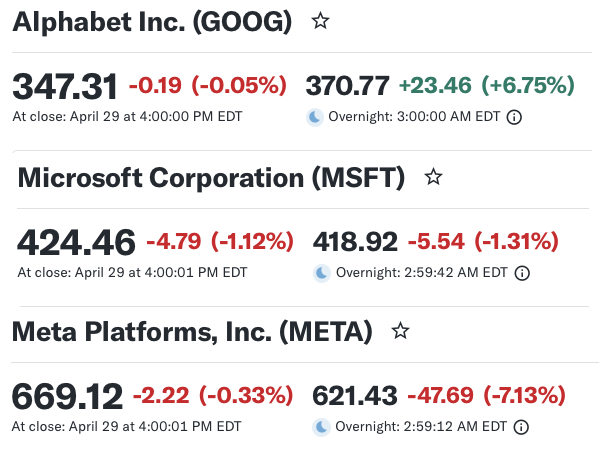
Why give all your cash to Nvidia? Why not make your own chips? Then why not sell them?
Google said that it plans to sell its custom Tensor Processing Units (TPUs) to select customers who will install the chips in their own data centers.
The move is a change from Google’s prior strategy, which saw it rent out TPU capacity to customers from its own data centers — and is yet another strike at AI chip king Nvidia.
The announcement, during the company’s Q1 earnings call, comes a week after Alphabet announced two new TPUs: its TPU 8t for AI training and TPU 8i for inferencing.
Alphabet didn’t disclose potential customers, but it signed a multiple-gigawatt agreement for next-generation TPUs with Anthropic earlier this month, with chips expected to begin coming online in 2027.
And according to The Information, Alphabet has also entered into a multibillion-dollar chip deal with Meta (META).
NB: Alphabet Q1 sales grew 22% to $110 billion, with Cloud up 63% to $20 billion. Operating margins grew by 220 basis points, with services and cloud operating margins both increasing y/y.
The search business continues to benefit from AI. AI overviews and AI mode are sustaining as search sales grew 19%.
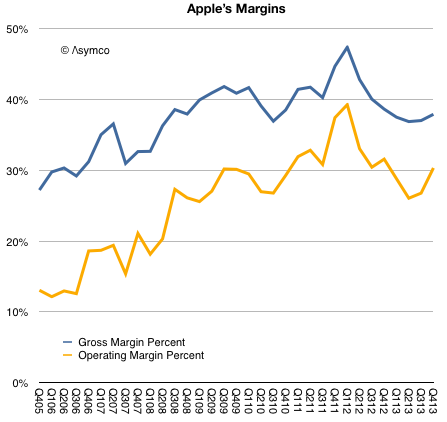
Prior to Apple's earnings report I read at least one article suggesting that the most important indicator to watch was Apple's margin. I suppose this was due to a recent decline in margins from a peak gross margin of 47.4% in Q1 2012 to 36.7%.
As the graph below shows, margins began to recover by Q3 2013 and are nearly on par with year-ago levels.
The guidance for the present quarter is a gross margin between 37% and 38%. This would imply a flat q/q GM line (blue line above.)
This is not quite catastrophic.
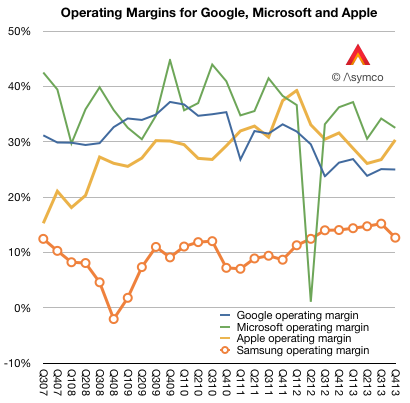
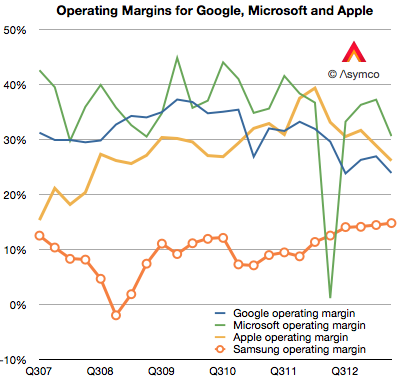
To better understand margins, it helps to compare them with other companies. When Apple reached that peak of near 50% gross margin I noted that such a level was higher than Microsoft's and Google's. The irony being that Apple was nominally an (implied) low-margin hardware company while Microsoft was an (implied) high-margin software company and Google was an (implied) high-margin internet services company.
Here is the picture with the last two years added:
In the last two years Apple's margins have declined but so have Google's. And although Microsoft's fell, they fell less than Apple's and thus overtook it to remain slightly more profitable (32.5% vs. 30.3%) into Q4.
I also added Samsung Electronics' operating margin. ((As a large conglomerate, Samsung will have a lower blended average. Separating the Telecom group's operating profit shows a 16.14% divisional operating margin.))
So although Apple stabilized, it did so at an extraordinarily high level, well out of band for a hardware company. Thus the question remains: Are Apple's margins a fluke? Is the recent rise of margins to levels far above those of a comparable hardware company and into the realm of software and services sustainable?
The simple answer is to assume that the iPhone and iPad, which make the bulk of revenues and which explain much of the rise, enjoyed a temporary buzz which allowed them to be priced at a premium but as that buzz wore off, the pricing and margins would decline. This is common with fads and fashions.
But the situation is far more nuanced. If the margins were due to mere novelty, the effect should not have persisted over so many years. Pricing data shows that the iPhone remains exceptionally valuable and that the iPad, excluding line extensions, has also held the line on pricing.
The missing piece in the puzzle is that the iPhone and iPad and iPod touch and Apple TV are pieces of an inter-dependent network of assets. The iTunes stores, Apple's services and Apple Retail are easily ignored because they are not "profit centers" but I believe they are a key component to the sustainment of these margins.
In other words, the iPhone and iPad enjoy margins not just because they are new and well designed. But also because they form part of a ecosystem. The key word is 'system'. The user buys into a system not just what the device embodies.
This is why I've always said that the iOS product businesses should be thought of as "hardware as a service". The inspiration comes from the notion of "software as a service" which posits the idea that software purchases should be thought of as services and thus recurring revenues.
iOS devices are part of a service matrix: the user experience in the stores, the after-sales support (including the easily ignored Applecare), the broadband supplied through operator service (which is part of a trillion dollars of value), the apps and content that can be purchased (which add up to a mountain of money), the network effects of iMessage and iCloud and now iRadio and Match and Siri.
These services attachments are well understood as great business models and underpin some of the most celebrated businesses to emerge in the last decade including Google, Amazon, Facebook, Box, Dropbox, Windows Live, etc.
It's curious therefore that whereas these other businesses are highly valued as services, in the case when the service is a component within a larger system, the value is missed. In an integrated context the connection between services and high margins is not understood. The reason may be the absence of robust systems analysis and a preference for the facile explanation.
Bill, I think the smartphone market has always been competitive. [Only] the names have been changed.
Tim Cook responding to Bill Shope's question on the competitive landscape, April, 2013.
Indeed, over the years, the companies considered Apple's primary competitor have been many.
In years gone by in the phone market there were RIM and Nokia and Palm and HTC. In the iPod era there was Creative and Sony and innumerable others long forgotten (not to mention the tyranny of DRM).
Even today we struggle to decide whether Apple competes with Google first or Samsung. Or perhaps with the iPad it's with Amazon or Microsoft. Or maybe iTunes is threatened by Netflix or Spotify. The Mac surely competes with HP and Dell and Toshiba. What about iCloud? Clearly it's Dropbox or Google Drive. iWork? Both Office and Google Docs.
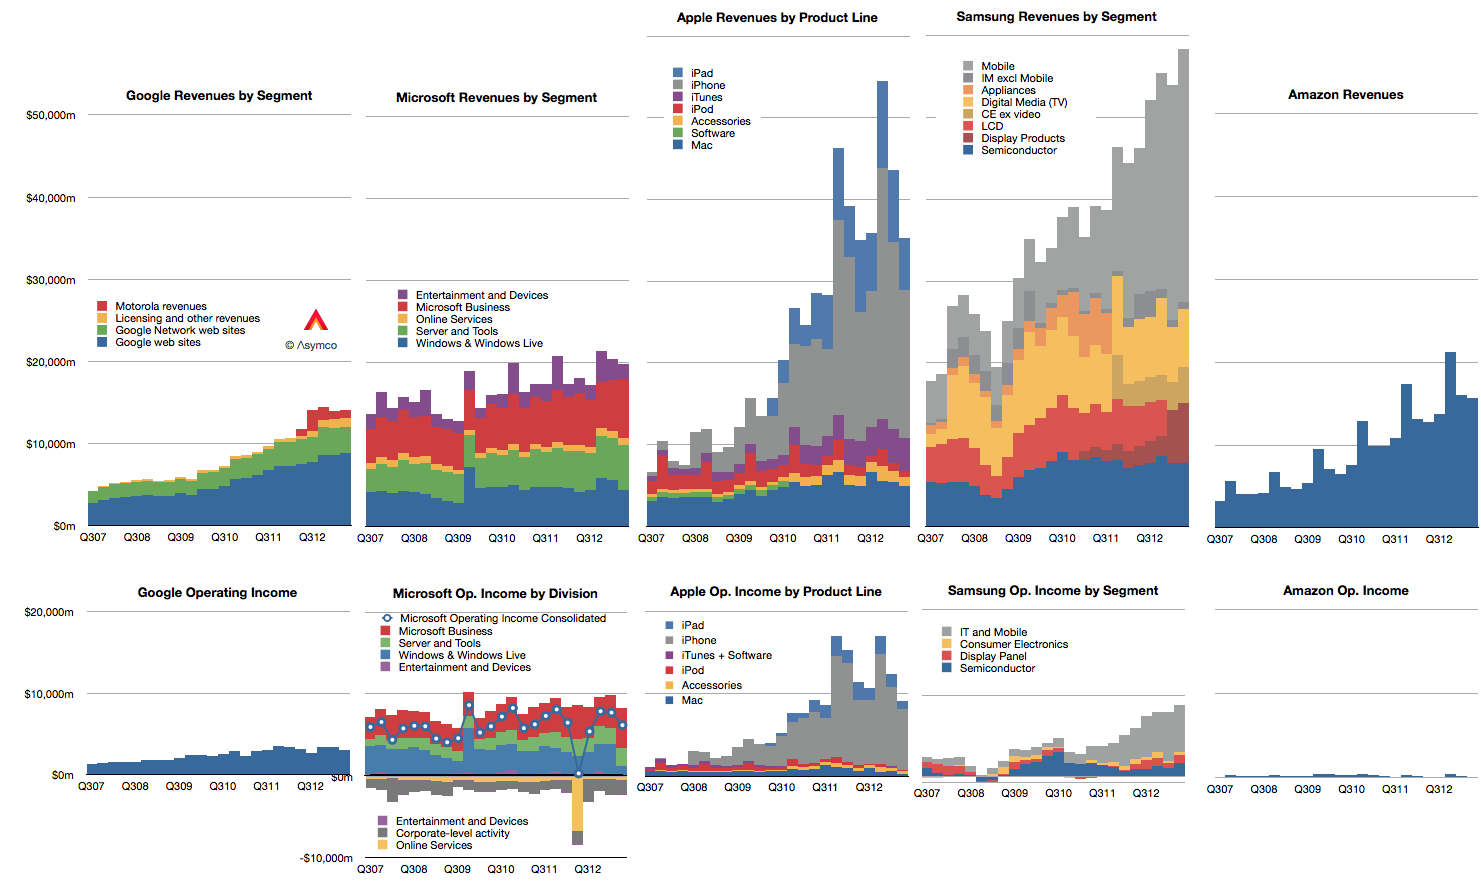
Doing a competitive analysis for Apple is then mostly a struggle of whom to compare it to. So forgive me that I only track the few challengers shown below.
Note also that these companies all may compete with Apple to some degree but they may not compete with each other. Competition, it seems, is not transitive.
There isn't much that I can observe in the data that hasn't already been observed. Google shows steady but not spectacular growth in revenues with decreasing margins. Microsoft shows even more modest growth in revenues with flat earnings. Apple growth is moderating from near vertical while earnings pause. Samsung has great growth but there is a similar set of doubts about its sustainability and finally, Amazon continues to grow the top line by 20% and has nothing to show for it.
Operating margins have mostly fallen with the exception of Samsung whose increasing reliance on smartphones has led to a modest increase, though not nearly to the level of the others. (Amazon, lacking in profits, cannot be compared.)
In summary there is little change to report.
Except that it's been reported that in the last quarter Samsung managed to "dethrone" Apple from the phone operating profit crown. This is a matter of estimates and for that we need to understand clearly the assumptions.
I estimate that this is not the case. That indeed Apple remains most profitable phone maker by a wide margin.
To estimate operating margins you need to estimate gross margin and the allocation of operating expenses (SG&A and R&D) to a particular "division" or product line. The problem is that Apple does not operate as a divisional organization so its marketing and R&D budgets (i.e. people) are not assigned permanently. You have to move them around based on whatever is being worked on at any given time.
What's more, we need to account for the huge SG&A costs associated with iTunes and Retail. They both consume vast resources which cannot be allocated directly to any product. There are 41,000 people working in retail. Also, some of the expenses for iTunes are overhead and cannot be considered cost of sales. That's also SG&A. Then there's corp research and design (Mansfield and Ive), which are not allocated to any particular product. When you slice out these costs, there is very little to apply to iPhone, etc.
So if (and it's a big, sanctimonious if) you want to cast iPhone out as a separate business unit, it would be wildly profitable. There is a huge gross margin of 46% (this assumes a cost per unit of $316) and only another 5% of sales spent on engineering and marketing leaves a 41% operating margin or $7.4 billion. (Why only 5%? Because there's only 10.8% to allocate and after taking out iTunes, Retail you're really only left with 4.49% for SG&A and 3.3% for R&D or 7.79% so 5% is about two thirds of the operating budget).
If you take all of Samsung's IM division which is PCs, Tablets and phones their operating profit was only $5.6 billion.
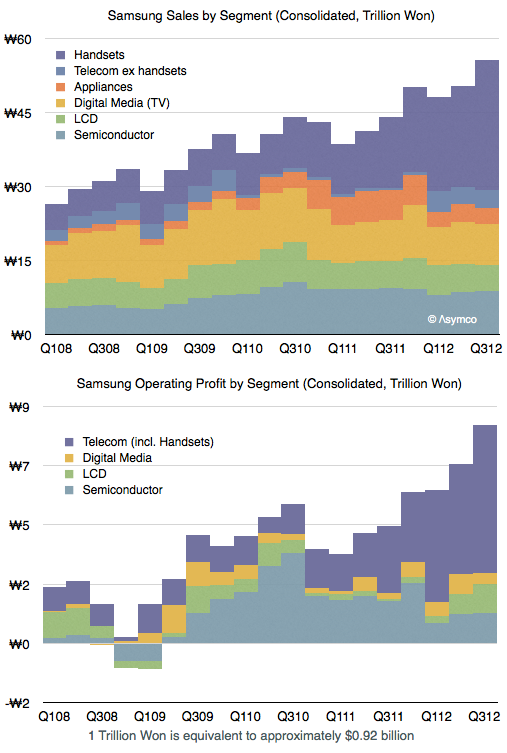
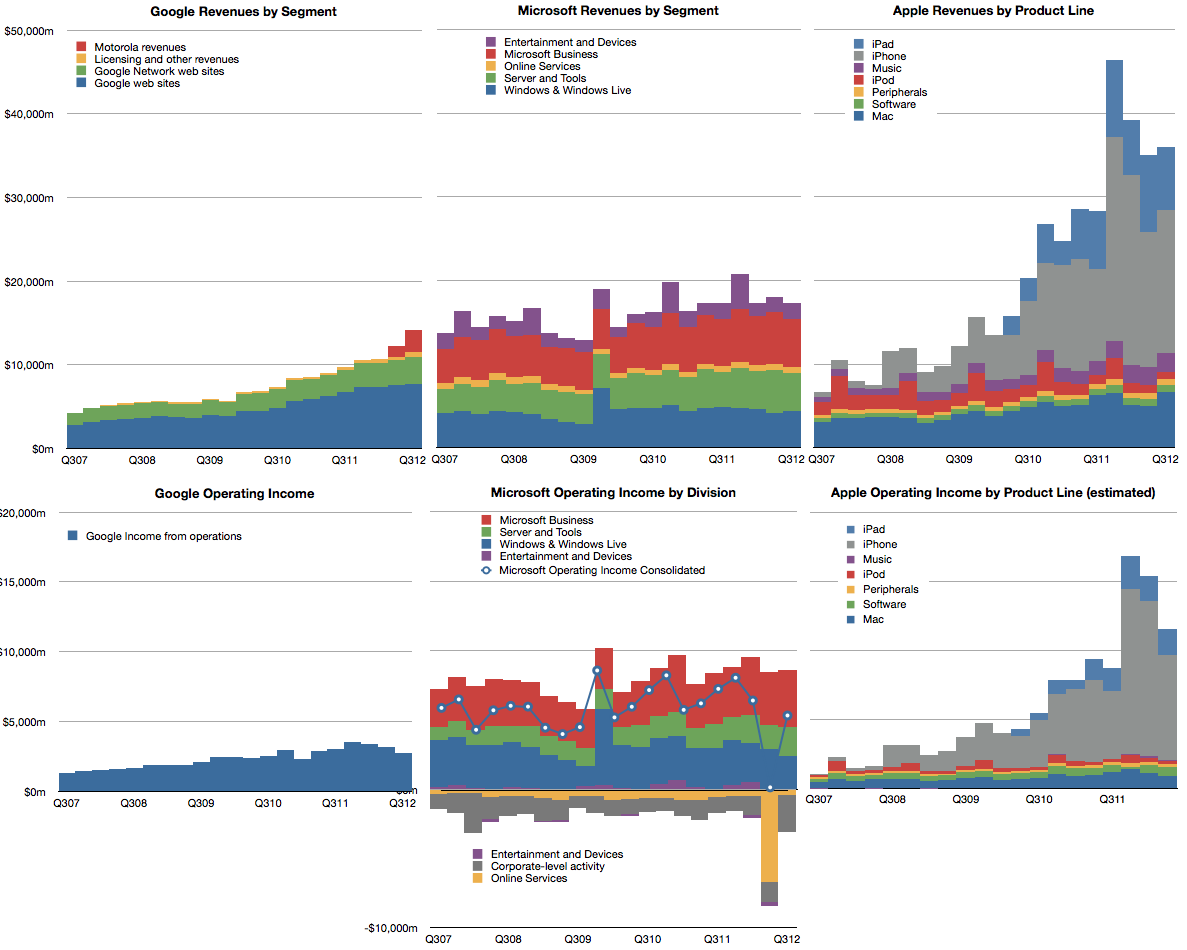
You can see the difference in the grey areas of operating profit in the first graph above.
Bear in mind that this is still an artificial comparison. The split of profit between product groups is not only an estimate by the analyst, it would be an estimate for Apple itself since it has only one P/L.
The Windows PC market is contracting. The market data has been showing unit shipment declining for some time with the latest quarter having perhaps the steepest decline for two decades.
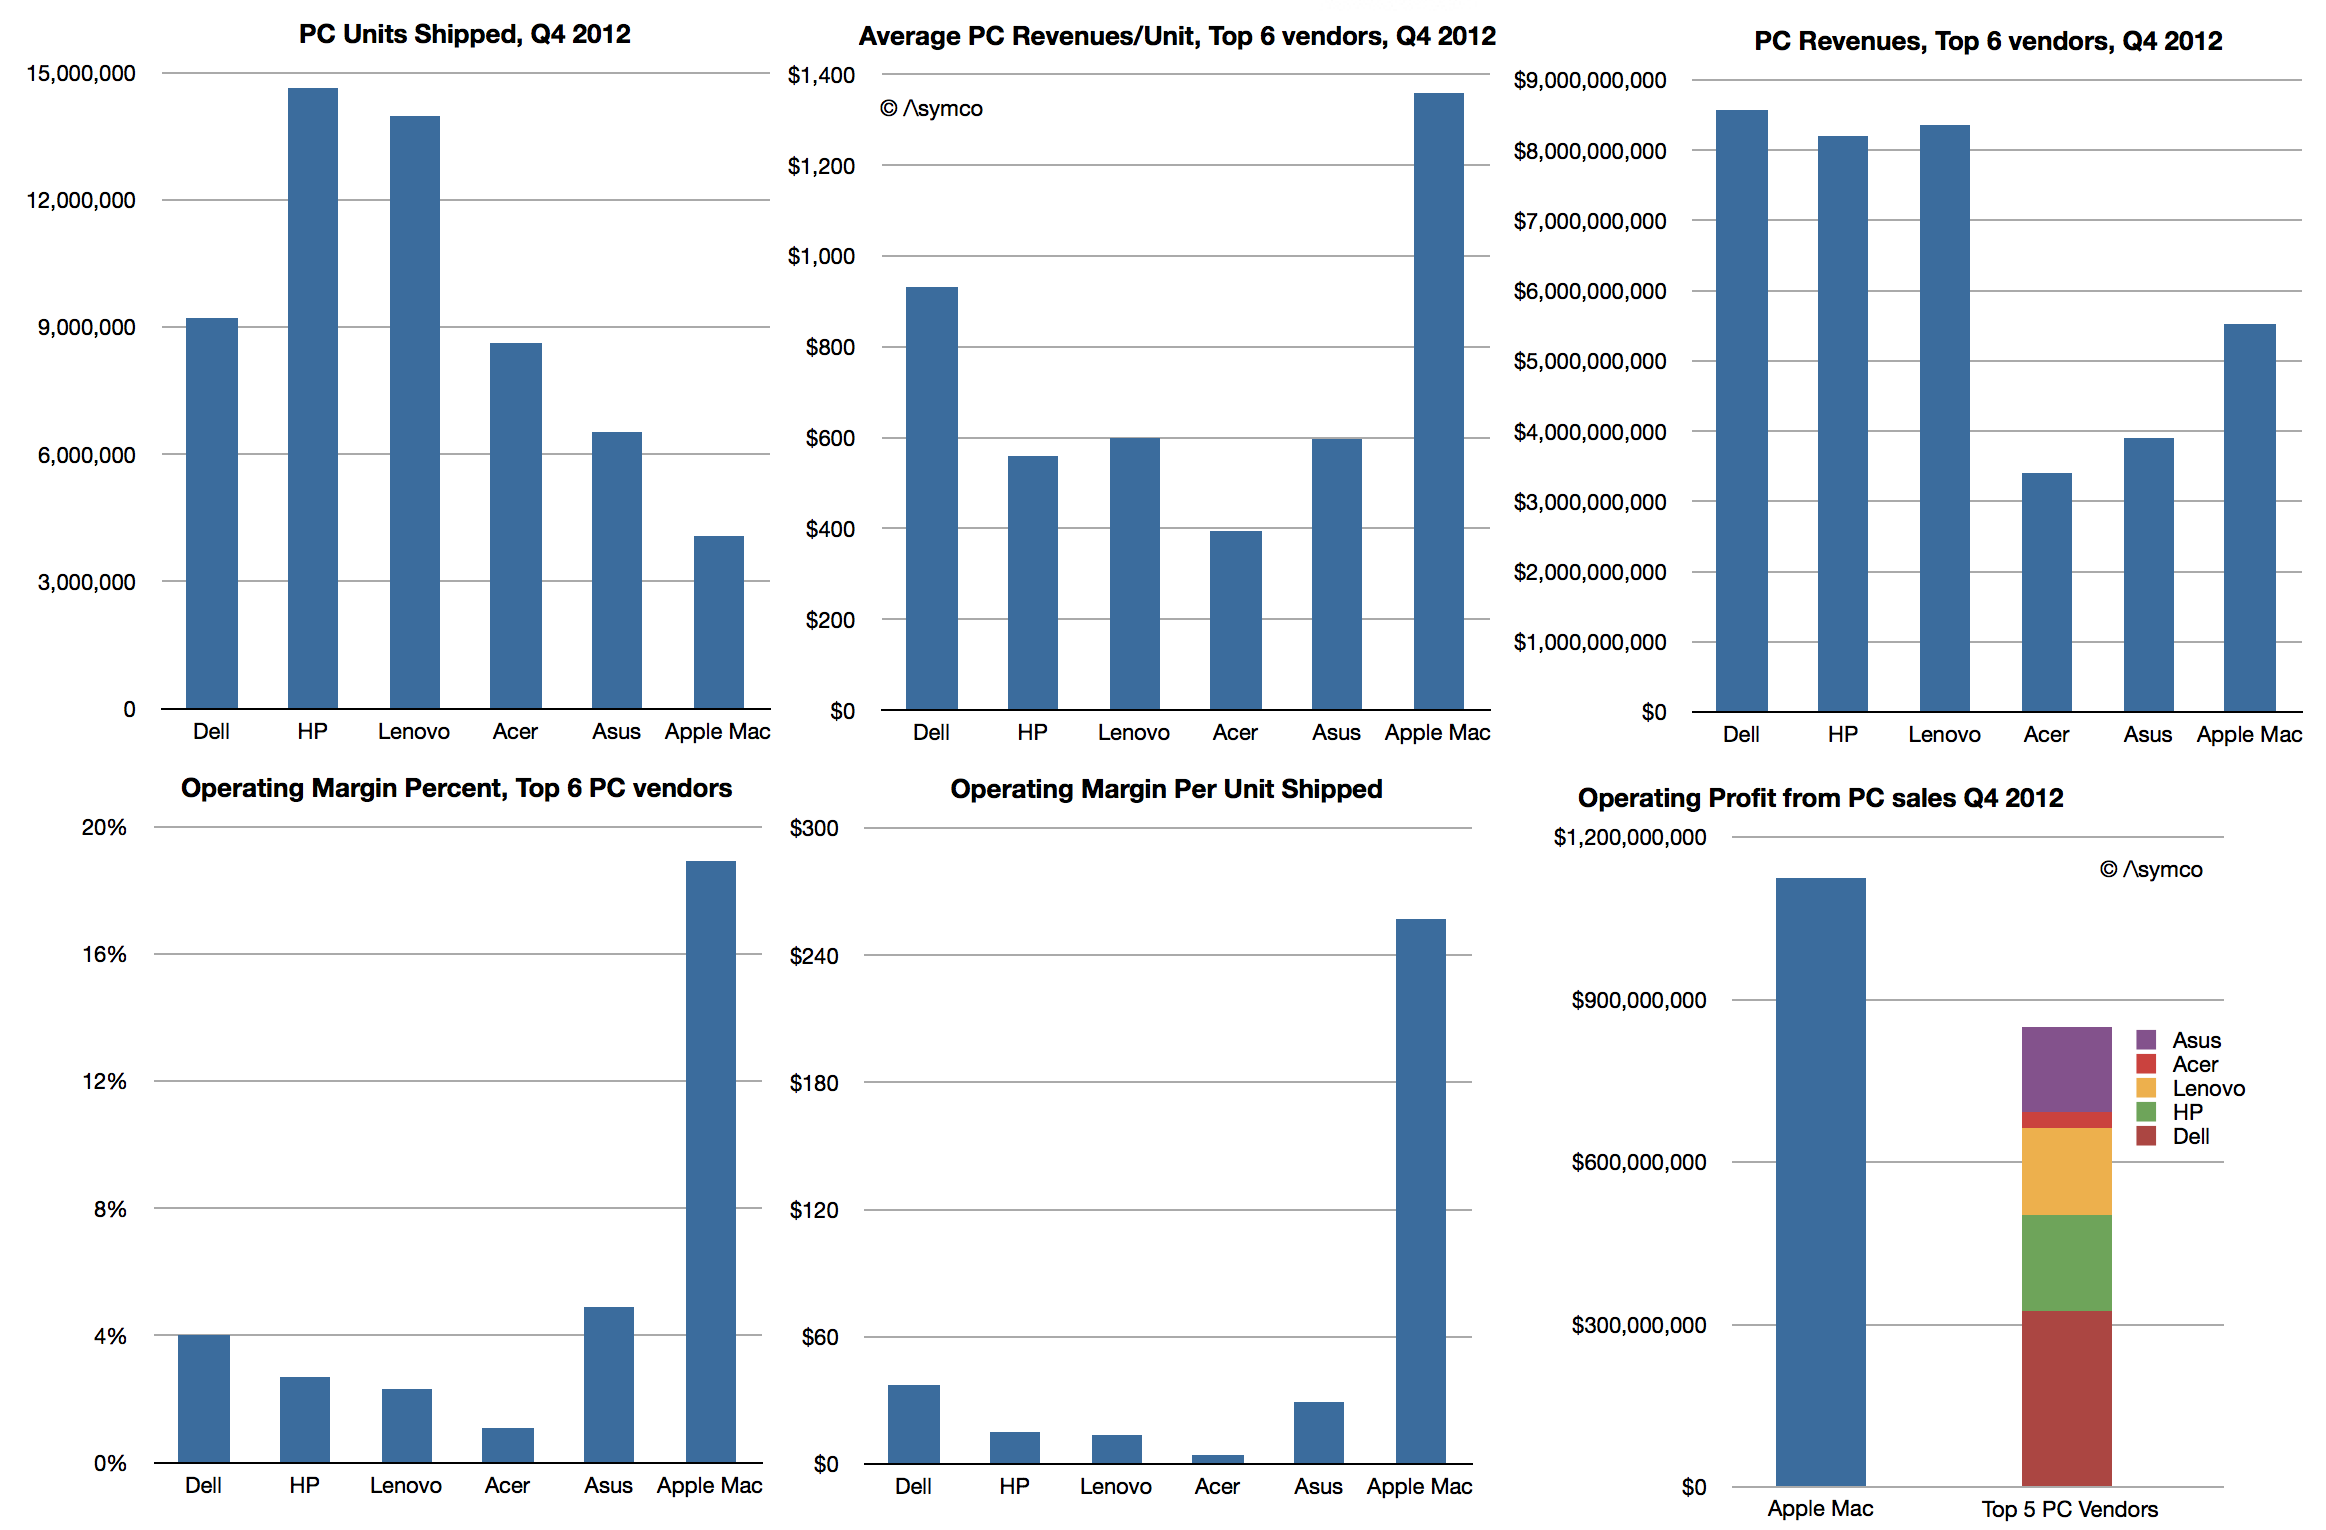
What remains undocumented however is how the market looks when considering economic value. A more complete picture would be to show revenues, average selling price (or revenue/unit), operating margins/unit and percent of profit capture.
The data is not beyond reach however. It involves combining the shipment estimates from e.g. Gartner with financial reports from the companies themselves. Some analysis is required to estimate margins but they are also not hard to obtain (e.g. from third parties.)
So here is a view of the market for the fourth quarter 2012:
The only inference I made was with respect to Apple's margins for the Mac. These are based on deriving a gross margin of 26% and adding an estimate of the SG&A and R&D "overhead" of 7.1% of sales, a figure which applies to the entire company. This yield an operating margin of 18.9%.
If this estimate is considered then the operating profits from PC operations imply that Apple generates more profit than all the top 5 PC vendors combined.
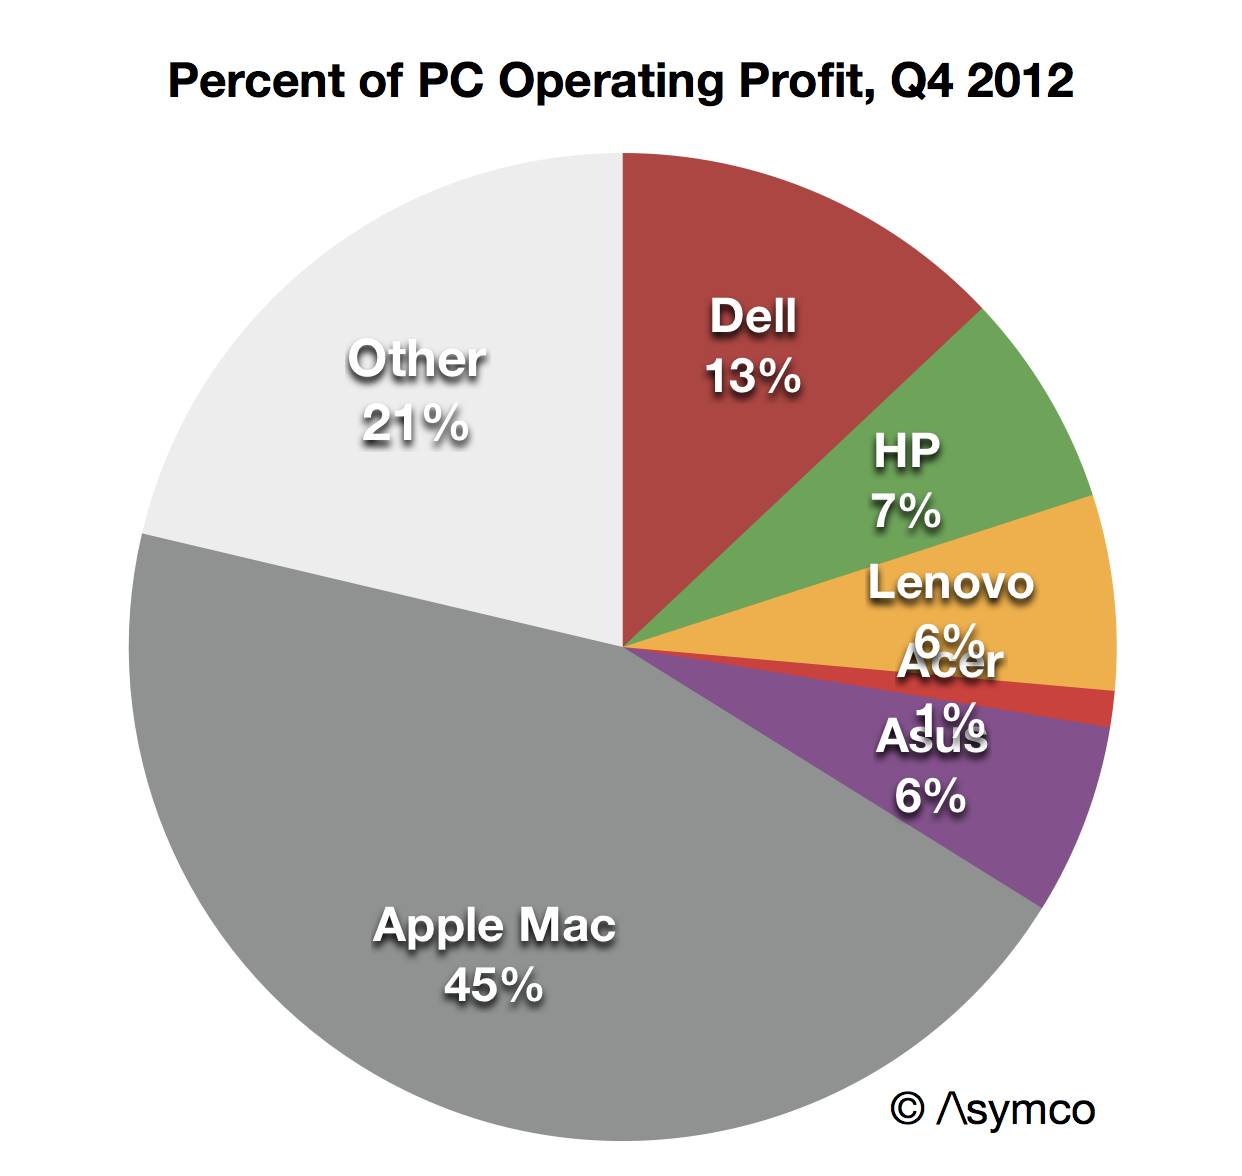
Assuming further that "other" vendors have the same profitability ratio as the top 5 combined yields a figure of 45% "profit capture of PC market" for Apple. This is not as good as its performance in the phone market, where Apple has about 72%, but it's not bad.
The real problem for the PC vendors is not that they have such low margins–they've had low margins for decades. It's that the volumes which "made up for" low margins are disappearing. Apple is not immune to a gradual erosion of Mac volumes, but they have positioned themselves for growth with devices and content commerce and services. They have essentially "escaped" PCs and indeed caused the need to escape in the first place.
The problem is what could the others do? It seems all they can do is depend on Microsoft getting their strategy right.
As part of a continuing series on the iTunes economy I described how iTunes fits within Apple's overall revenue and cost structure. The operation is a modest contributor accounting for single-digits percent of revenue and operating margins.
One additional question is how does iTunes compare with other non-Apple retail businesses. The obvious comparable businesses are Google Play and Amazon's digital content businesses. Unfortunately we can't compare iTunes with Google Play because Google does not reveal any details about Play revenues (or units sold/downloaded or payments to developers or any other data.)
Also unfortunately, we can't compare iTunes with Amazon digital sales because Amazon does not provide that detail either.
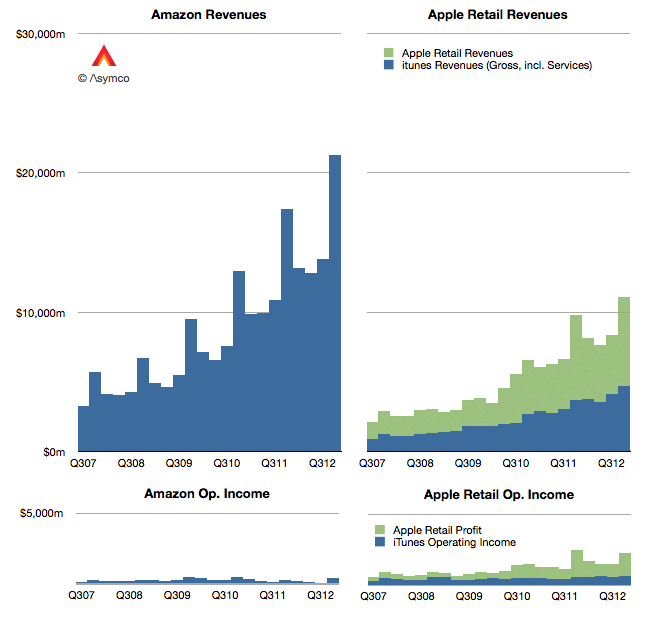
What we do have is Amazon's overall revenues (and operating margin.) So that's what I have compared:
Since we have Amazon's overall retail revenues it seemed fitting to also add Apple's physical store retail data on top of iTunes for additional perspective.
Here are some observations:
Since 2008, Amazon's sales grew by a factor of 2.18. Apple's combined iTunes+Retail grew by 2.14x.
Apple's gross retail revenue was $11.1 billion in Q4, 52% of Amazon's overall revenues.
Apple's operating income from retail in 2012 was $6.8 billion, over ten times Amazon's $676 million.
Although Apple's overall retail operations are only about half of Amazon's they are far more profitable on an operating level. They are also growing at a similar pace. Amazon as an equity is priced at approximately twice sales. By that ratio, Apple's retail business would be worth $70 billion. Of course, that valuation presumes that, as with Amazon, operating profits are disposable.
The following is another excerpt from a report titled "iTunes Business Review" which will soon be available for purchase through the Asymco Store. If you are interested in the product please get in touch.
---
iTunes store will be 10 years old next month. From its inception Apple has stated that it aims to run the store "at break-even". The business has grown so rapidly however that its profit-free nature has come under severe pressure.
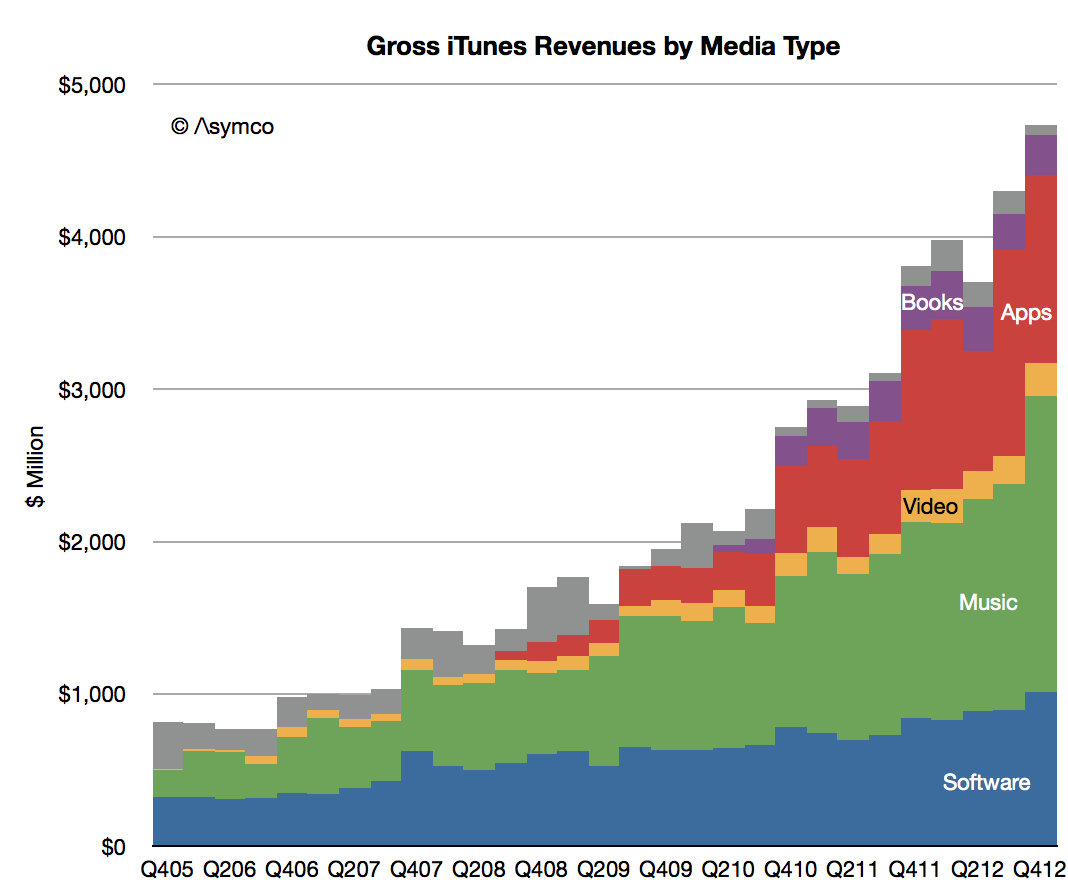
The reasoning goes that as more media types have been added costs have increased but revenues have increased even faster. Consider the estimated gross revenue base as shown below:
What is known as iTunes today has quintupled in seven years. Although cost of content sales are likely to have been preserved as a ratio (about 30%) the vastness of transaction volume (estimated at 23 billion item transactions in 2012 alone) implies that there are some significant economies of scale.
This implies that the operating costs are spread more evenly and that therefore the possibility exists for some operating margin.
Put another way, at break-even the cost of operating iTunes stores would be about $3.75 billion. It's hard to imagine this level of operational expense for digital content.
For this reason, management has begun since 2010 to suggest that at least the App Store is run "a little over break-even". How little is a good question. A one percent operating margin (from gross revenues) would imply as much as $45 million margin. I estimate 2% is possible on Apps and 1% on Music.
That's $150 million in margin content. Heady stuff.
However, since folding its Software group into iTunes (the blue area in the graph above) the margin picture changes dramatically.
The Software group is one of the forgotten heroes of Apple.
Apple’s software division “Apple Software” is responsible for the following products:
iWork which includes Pages, Numbers and Keynote. These are available through the Mac App store at about $20 per product and the iOS App Store for $10.
iLife which includes iMovie, iTunes, iPhoto, GarageBand. The OS X versions are available free with new computers but they are also available as paid downloads for OS X through the Mac App Store at $15 each and for iOS devices through the App store at $4.99 per app.
OS products including downloads of iOS and OS X. These are mostly free but some OS X updates are not free (typically $19.99 for new version including the server version of OS X.)
Professional tools which include the following products: Final Cut Pro (Video editor $299.99), Logic Pro (Music editor $199.99), Aperture (Professional Photo workflow $79.99), Compressor (additional features for Final Cut Pro $49.99), Motion (video transition editing for Final Cut Pro $49.99)
Administration and development tools which include: Xcode integrated development environment which is free Apple Remote Desktop which is priced at $79.99.
All these products are now sold through either iTunes App Store or Mac App Store. They used to be sold as traditional boxed software for many years but Apple has transitioned them all to be download-only and folded them into the catalog of third party apps while lowering prices.
My estimate is that Apple’s own software generated $3.6 billion in Revenues in 2012. As you can imagine, this is a high margin business which grows at nearly 20%/yr. Although I estimate that the software business has been overtaken by the Apps and Music businesses in gross revenues, it keeps an operating margin similar to that of Microsoft or about 50%.
This means that iTunes inclusive of Apple's own Software generates as much as 15% operating margin on gross revenues. That's over $2 billion a year.
The International Federation of the Phonographic Industry (IFPI) reported that global digital revenues were $5.6 billion in 2012. This represented about 9% growth from 2011 and accounted for 34% of total industry revenues[1].
Apple regularly reports iTunes as a separate revenue item and occasionally it also reports payments data for developers and app download rates. By interpolating the data published and combining it with some assumptions it's possible to estimate the mix of revenues (and costs) associated with iTunes.
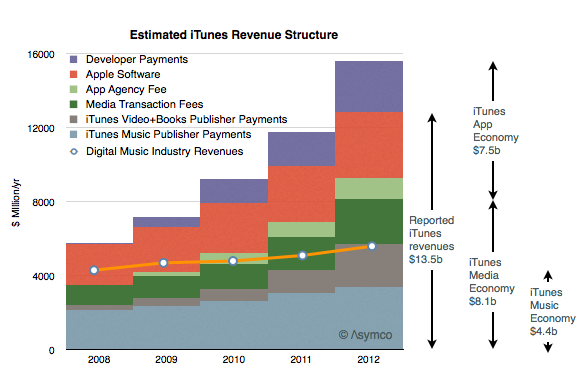
My yearly estimates are summarized below.
Note that I also included historic digital music industry revenues (as a line). I also included the following summary items:
iTunes reported revenues were $13.5 billion (including Apple's own software sales)
iTunes gross revenues were about $15.6 billion (including payments to developers)
The iOS and OSX "App Economy" was about $7.5 billion while the iTunes "Media Economy" was about $8.1 billion (both figures include transaction costs.)
The iTunes Music economy was $4.3 billion of which $3.4b was paid to music labels.[2]
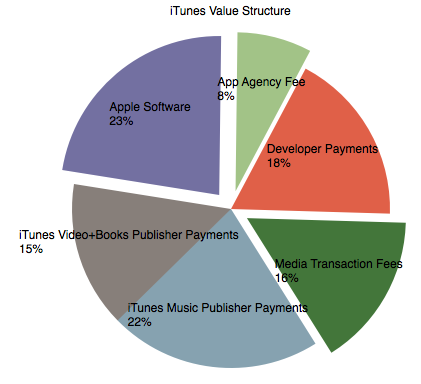
In terms of percent of total value the components are:
Looking at growth, these estimates imply that App revenues are growing at about 50% while iTunes Music is at 10% and Video+other at 90%.
Looking at profitability, there is potential for operating margin in Apple Software and App Agency Fees and perhaps some of the Media Transaction Fees (exploded wedges above). Historically, Apple suggested that their App and Media stores ran at break-even but that may no longer be the case. Operating margins from Software may be significant.
---
Notes:
These revenues were from recorded music and don't include live performance
My estimate for the iTunes Music payments to publishers is equivalent to about 60% of total industry revenues.
In the post "Google vs. Samsung" I compared the profits of Google and Samsung Electronics' mobile (aka Telecoms) division. It showed how Samsung has grown its mobile business to such a degree that, if sustained, could conceivably influence the way Android is controlled.
However, we should not analyze Samsung's mobile group in isolation of the entire company. Samsung relies on internal transfer of technology and capacities of production which are quite unique for device vendors today. In other words, Samsung is a relatively integrated enterprise. Understanding the whole is necessary before understanding the part.
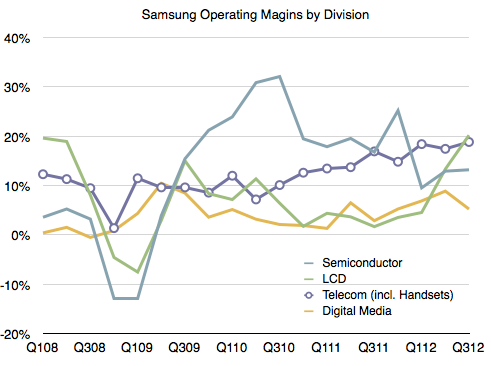
The following graph shows the sales and operating profit for Samsung Electronics as a composite of its divisions since early 2008.
As one would expect, the mobile group (Telecom) is the source of both top and bottom line growth. The group has also been leading in terms of margins and increasing those margins steadily.
The margins averaged 11% during 2007 and 17% during the trailing four quarters. This 54% increase in margin has been matched by a 55% increase in average selling price (from $151 in 2007 to $234 in the latest quarter).
One could argue however that a 17% operating margin from a group that is now leading in volume and price is still a bit weak. At its peak Nokia enjoyed a 25% operating margin, RIM 30% and HTC 27%. Apple's iPhone operating margin is around 45%.
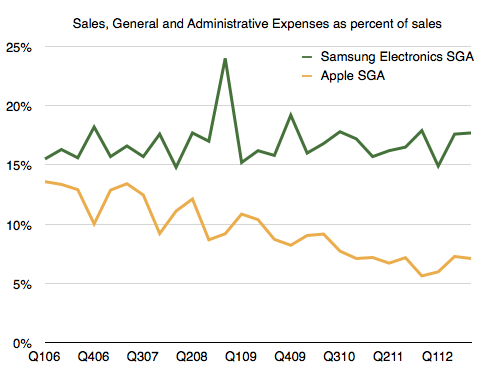
I think a large part of the margin story is a relatively high level of spending on SG&A (Sales, General and Administrative) which includes advertising, sales promotion and commissions. In the case of Samsung Electronics, as sales has grown these expenses have grown in proportion. As a percent of sales SG&A have held relatively steady at around 17%.
Note that as Apple's sales have grown its SG&A has grown less rapidly resulting in a smaller percent over time. We might see Apple's SG&A drop to 5% during the present quarter, an all-time low.
So one of the more remarkable aspects of Samsung's success has been their willingness to increase promotional spending. Considering that their other divisions don't require as much "marketing expense" (semiconductors, LCD certainly, and TVs and Appliances to a lesser degree due to a smaller sales growth) we can imagine that the vast majority of this promotional spending has been in support of their mobile brands, Galaxy in particular.
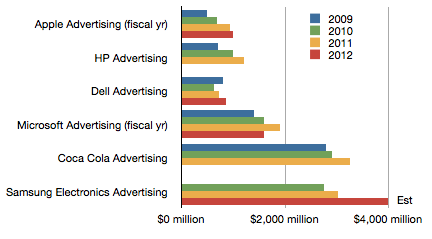
In fact, we can obtain advertising spend data from annual reports.
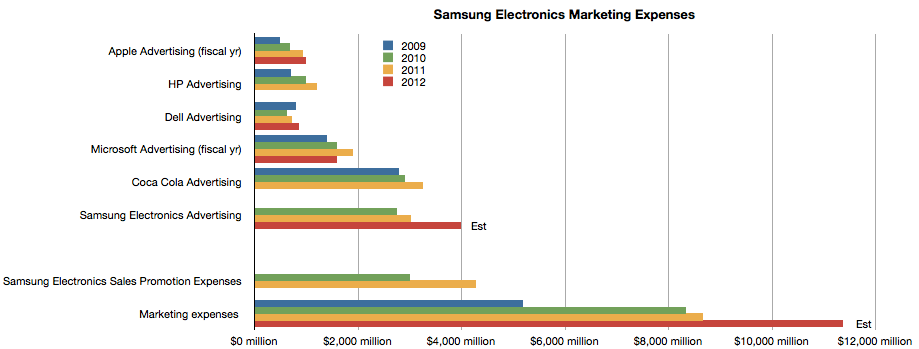
The chart above shows comparable ad spending from a cohort of technology companies as well as Coca Cola and Samsung Electronics.
It might be surprising to note that Samsung spends considerably more than Apple and Microsoft. But it also spends more than Coca Cola, a company whose primary cost of sales is advertising.
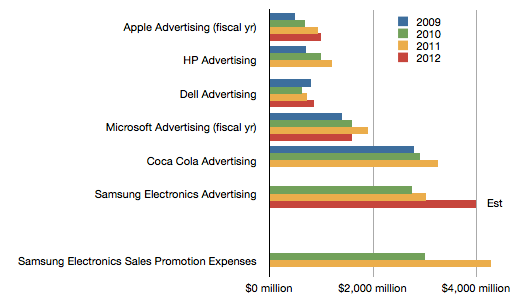
However, advertising is not the only form of promotional spending. Samsung also pays commissions and "sales promotion". The following chart shows the value of these sales promotions relative to the ad spending budgets above.
We don't have data on the current year since that is released after year's end, but it's interesting to note that promotions cost more than ads, which themselves are substantial relative to other companies.
The company also reports "Marketing Expenses" every quarter[1]. These figures appear to be the sum of Ad spending, Sales Promotions, Public Relations and a portion of "other" expenses as a part of SG&A.
When considering all marketing expenses, Samsung Electronics' sales efforts begin to look quite astonishing.
---
Notes:
The data used in the latter three charts are available as a Google spreadsheet here.
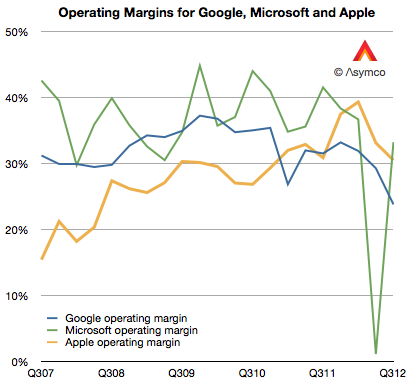
Google's operating margins fell to 23.7% last quarter. This level is the lowest I'm aware of. From 2007 to late 2009 margin went from about 31% to about 37%. Then from early 2010 until present they fell. The history is shown the the following graph.
[I included Microsoft and Apple operating margins for comparison.]
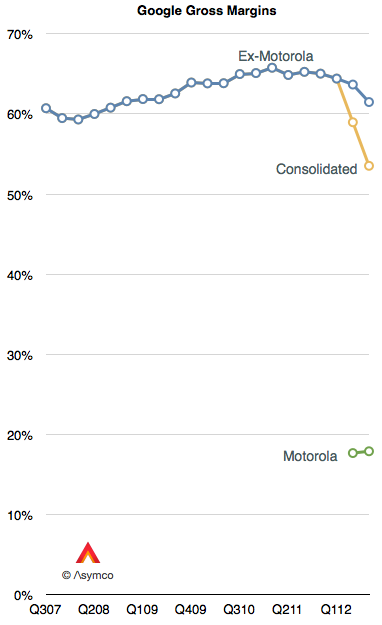
Some of the recent decline is due to the inclusion of Motorola into consolidated earnings. Motorola gross margins were therefore 18%. Excluding Motorola, Google gross margins (Revenues-Cost of Revenues) were 61.5% of revenues. However, even excluding Motorola, Google's core margins dropped.
One reason for the decline in core margins is the reduction in cost per click (-16% for search and -18% for network sites.) This is what Google pays to partners for access to traffic. The trend is not new. It was first discussed in January.
The bottom line is that an individual click is not as valuable as it used to be. Would a larger volume of mobile usage be a reason? Google won't say.
The overall result in the bottom line is shown below. Microsoft and Apple are again put forward for comparison.
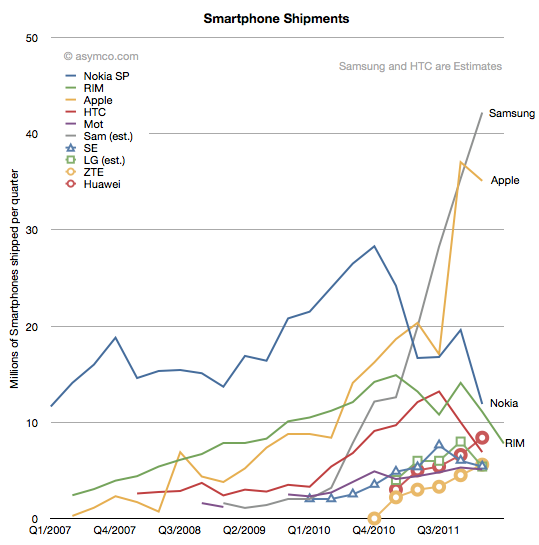
The number of BlackBerry phones sold fell 41% year-on-year in the last RIM fiscal quarter. Sequentially the fall was 30%. Though surprisingly poor, I note that Nokia's smartphone business fell even more dramatically last quarter (down 50% y/y and 39% sequentially). LG also saw a 44% decline in unit shipments in Q1.
The history of smartphone shipments for the largest vendors is shown in the following chart:
From forecasts made by Huawei it's probable that they overtook RIM in the last quarter, dropping RIM to 5th or 6th ranked vendor in smartphone units.
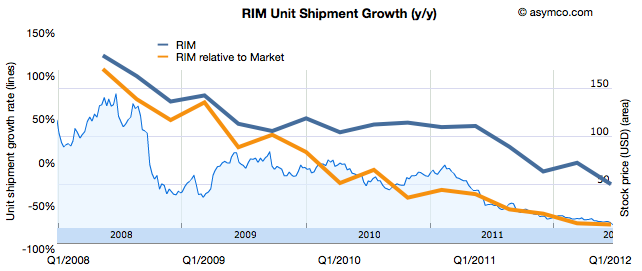
RIM's 7.8 million units is the same level of sales as it had in early 2009. The total market was only about 250 million units per quarter then. It's around 400 million today. A quick calculation shows that RIM's smartphone market share has fallen from a peak of 22% to about 6%.
RIM's stock performance reflects this performance relative to the market.
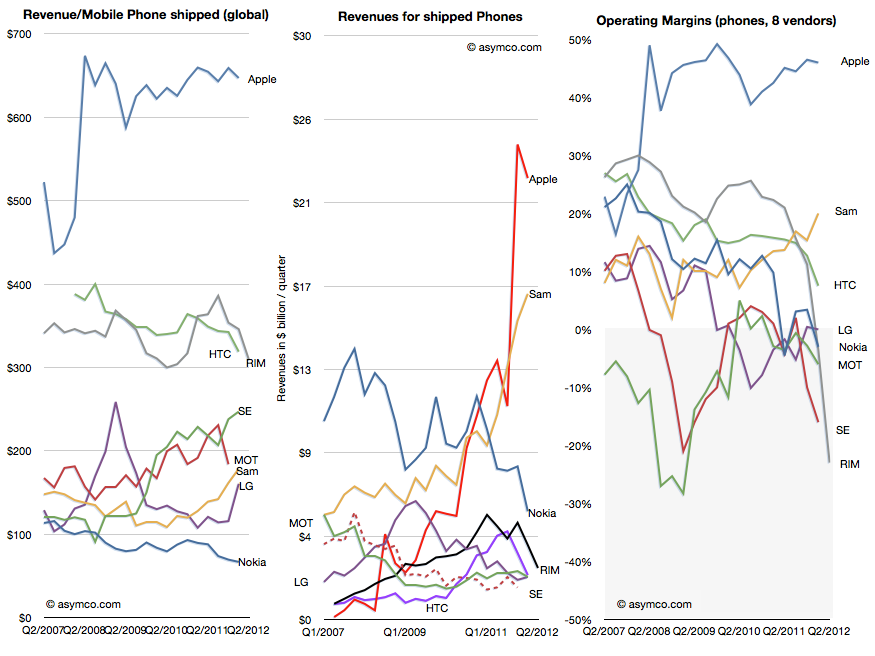
Hardware revenues were $1.652 billion. Matt Richman calculates the average hardware revenues for the BlackBerry of $203. I include service revenues in my ASP calculations (for Nokia and Apple these are also significant values) yielding $309 per BlackBerry. The history of total revenues, revenues per phone and operating margins are shown below relative to competitors.
Operating margin tells the most sobering story. As I've often repeated, historically no company has survived dipping into the grey zone.
To reiterate, the logic of irrevocability in this industry is as follows:
Success depends on three conditions being met by the vendor's products:
consumers trust the platform's promise
operator see the product as creating value to their core business
developers offer investment to innovate on top of the platform
If all these factors are present, the vendor enjoys a virtuous cycle of growth. If any of these is lost, the others are also likely to be lost as well creating a vicious cycle of decline.
Loss of operating margin is an early indicator that at least one condition is not met. Usually, a failure of consumer trust leads to a drop in purchases which leads operators and distributors and retailers to flee and then developers defect.
It's been impossible to recover from this tailspin so far. There is a procedure which works in theory: accelerate downward by investing in a new platform. The move is counter-intuitive but essential in re-building trust, quality and relationships.
However, the reason it does not work in practice is that this struggle is not with gravity alone. While spinning downward, the company is also subject to competitive attack. Competitors fill the void and take customers into locked-in ecosystems. There is neither the time nor the ability to defend.
Cash runs out and customers are divided up between the survivors. Nokia and RIM face this scenario today.
In the iPhone cost structure analysis I showed how revenues and costs for iPhone are probably allocated. The revenue per iPhone was shown to include $29 for revenue items "above" the price of the phone to the channel. This total includes Apple's own iPhone accessory sales plus revenue from licensing the "Made for iPhone" trademark to third party accessory makers. Apple also receives some revenues from cloud services. But, pertinent to our recent discussions on the Android business model, Apple also receives revenues from Google.
Wouldn't it be nice to know how much? Here's a way we can estimate it.
I've read an estimate that 50% to 60% of ad revenues from Google search initiated via iOS are paid to Apple. This is believable because the TAC for Google overall is about 40% and Apple probably drove a hard bargain to get a premium for its, presumably, premium traffic.
So if we knew the revenue run rate for Android search on a per device basis we could perhaps guess how much of each phone's revenue comes from Google. What we've heard last year in Congressional testimony is that two thirds of its mobile revenues come from iOS devices. This would imply that the run rate for iOS would be 2x the run rate for Android.
Having a model of Android revenues helps at this point. Assuming Google obtains $4.4 from Android (excluding AdMob and App sales) and assuming negligible other mobile revenues from other platforms gives a possible Google revenue per iOS device per year of nearly $9.
Taking the lower bound of the revenue share estimate above means that half of Google's revenue goes to Apple or $4.4/iOS device/year or $9 over the two year life of the device.
That would put revenue from Google at about 1.4% of iPhone revenues (see average revenue per iPhone here). And that revenue comes without any costs and so flows straight to the bottom line. That, in turn, would imply that 3% of Apple's operating margin is provided by Google. Not a bad deal considering that some phone vendors can't get that for their entire product line.
The interesting factors at work here are that this contribution by Google to Apple is higher than the contribution by Android to Google. In yesterday's post, I calculated that in 2011 Android contributed about $590 million to Google's operating margin (5% of total).
If we consider that Google pays Apple $9[1] for every iOS device and since Apple sold 156 million iOS devices in 2011 then Apple received $1.4 billion from Google, all of which went to the bottom line.
$1.4 billion from Google to Apple vs. $600 million from Android to Google. Three percent contribution of Google to iPhone profits vs. 5% contribution of Android to Google's profits.
This sets up all kinds of game theorizing which will undoubtedly entertain and enrich us all.
---
Notes:
Perhaps this $9 value is not valid for all devices. Perhaps iPod touch does not get a lot of traffic and is less valuable. Perhaps iPads get more traffic and are worth more. On average, this may be plausible.