Asymco

Asymmetric Intelligence

P/E

  1. Apple's growth vs. top 10 largest market caps

    Research · 33 comments

    Apple's stock price has been rising. Although it's still priced at a P/E of 22 while facing near term EPS growth well above 50%, this is belated recognition of the potential of the iPad and the iPhone.

    However, as it has grown, Apple's valuation is now not only higher than any other technology company but it's nearly the most valuable company on the planet. There is a theory that ultra-large market caps are reserved for companies that are past their prime. Sometimes this is attributed to the law of large numbers: that conclusion that big numbers cannot grow much bigger because compounding growth is exponential whereas markets are limited and become quickly saturated.

    The trouble with this theory is that "large" is relative; large is often simply "the largest". Large market caps are not what they used to be. During past booms, large caps touched a trillion dollars. Today, the largest market cap is merely $314 billion.

    So I don't put much faith in large number "laws". The real question of under/over-valuation rests on whether the company is growing or not. Valuation is simply the net present value of future free cash flows (plus assets). So the most important determinant of current value is growth in cash flows.

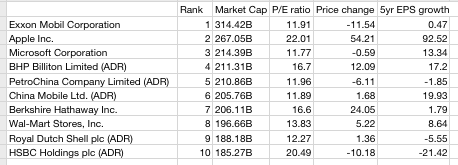
    It's fairly easy to assess this: compare P/E which is a proxy for valuation with EPS growth. The following chart does this for the top ten largest market caps traded on US exchanges (as listed by finance.google.com).
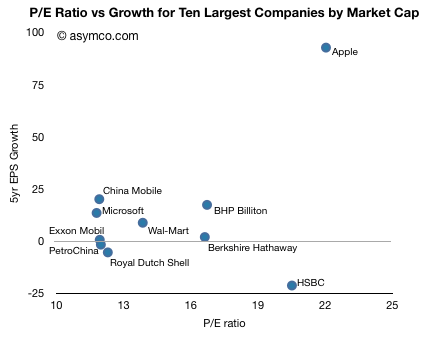
    One should see some correlation between the two variables, but given the 5 year time frame, many of these companies showed large volatility. There are outliers like HSBC which has a rapidly rising value even though it was badly affected by the credit crunch.

    The other outlier is Apple. The company showed 93 percent EPS growth over a five year period and has a P/E of 22. The company with the next highest total value (Exxon Mobil) had 0.5% growth with a P/E of 12. The company with the next lowest total value (Microsoft) had 13.3 percent growth with a P/E of 12.

    For an ultra-large cap, Apple's growth is unprecedented and extraordinary. It's in fact off the scale. The average growth of the other 9 top caps is 3.6 percent!

    Apple's growth is a factor of 25x higher. The P/E is only 1.6x higher.

    The result has been a much higher appreciation in the stock price as shown in the following chart.
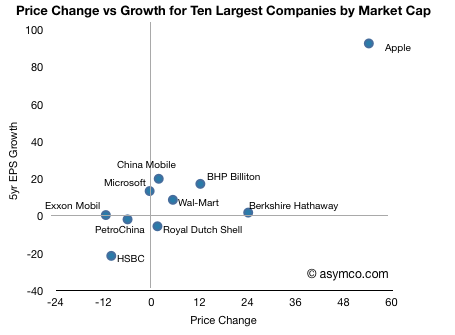
    So it's clear that Apple, in this peer group, is far from ordinary.

    Data follows:
  2. Apple's Valuation Struggle Continues

    Research · 11 comments

    asymco | Apple's Valuation Struggle.

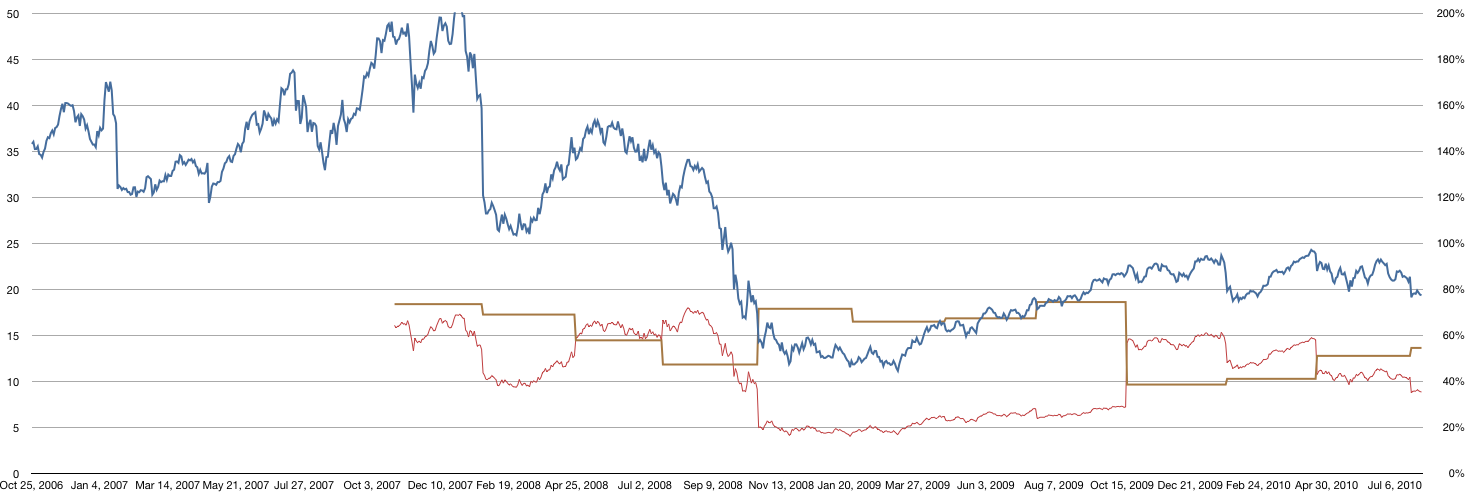
    As despondency over Apple's 75% earnings growth rate continues, it's time to revisit the historic P/E in contrast to growth for the company's earnings.

    The latest chart (below) shows the company's P/E ratio (in blue, left scale) vs. the trailing twelve months rolling growth rate (in brown, right scale) and the ratio between these two (in red, right scale).

    The red line can be considered a form of PEG (Price over Earnings over Growth) with the caveat the the Growth is trailing not forward and hence is based on actual data not fictional analyst "consensus".  I call this PETG (Price over earnings over trailing growth).

    The actuals show that Apple's price to trailing growth ratio is dropping to lows unseen since last year when the recession was still in effect.  At PETG below 20 the predominant sentiment displayed is extreme pessimism. 100 could be considered an even balance between pessimism and optimism. It now stands at 35.

  3. Apple considered less valuable than the average S&P 500 company [Updated]

    Research · 4 comments

    Apple just reached a new all-time closing high.  It's remarkable that so soon after a recession the stock is enjoying new highs.  The Dow would have to gain 40% to make the same claim.

    So some may ask whether Apple's stock is getting ahead of itself.  Perhaps it's showing signs of "irrational exuberance".

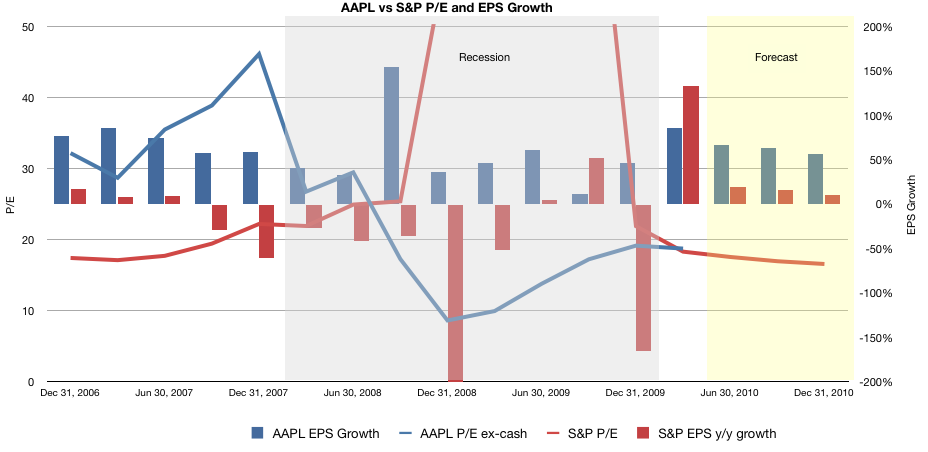
    This is not the case.  In fact, the stock is showing signs of irrational despondency.  This is demonstrated with the following graph.

    It shows AAPL Price (ex-cash) over Earnings vs. S&P P/E  (blue and red lines respectively on the left scale) overlaid with AAPL and S&P EPS growth (blue and red bars respectively on the right scale). I added grey shading to represent the recession period and yellow shading for the forecast period.

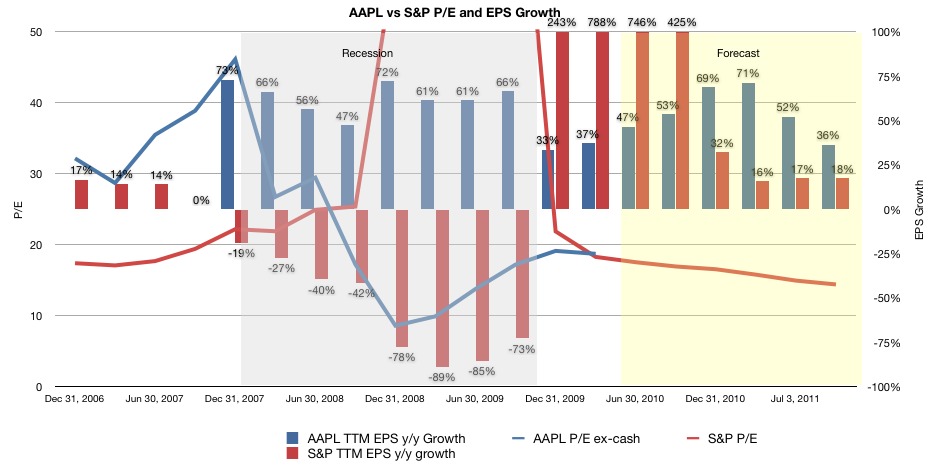
    [Updated] The same data is shown in the following graph where I used a 12 month rolling window (trailing twelve months) for the year-on-year growth to smooth out quarterly anomalies as per suggestion from Deagol in comments.

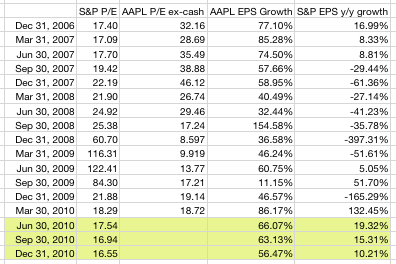
    Note how S&P earnings were indeed in a state of severe decline during the recession, and how the P/E gyrated wildly as a result. (I've had to clip the actual values in the graph for clarity but I include all the data in the table at the bottom of this article).  Post-recession S&P P/E began to return to normal at the beginning of this year and is forecast (by S&P) to align once again with the pre-recession growth in earnings.

    Now compare with what happened to Apple's stock.  Pre-recession the stock enjoyed a significant premium for growth.  The blue bars are significantly higher than the red bars in the 2006/2007 period and the blue line is naturally higher than the red line in the same period.

    During the recession, Apple continues to grow but the P/E drops to remarkably low levels (10).  Although Apple's earnings growth does diminish, it never goes away.  The anomalous growth in the third quarter of 09 is 11% due to the huge spike the year earlier with the launch of iPhone 3G.  Overall, the company continues growing at a good clip.

    Not so for its P/E however.  Even after the recession ended and AAPL accelerated growth to above 50% again, the P/E remained around 20.  I left out the forecast from the AAPL line so that readers can imagine their own.

    The bottom line is that at the new all-time high, Apple's shares are trading at a discount to their growth.  Not only lower than than Apple has enjoyed historically, but lower than the average of 500 of the largest companies in the US.  Those companies having earnings growth in the teens have recovered their valuation.  Apple with growth returning to above 50% hasn't.

  4. Analysts upgrading AAPL

    Research

    Susquehanna Financial's Jeff Fidacaro: To $335 from $325.

    Kaufman Bros.' Shaw Wu: To $340 from $320.

    Piper Jaffray's Gene Munster: To $348 from $340.

    Caris and Co.'s Robert Cihra: To $325 from $310.

    Morgan Stanley's Katy Huberty: To $332 from $310.

    International Strategy & Investment Group's Abhey Lamba: initiate with $320.

    Cowen's Matthew Hoffman: initiate with $326.

    At yesterday's closing price Apple was trading at a 12-month trailing P/E multiple of 23 despite revenue growth that may exceed 50% and EPS growth that may exceed 70%.

    Using the highest target of $348 price target as an example, it prices the shares at a P/E of less than 30 times the most recent 12-month earnings which does not take into account the contributions from the iPad.

    Apple is on track to report three consecutive quarters of record revenue and earnings (beginning with the June quarter) and current analyst price targets do not reflect the current and anticipated rates of revenue and earnings growth.

    Analysts scramble to raise AAPL targets - Apple 2.0 - Fortune Tech.

  5. The iPhone at three

    Research · 4 comments

    The end of June will mark the third anniversary of the market release of the iPhone. When it arrived in June 2007, anticipation for the product was significant with high consumer awareness and expectations--though the 10 million/yr. target for 2008 was met with skepticism by many.

    The iPhone launched on June 29th 2007, with only a few days remaining in the quarter. 270k units were sold in that quarter and that was considered a solid start. When the company reported earnings a few weeks later (July 18th 2007) the company's stock price jumped to $140 a share.

    As a sign of optimism in the company's prospects, the P/E ratio showed that the company was expected to reach 35% growth (35 P/E).

    Was this optimism warranted?

    A huge world-wide recession started only six months after the iPhone launched and, by some accounts, it is still lingering today. That meant the company faced decreasing consumer spending and constrained markets world-wide. The recession was expected to challenge Apple's premium positioning across all its product lines. The optimism from 2007 seemed exuberant. Where do we stand today?

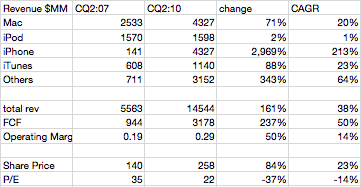
    This table shows the actual values of the iPhone's 2007 launch quarter vs. the estimated values for Apple's income statement exactly three years later.

    Free cash flow grew 237% or at a compounded 50%, significantly above the 35% that the P/E of 2007 would have suggested. The exuberance of 2007 turned out to be pessimism.

    Although we don't know what the share price will be come July, as of today the share price has grown at less than half the rate of FCF growth: 84% or 23% compounded. As a result the P/E dropped from 35 to 22.

    It's remarkable that growth expectations today are lower than they were at iPhone's birth even though the company outperformed those expectations through an unforeseen economic crisis.

  6. Apple's Valuation Struggle

    Research

    I don't know how many times I can re-write this story but here goes another try.

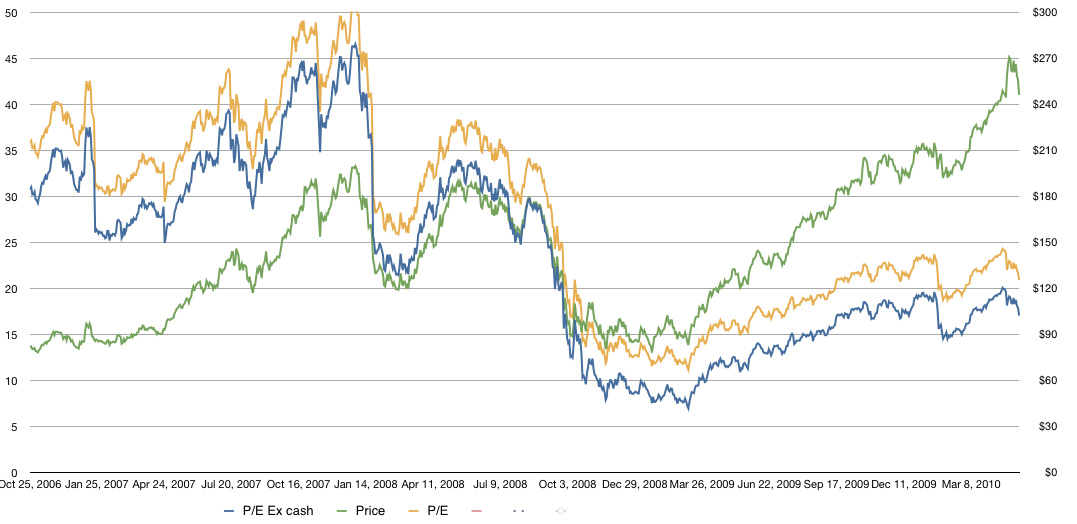
    In the graph below I show Apple's historic share price overlaid Apple's P/E (with and without cash).

    The share price is the line in green with the scale on the right and the P/E (trailing twelve months ex-cash) is shown in blue with the scale on the left.  The P/E including cash (which is what is usually cited) is shown in yellow.

    As the graph shows, while the stock has risen, the P/E has fallen.  This is due to earnings accelerating faster than the stock price. As valuation is usually correlated with growth, it stands to reason that Apple continues to be discounted as a growth stock.

  7. Apple continues to trade at a discount to growth

    Research

    Apple's latest earnings showed growth of nearly 90% (following a nearly 50% growth the previous quarter.)

    Normally, growth like this is rewarded with a significant P/E ratio of 30 to 40.  Apple enjoyed P/E of 50 as recently as 2007.  However Apple's P/E ratio dropped to about 22 after earnings.

    Although higher than during the worst of the recession, this low P/E either reflects continuing pessimism in the overall sustainability of the economy or a continuing discounting of Apple's potential growth.

    Excluding the nearly $45/share cash and looking at a forward twelve months earnings of 15, the forward P/E is an almost embarrassing 14.

    It's possible that after a few quarters of above 50% growth Apple's P/E and hence its valuation will return to more normal (PEG ~1.0) levels.  A P/E of 30 at today's trailing 12 months earnings would put the stock above $350/share.

  8. Kathryn Huberty Predicts Apple Performance

    Research · 7 comments

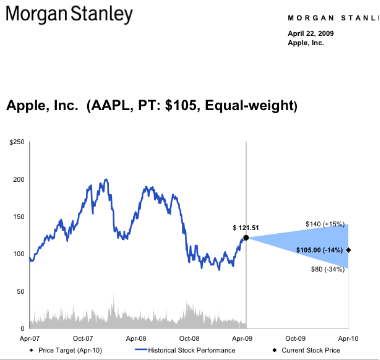
    10 months ago Ms. Huberty released her price target for April 2010 (see graph) at between $100 and $105. The stock was trading at $121 then and her forecast was for a 14% decline.

    She wrote:

    Investment Conclusion: The combination of a March quarter beat and positive management tone is likely to keep AAPL shares in its recent trading range. Valuation is not stretched by any means but at 21x our adjusted C09 EPS, the market already assigns AAPL a 16% premium to RIMM which credits AAPL for lower risk given its large cash balance and a more diversified revenue model. We remain Equal-weight AAPL shares.

    We note that the stock is currently trading above $200 at a P/E of 19x. She had forecast a price of $100 on a P/E of 21x Calendar 2009 Earnings Per Share. The implication is that EPS would have been $100/21 or $4.7 for calendar 2009.

    She already had one quarter of data ($1.79 for CQ1) therefore she forecast $4.7-$1.79 = $2.97 for the remainder of the 2009 calendar year.

    In reality, Apple earned $10.24 for 2009 and $8.45 for CQ2 through CQ4. That makes her error ($8.45-$2.97)/$2.97 = 184%.

    We see today that she has a new forecast for $225 a share which leads us to conclude that she still has a job.

  9. Apple as Macroeconomic Counter-Indicator

    Research

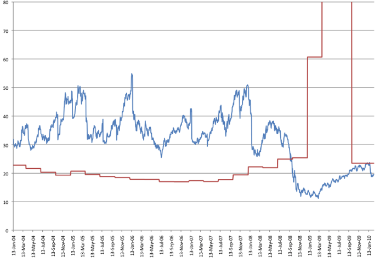
    Following up on the Apple Valuation Entry, I went to the data and pulled the historical P/E for Apple back to include all of 2004 (in blue) and did the same with the S&P P/E (in red).

    A few notes:

    • Apple’s P/E was consistently above 30 until mid-2008
    • Apple’s P/E was consistently and substantially above the S&P until mid-2008 by at about 10 to 30 points.
    • A reversal occurred at that point with S&P P/Es reaching record highs (actually at over 120 in May) and Apple’s reaching record lows of 11 at a time when the S&P P/E was over 60.
    • Since the reversal, Apple’s P/E has been consistently below the S&P’s and indeed has stayed near historic lows while the S&P is returning to historic averages.

    This reversal happened during a time of recession when, in contrast to most companies, Apple kept growing. The spike in the S&P P/E is due to a dearth of earnings, while Apple had increased earnings, sometimes to new records.

    As a “premium” brand it’s perhaps perplexing that Apple seems to be acting as a counter-indicator to macroeconomic conditions.

    Expectations for Apple to decline in times of economic contraction did not come true and as recovery seems near, Apple appears to be discounted.

    In other words, when times are bad, Apple surprises and does well so therefore when times are good Apple should do badly.

  10. Apple's Valuation Dredging Bottom

    Research

    The fact that AAPL is less valuable -- in terms of the P/E ratio -- than the average S&P 500 company continues to baffle me.

    Apple's P/E is a bit misleading because of the price "P" a large part is cash which should not be considered "at-risk" capital.

    The logic of a P/E ratio is to measure how many years it might take to recover one's investment. The cash on the balance sheet is not at risk for this calculation. Therefore the Enterprise Value /Free Cash Flow is a more accurate measure of company value creation. Until the recent re-statement the FCF and Earnings were divergent. They have since become equivalent.

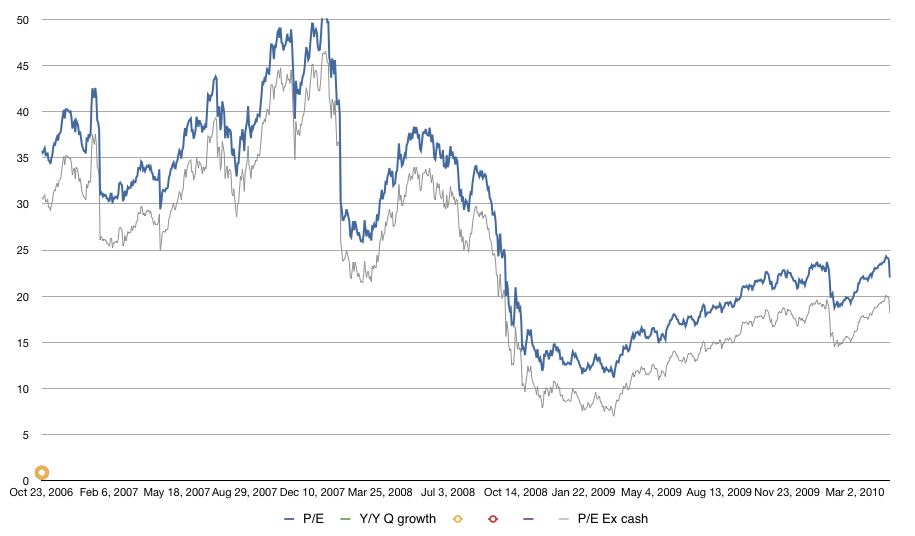
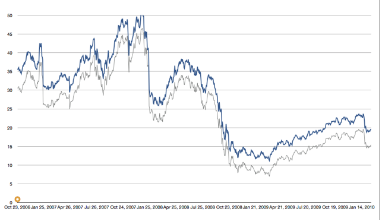
    Therefore, if you take cash out, (currently $43/share) the Enterprise Value / Free Cash Flow for Apple is about 15. It had bottomed at 7 (now that we have restated data we can go back and re-calculate this).

    The graph above shows the traditional P/E in blue and the EV/FCF in grey (using restated financials).

    On a forward basis the EV/FCF is probably around 12 to 13.

    Also of note is that Apple's EV/FCF is lower than the S&P 500 (at 23.52 at the end of Q4 2009.)

    If we continue to use the S&P as a comparable, I looked up the estimates for quarter-end P/E for the S&P 500:

    12/31/2011 17.15

    09/30/2011 18.35

    06/30/2011 19.97

    03/30/2011 21.61

    12/31/2010 23.00

    09/30/2010 24.43

    06/30/2010 22.57

    03/30/2010 21.54

    12/31/2009 23.52

    Apple EV/FCF (and also traditional P/E) are lower than S&P on current and forward bases.

    How do we read this? Is the market considering that Apple's prospects are less than the average large company? This does not quite make sense to me. What other theory could be at work to explain this valuation?

    S&P estimates are sourced from:http://www2.standardandpoors.com/spf/xls/index/SP500EPSEST.XLS