Asymco

Asymmetric Intelligence

revenue

  1. Game over

    Research · 237 comments

    In the "Race to a Billion" there is a graph showing Android reported activations and iOS cumulative unit sales alongside cumulative console sales. The contrast between mobile phone platforms and game consoles is striking, with an order of magnitude difference in consumption. The best performing console to date is the Wii with about 100 million units sold so far.

    [UPDATE: Thanks to Danny Nemer cumulative sales of Sony's PlayStation 2 (using production shipments from FY 2000-05 and recorded sales for FY 06-12) is 155.81 million units]

    However, that is an incomplete picture of the game platform business primarily because consoles are not the entirety of the business. Mobile (but dedicated) gaming platforms have been sold for some time.

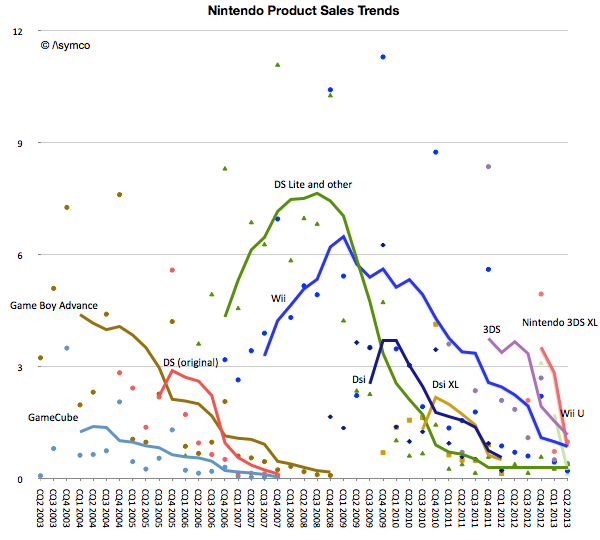
    To give a better picture of the game business we prepared the following graphs. The first shows Nintendo's product lines with actual unit shipments (shown as colored dots in millions of units per quarter) and the trend (shown as trailing twelve months' average trend lines).
    Screen Shot 2013-09-09 at 9-9-4.45.30 PM

    Note that fixed and mobile products are both shown on the same graph. The picture that emerges is that for Nintendo, its mobile platforms combined are more popular than its fixed consoles with a total of 186 million mobile devices sold since 2003.

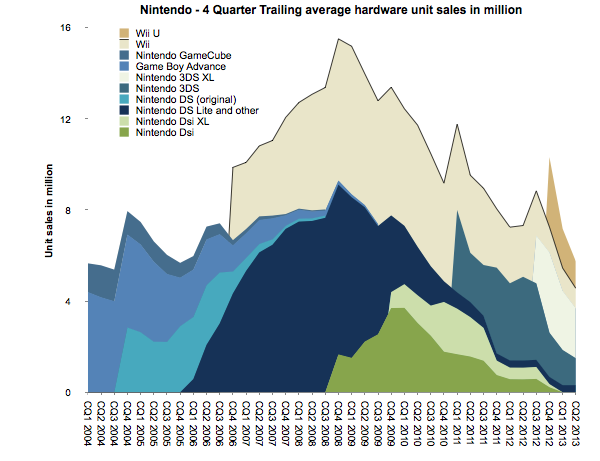
    There is also a pattern of generational change. The GBA, DS and GameCube era was superseded by the DS Lite, DSi, Wii era. The Wii era (or generation) was significantly more popular than the GameCube generation. If there is a problem however, it seems to be that the new generation devices or consoles are not forming a new era. The Wii U and 3DS are not growing nearly to the level of the previous generations and have faded quickly.

    To summarize, the unit volume graph for Nintendo is below. ((This is a smoothed graph showing what sales would have been if they had been evenly spread out over a 12 month period. The actual sales would total to the same area but would be much more seasonal and thus noisy.))
    Screen Shot 2013-09-10 at 9-10-10.25.23 AM

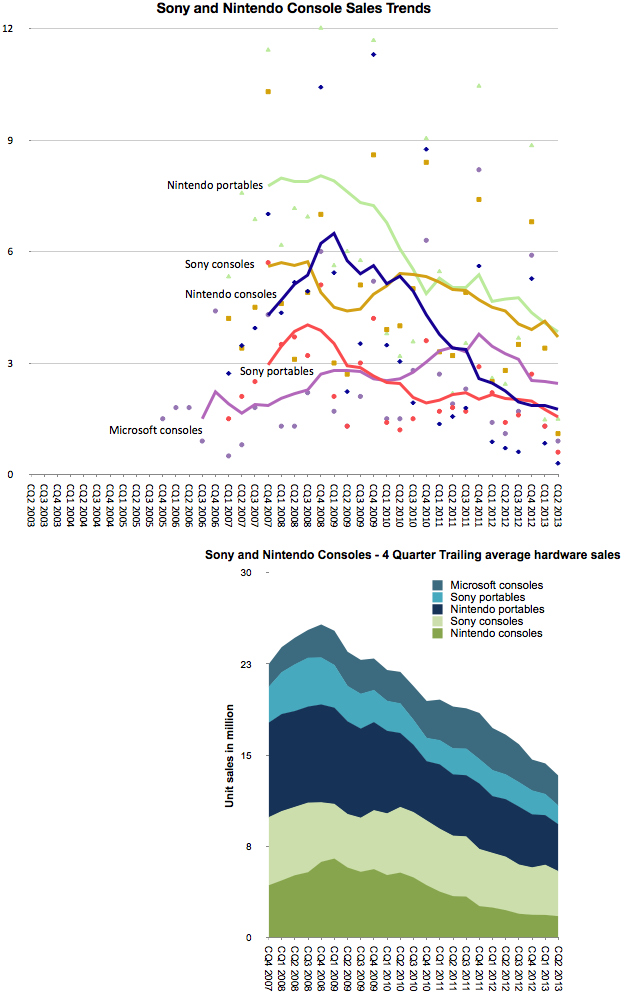
    To confirm that this is indeed disruption we should look at the pattern for another competitor in the console market: Sony. ((We would like to show the pattern for Microsoft but there is no regularly reported Xbox shipment data.))
    Screen Shot 2013-09-10 at 9-10-11.09.16 AM

    The graphs above combine both Nintendo portable/consoles and Sony portable/console sales. Note the similarity in patterns of growth. It's one thing to suggest that Nintendo consoles have "failed", it's another to show that Nintendo consoles and portables have failed, and yet another to show that two competitors in the games business seem to be failing in unison across all their product lines.  The cyclicality is also over a long period of time: The peak for the combined Sony/Nintendo was in 2008, five years ago.

    The chief criticism to the industry-wide view of decline is that there is a new generation of consoles right around the corner. This is the eighth generation of consoles which, it is presumed, will bring growth back to the industry.

    But the Nintendo 3DS, launched two years ago, was meant to kick off the eighth generation, and the PlayStation Vita was Sony's response. Then the Wii U was also billed as the successor to the Wii. They have so far failed to re-ignite growth. One might reply that they were merely appetizers and that the main  course of the next gen are the PS4 and Xbox One.

    Will they create growth again? Surely not for Nintendo, but I would argue that not for Sony or Microsoft either. There might be a burst of sales at launch as the hard core gamers upgrade, but they are unlikely to recruit new gamers the way the Wii did. In other words the PS4 and Xbox One are unlikely to win against non-consumption.

    That is where mobile is the clear winner. More people will hire mobile devices for their primary gaming activity.  And as mobile devices get inexorably better, they will be hired for use in the setting where consoles have been king: the living room.

    The implications are that Nintendo, Sony and Microsoft are beyond the point of no return in this industry. Gaming, as a business, cannot be sustained as a platform independent of a general purpose computer. Like other "applications" that used to have systems built around them conforming to their needs (( Applications such as word processing, financial calculation, media editing, music playback, etc.)) the dedicated-purpose solutions came to be absorbed into the general-purpose platforms. And the modern general purpose computer is the smartphone. (( One interesting question is why didn't the general purpose personal computer absorb console gaming. My answer is that personal computers could not conform to the experiences around the "10 foot" interface and still function well at their main jobs. In contrast, mobile devices through screen sharing have the ability to be much more malleable.))

    UPDATE: I added Microsoft console shipment data which became available after 2008.
  2. The Revenue Table (imperial units edition)

    Research · 40 comments

    Tim Cook famously said:

    We can put all of our products on the table you’re sitting at. Those products together sell $40 billion per year. No other company can make that claim except perhaps an oil company.

    For those of you laughing, that was three years ago. The revenues quadrupled since to a total of $170 for the last four quarters. But the more interesting thought is that the table has not gotten bigger. When Tim spoke the iPad had just been announced but was not yet for sale. So we can't be sure if he thought it should be on the table or not, but it does not take up that much space.

    It would be fun to actually lay out all the Apple products on a table to see how big it would be. The trouble is that there are many things Apple sells which take up no space at all. Things like iTunes content or services and AppleCare.

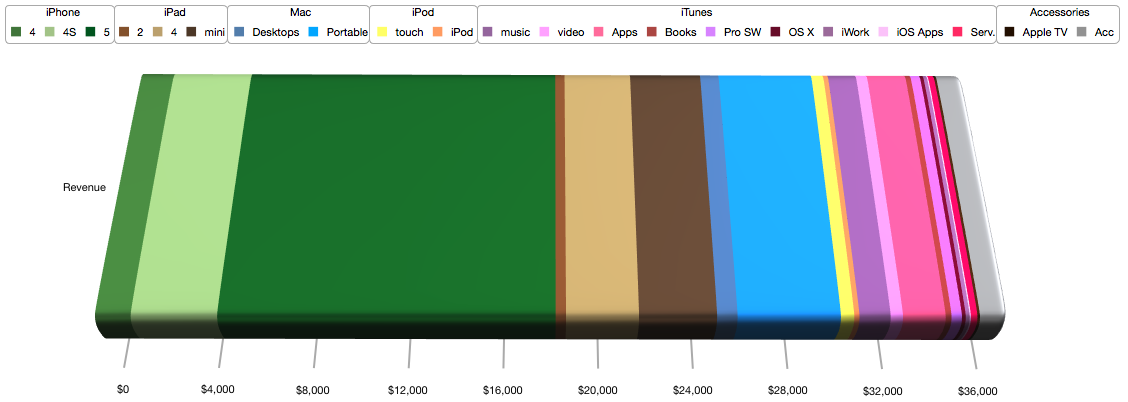
    So rather than trying to imagine a table full of Apple products (some of which are non-phyisical) I thought a more fitting analogy would be to allocate the revenues from these products to a table and thinking about how much space relative to each other the products would take.

    To make conversion easier, I picked a rather large table; 10 feet long, big enough to fit a small conference room. What would this table covered in product revenue look like?

    My estimate is that it would look like this:

    Screen Shot 2013-08-22 at 8-22-11.50.54 AM

    I color coded the product lines as shown in the legend: Greens for iPhone, Browns for iPad, Blues for Mac, Yellow for iPod, Red/Purples for iTunes and Grey for Accessories.

    At this categorization the table would allocate the following space to each category:

    • iPhone (Greens): 60 inches or about half the table.


      Product
      Inches
      iPhone 4
      4.7
      iPhone 4S
      11.4
      iPhone 5
      44.5
    • iPad (Browns): 21 inches


      iPad 2
      1.4
      iPad 4
      9.6
      iPad mini
      10.3
    • Macs (Blues): 5 inches


      Desktops
      2.7
      Portable
      13.6
    • iPod (yellows): 2.5 inches


      touch
      1.8
      iPod
      0.7
    • iTunes (reds), software and services: 15.5 inches


      music
      4.1
      video
      1.6
      Apps
      5.6
      Books
      0.8
      Pro SW
      1.4
      OS X
      0.5
      iWork
      0.5
      iOS Apps
      0.2
      Serv.
      0.9
    • Accessories (Greys): 4 inches.


      Apple TV
      0.3
      Acc
      3.6

    If this colorful table were used to support the actual products, where each product would have to fit within its color band, then the truth of one saying would become apparent: good things come in small packages.

  3. iTunes Update

    Research · 29 comments

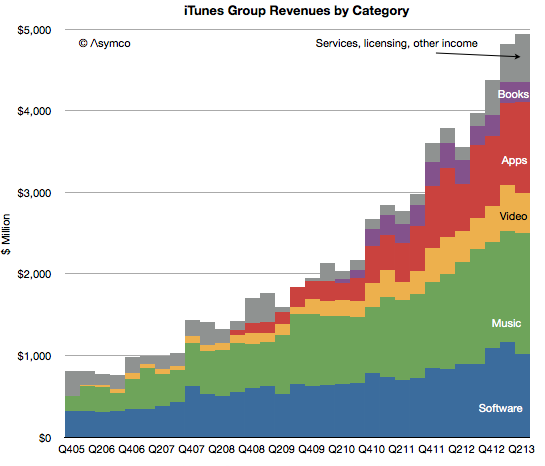
    In the latest quarter the iTunes group top line grew by 25%.

    Additional newly reported items:

    • Quarterly revenues dipped slightly to $4 billion (second highest after $4.1 billion last quarter).
    • iTunes Stores billings (i.e. gross content revenues) were $4.3 billion
    • Reached the best month and best week ever for App Store billings at the end of the quarter.
    • iTunes billings translated to quarterly revenue of $2.4 billion, up 29% from the year ago but flat q/q. Company reports “strong growth in revenue in both content and apps.”
    • New content added includes HBO GO and WatchESPN available on Apple TV. Apple TV catalog now includes over 60,000 movies and over 230,000 TV episodes.
    • Users have downloaded more than 1 billion TV episodes and 390 million movies from iTunes to-date. They are purchasing over 800,000 TV episodes and over 350,000 movies per day.
    • iOS developers have now created more than 900,000 iOS apps including 375,000 apps made for iPad. Apps created grew by 50,000 overall and 25,000 iPad apps.
    • Cumulative app downloads have surpassed 50 billion.
    • App developers are being paid at the rate of $1 billion per quarter.
    • App developers have been paid over $11 billion for their sales through the App Store (half of which was earned in the last four quarters.)
    • There are now over 320 million iCloud accounts
    • There are 240 million Game Center accounts
    • Almost 900 billion iMessages have been sent
    • Over a 125 billion photos have been uploaded and over 8 trillion notifications were sent.

    Some observations and estimates:

    • Music revenue growth remains at around 15% while video revenue growth remains around 25%
    • Apps continue to accelerate with a near doubling of revenues
    • Book revenues are contracting as pricing pressure is being felt
    • The software group grew moderately at 15% as Apple’s apps are reaching saturation within the iOS user base and as Mac sales stagnate.

    As a reminder, you can order the iTunes Business Review from the Asymco Store.


    Screen Shot 2013-08-05 at 8-5-4.21.54 PM
  4. That Competition Thing

    Research · 62 comments

    Bill, I think the smartphone market has always been competitive. [Only] the names have been changed.

    Tim Cook responding to Bill Shope's question on the competitive landscape, April, 2013.

    Indeed, over the years, the companies considered Apple's primary competitor have been many.

    In years gone by in the phone market there were RIM and Nokia and Palm and HTC. In the iPod era there was Creative and Sony and innumerable others long forgotten (not to mention the tyranny of DRM).

    Even today we struggle to decide whether Apple competes with Google first or Samsung. Or perhaps with the iPad it's with Amazon or  Microsoft. Or maybe iTunes is threatened by Netflix or Spotify. The Mac surely competes with HP and Dell and Toshiba. What about iCloud? Clearly it's Dropbox or Google Drive. iWork? Both Office and Google Docs.

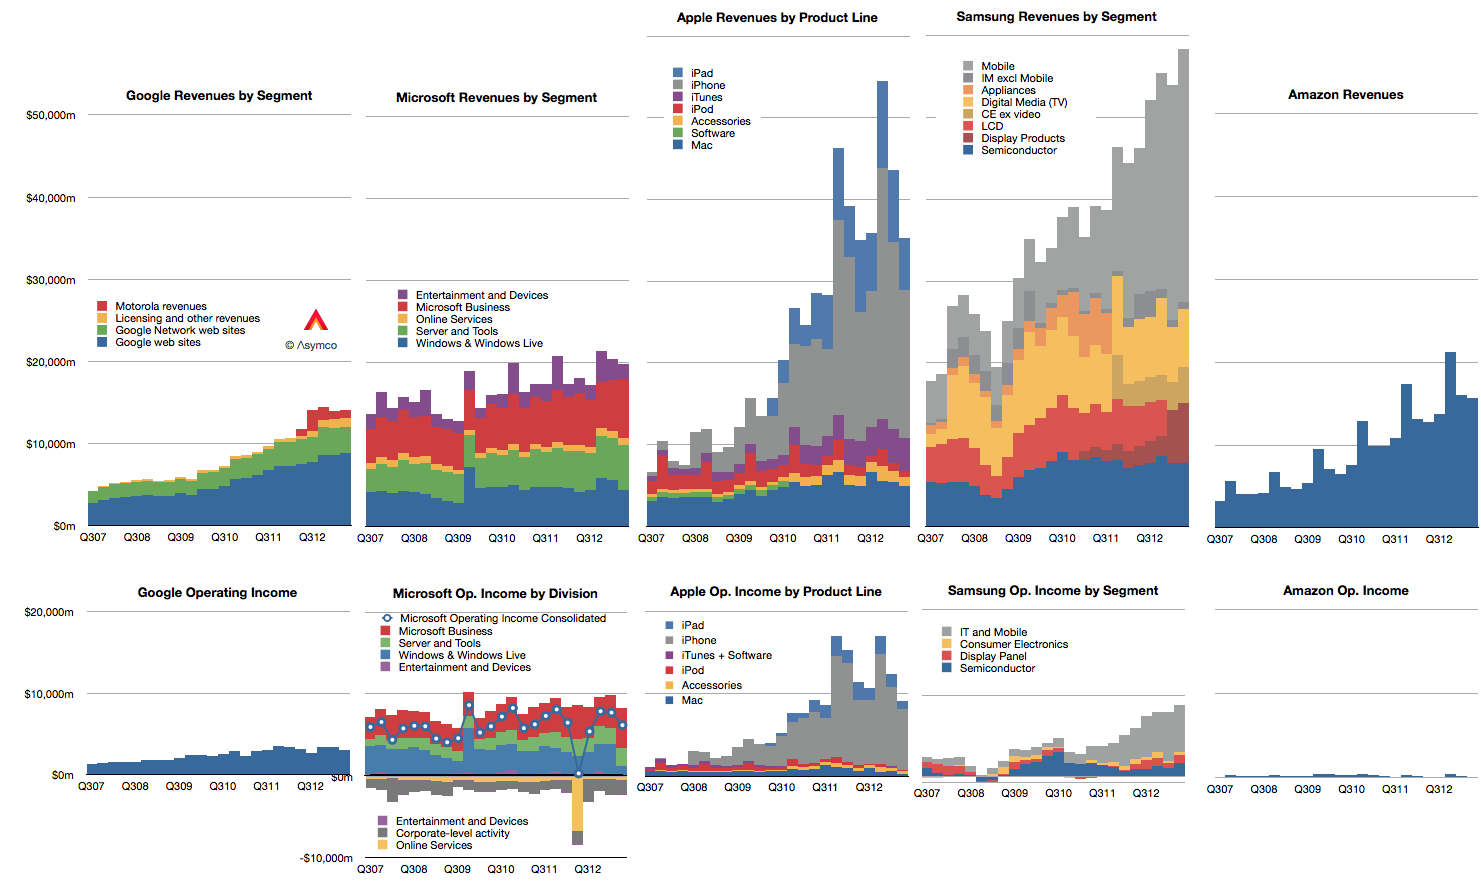
    Doing a competitive analysis for Apple is then mostly a struggle of whom to compare it to. So forgive me that I only track the few challengers shown below.

    Screen Shot 2013-08-13 at 8-13-2.14.59 PM

    Note also that these companies all may compete with Apple to some degree but they may not compete with each other. Competition, it seems, is not transitive.

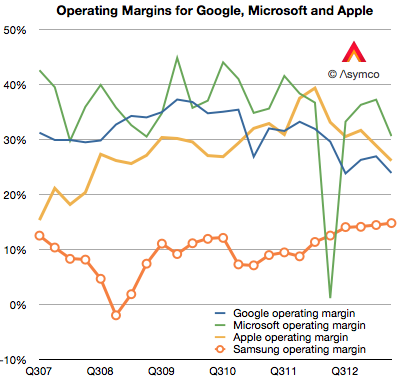
    There isn't much that I can observe in the data that hasn't already been observed. Google shows steady but not spectacular growth in revenues with decreasing margins. Microsoft shows even more modest growth in revenues with flat earnings. Apple growth is moderating from near vertical while earnings pause. Samsung has great growth but there is a similar set of doubts about its sustainability and finally, Amazon continues to grow the top line by 20% and  has nothing to show for it.

    Operating margins have mostly fallen with the exception of Samsung whose increasing reliance on smartphones has led to a modest increase, though not nearly to the level of the others. (Amazon, lacking in profits, cannot be compared.)

    Screen Shot 2013-07-30 at 7-30-10.54.44 PM


    In summary there is little change to report.

    Except that it's been reported that in the last quarter Samsung managed to "dethrone" Apple from the phone operating profit crown. This is a matter of estimates and for that we need to understand clearly the assumptions.

    I estimate that this is not the case. That indeed Apple remains most profitable phone maker by a wide margin.

    To estimate operating margins you need to estimate gross margin and the allocation of operating expenses (SG&A and R&D) to a particular "division" or product line. The problem is that Apple does not operate as a divisional organization so its marketing and R&D budgets (i.e. people) are not assigned permanently. You have to move them around based on whatever is being worked on at any given time.

    What's more, we need to account for the huge SG&A costs associated with iTunes and Retail. They both consume vast resources which cannot be allocated directly to any product. There are 41,000 people working in retail.  Also, some of the expenses for iTunes are overhead and cannot be considered cost of sales. That's also SG&A. Then there's corp research and design (Mansfield and Ive), which are not allocated to any particular product. When you slice out these costs, there is very little to apply to iPhone, etc.

    So if (and it's a big, sanctimonious if) you want to cast iPhone out as a separate business unit, it would be wildly profitable. There is a huge gross margin of 46% (this assumes a cost per unit of $316) and only another 5% of sales spent on engineering and marketing leaves a 41% operating margin or $7.4 billion. (Why only 5%? Because there's only 10.8% to allocate and after taking out iTunes, Retail you're really only left with 4.49% for SG&A and 3.3% for R&D or 7.79% so 5% is about two thirds of the operating budget).

    If you take all of Samsung's IM division which is PCs, Tablets and phones their operating profit was only $5.6 billion.

    You can see the difference in the grey areas of operating profit in the first graph above.

    Bear in mind that this is still an artificial comparison. The split of profit between product groups is not only an estimate by the analyst, it would be an estimate for Apple itself since it has only one P/L.

  5. The iPhone Stores

    Research · 29 comments

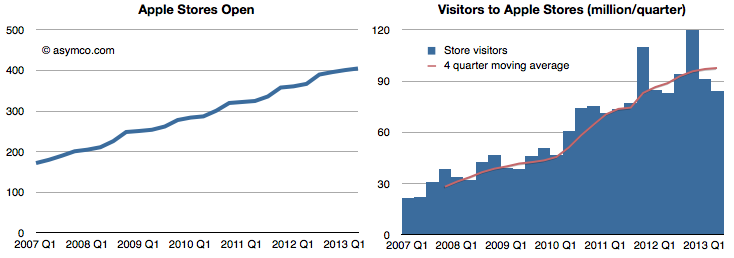
    Here are the latest performance figures for the Apple stores:

    Stores Open and Visitors

    Screen Shot 2013-07-30 at 7-30-2.17.25 PM

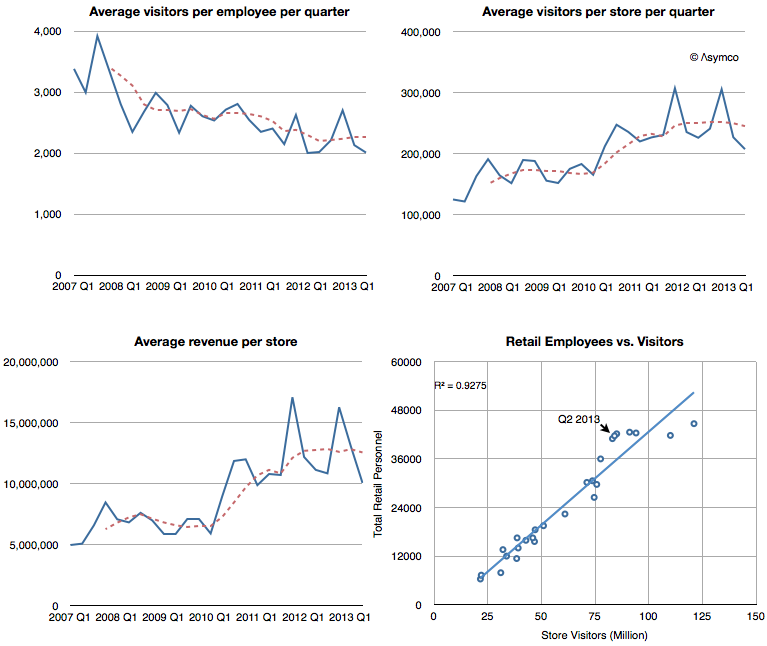
    Visitors per employee,Visitors per store, Revenues per store and Employees correlated with Visitors.

    Screen Shot 2013-07-30 at 7-30-2.15.23 PM

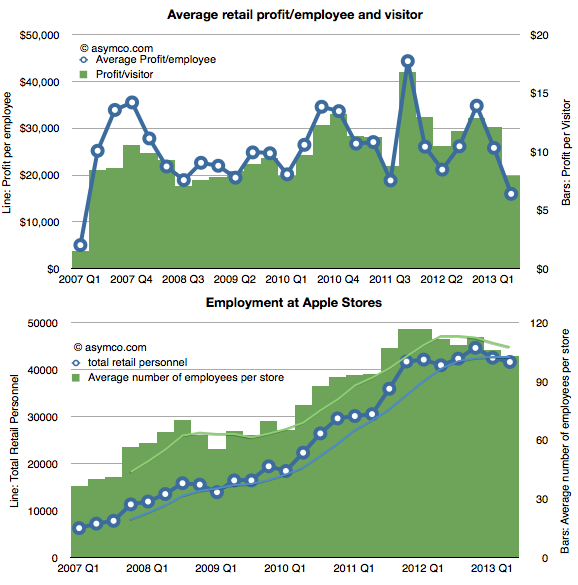
    Employment and Profitability (per Employee and per Visitor)

    Screen Shot 2013-07-30 at 7-30-2.17.48 PM

    The pattern that seems to appear is one of a plateau or peaking of sales, especially when values are seen on a per-store basis. Revenues, employment and visitors per store are all flat or slightly down when seen on a seasonally adjusted basis (trailing four period average).

    Profitability has been more steady over a long period, though more volatile in a short-term window.

    Seen in isolation, Apple Stores would appear to be coming to a point of quiescence.  But they should not be seen in isolation. Apple Stores mainly sell Apple products, so if Apple products slow then retail sales should also slow.

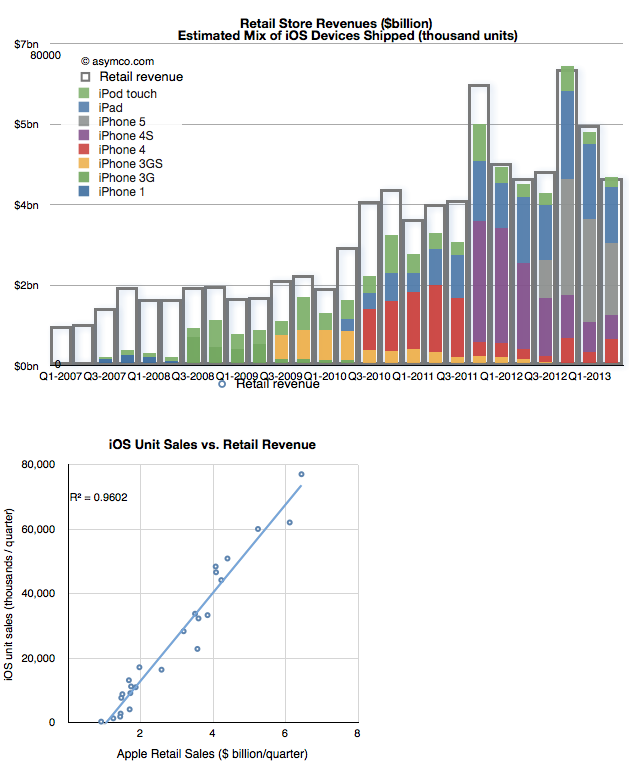
    Indeed, in 2007 Steve Jobs told Fortune that the Apple stores had been built to sell the iPhone and in 2010 Ron Johnson said the Apple stores had been built to sell the iPad. These statements were meant metaphorically but they are literally true when looking at what is actually sold. The following graph shows the relationship between iOS device sales and Retail revenues.

    Screen Shot 2013-07-30 at 7-30-2.17.56 PM

    The first chart shows the relationship plainly enough and the r-squared coefficient of 0.96 puts a finer point on it.

    So at the end of the day, the performance of the Apple stores depends on the performance of Apple's portfolio of products. It stands to reason that as iOS units slow, Apple stores should as well.

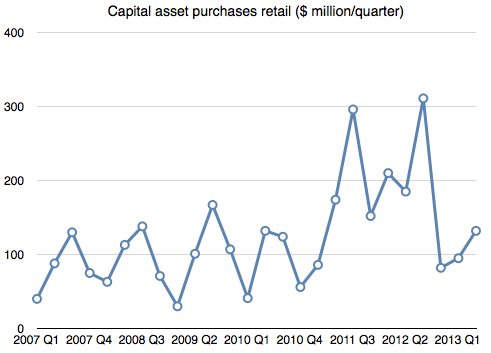
    This is something Apple management should be well aware of. Therefore, if Apple were confident in the future of iOS it would be investing in retail (as it would in other capital projects like manufacturing.)

    And that answer would be here:

    Screen Shot 2013-07-30 at 7-30-2.47.21 PM
  6. What's an Android user worth?

    Research · 130 comments

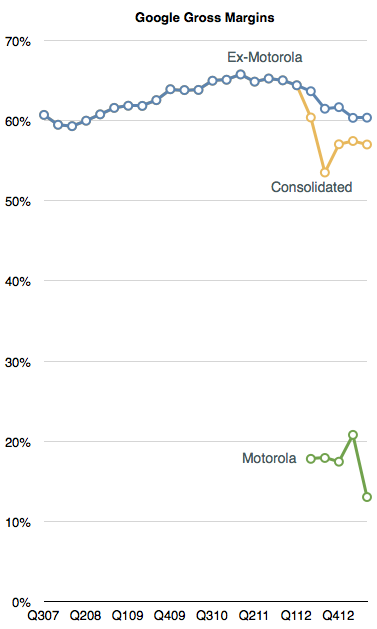
    Excluding Motorola, Google's gross margins have dropped for six out of the last nine quarters. They peaked at 65.8% in early 2011 but have now dropped to 60.4%. Including the drag from Motorola they are down to 57%.

    Screen Shot 2013-07-20 at 7-20-9.52.38 AM

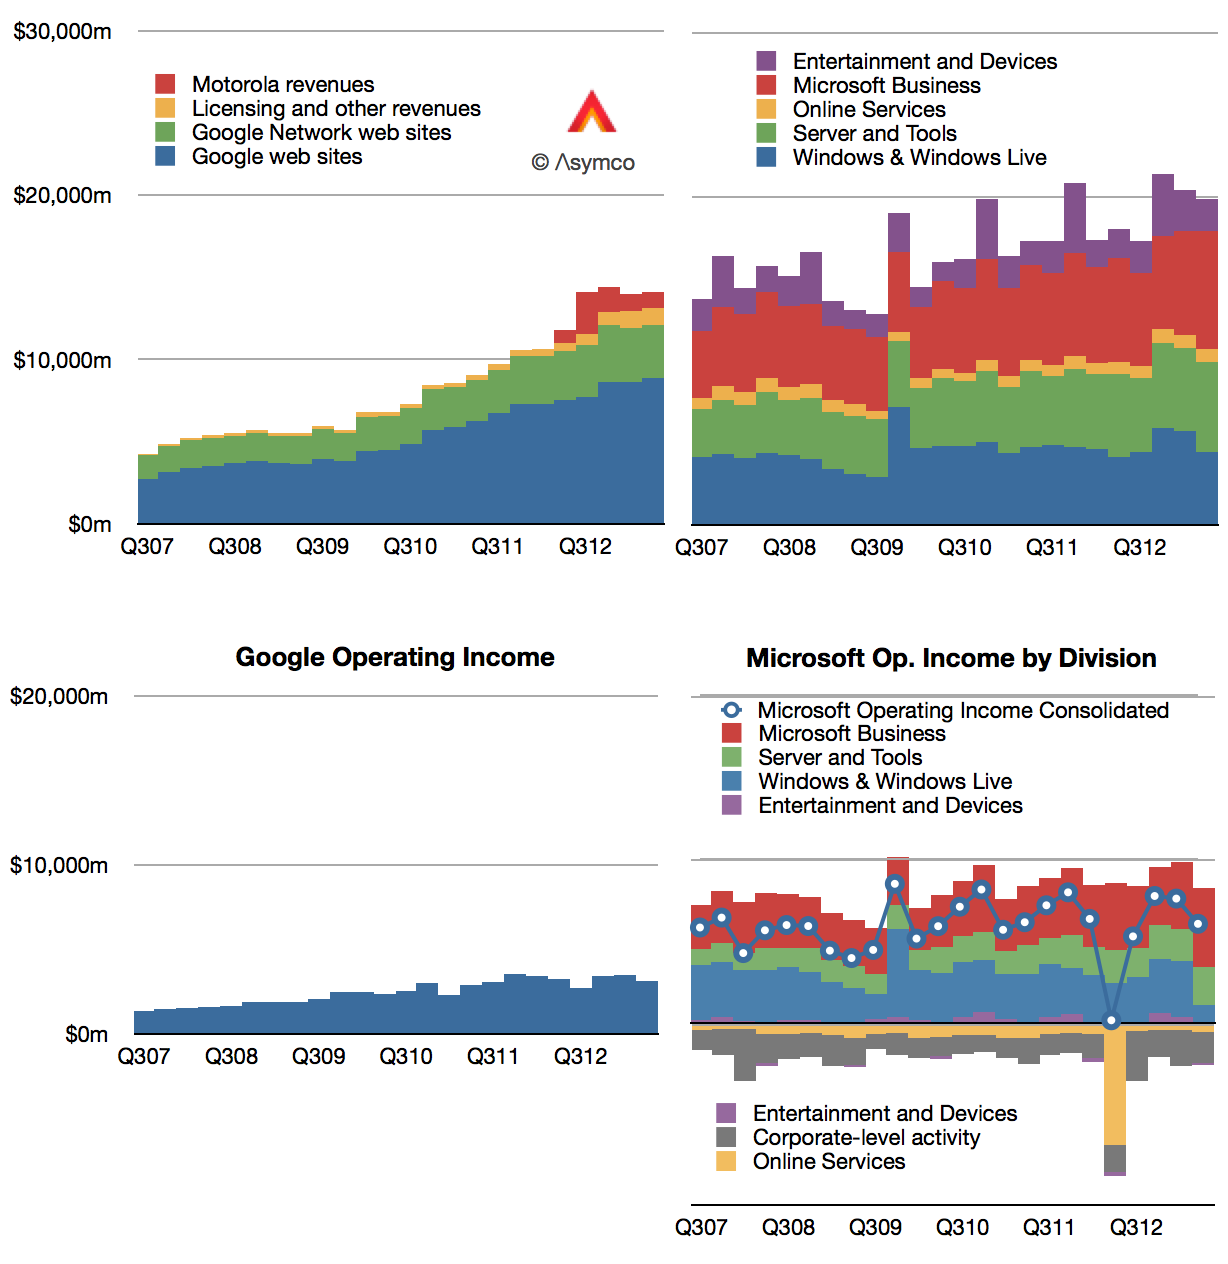
    Gross margins include the effect of price, volume and direct costs of sales. Although sales have grown (see graph below), the pricing Google has been able to obtain (CPC) has fallen. The cause is unknown but there is a strong correlation between the growth in their mobile channel. For their part, management cites mobile as having an effect in reducing CPC though they caution that it's one of many factors.

    Screen Shot 2013-07-19 at 7-19-8.52.10 AM


    The elephant in the room is indeed the effect of 900 million activated Android devices (with 1.5 million added each day.) These nominal billion devices are a new channel that could be said to have doubled Google's addressable market in only the last three years. The effect of this doubling is perhaps partly underlying the top line growth shown above.

    How can we test this?

    I placed Google's performance alongside Microsoft's for a reason. Since Microsoft has had precisely zero benefit from any new mobile channels, and since its software is broadly tied to business spending (as is Google's), we can consider Microsoft as a control in what baseline non-mobile growth could be. From Q2 2010 to the present (the Android epoch), Microsoft's consolidated revenues grew by 24% (31% if we exclude Windows).  In contrast, Google's advertising revenues (excluding Motorola and licensing) have increased by a more robust 83%.

    So it's possible that mobile contributed to top line growth. The effect could be 50% over three years. The downside is of course that this comes from a doubling of the channel. The new channel is therefore half as engaging. In terms for bottom line, the effect would be seen as more subdued growth. Overall, income increased 32% for a nominal doubling of usage.

    Not that there's anything wrong with that.

    Expansion of user base usually comes with lower engagement and margins. I demonstrated the same effect with the vast expansion of iTunes customers.

    The only difference seems to be that markets reward Google's margin dilution but punish Apple's.

    Put another way, hypothetically, as she spends slightly less, the market value for an Apple user is disappearing while as he spends a lot less, the value placed on a Google user is increasing.

  7. The PC Calamity

    Research · 70 comments

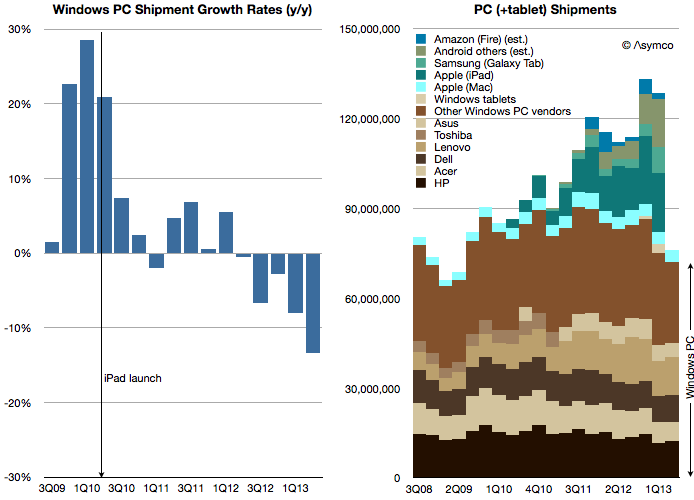
    As Intel has improved its products, their demand has decreased. Enormous efforts put into improvements are neither valued nor absorbed. The problem is not with the processors themselves but with the systems within which they are built:

    Screen Shot 2013-07-18 at 7-18-11.16.38 AM

    PC sales fell again last quarter and the contraction is likely to continue. We received affirmation of this as Intel cut sales and earnings forecasts and the crucial capital spending that creates supply in the longer term.[1]

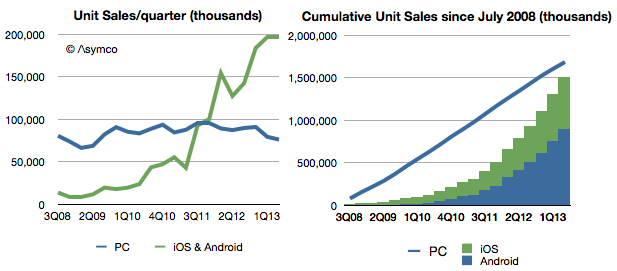
    At the same time, computing device sales have soared.

    Screen Shot 2013-07-18 at 7-18-5.07.35 PM

    Even excluding Android devices which don't register with Google's Play Store (and excluding Windows Phone devices), mobile ARM devices are selling at 2.6 times the rate of Intel-powered devices. Put another way, since the birth of Android nearly as many iOS and Android devices have been sold as PCs.

    In terms of install base, a computing category that did not exist six years ago has come to overtake one that has been around for 38 years.

    The calamity for Intel has been that they have had no part to play in the new category. Perhaps that is because they had every part to play in the old category.

    --

    Notes:

    1. Intel said it was cutting 2013 capital spending to $11 billion. The cut follows a reduction from $13 billion to $12 billion in April. Apple's budgeted capital spending for fiscal 2013 (ending September) was set at $10 billion.
  8. Measuring the iTunes video store

    Research · 41 comments

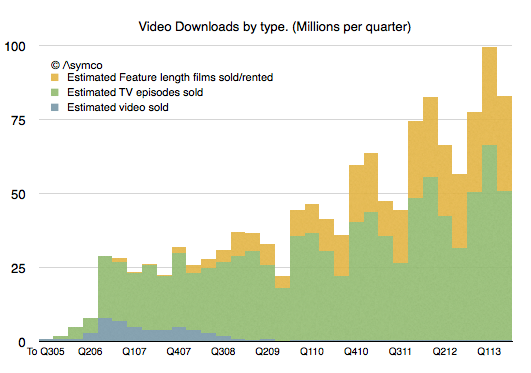
    It's been five years since we had an update on TV show downloads and six years since we've had an update on movie downloads from Apple. In Q3 2008 Apple announced 200 million TV show downloads and in Q2 2007 2 million movies. That's a long period with no information making a tough extrapolation to the present.

    Nevertheless, I tried. My estimates for these two quantities were 963 million TV Shows and 108.2 million movies to date.

    So I was quite surprised to see that figures for both TV show downloads and Movie downloads were published today. The figures were 1 billion and 380 million respectively.

    My TV show forecast has proven to be very accurate but I severely underestimated movie download rates. Apple states that the movie download rate is 350k/day. My estimate  was only about 126k/day.

    After adjusting for the new data, the picture of downloads that emerges looks like this:

    Screen Shot 2013-06-19 at 6-19-6.20.31 PM

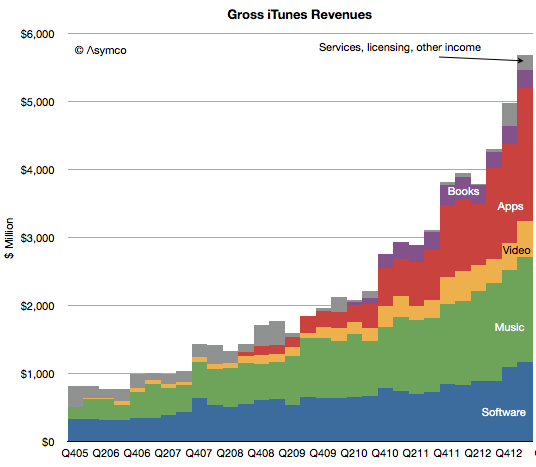
    The overall iTunes gross revenues by sub-component becomes:

    Screen Shot 2013-06-19 at 6-19-6.22.04 PM

    As a result, my new estimate for the rate of spending on iTunes video is about $1.75 billion/yr. This is much more substantial than prior estimates mainly because movies are much more valuable. A tripling of the download rate shows up as a significant rise in the profile of video vis-à-vis the other media types.

    Apps and software are firmly defined and music was somewhat clear. The upward adjustment in Video means that I have to reduce either Music or services. I presently am reducing service revenues but might adjust music as well.

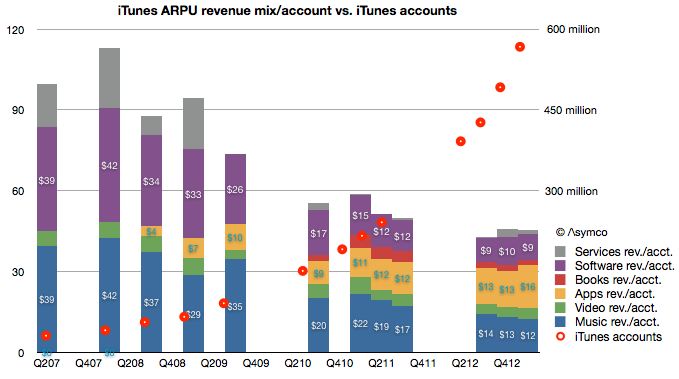
    The overall picture of iTunes is becoming clearer every day. We have more information about number of users (575 million), what they spend on media and software and services ($20 billion/yr.) and, increasingly what they spend on each media type (about $9/yr on Software, $2/yr on books, $16/yr on apps $12/yr on music and $4/yr on video.)

    Screen Shot 2013-06-19 at 6-19-6.34.18 PM
  9. What's an Apple user worth?

    Research · 85 comments

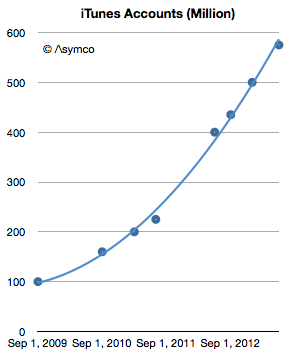
    This week Apple announced that iTunes has 575 million accounts. This is the 8th update (that I know of) over the last four years. The history of this data is shown in the following graph.

    Screen Shot 2013-06-14 at 6-14-1.13.02 PM

    The number of accounts has increased by almost a factor of six since late 2009. It amounts to an account growth rate of about 500,000/day or 44% compounded annually. Not bad, but along with this increase what happened to revenues per user?

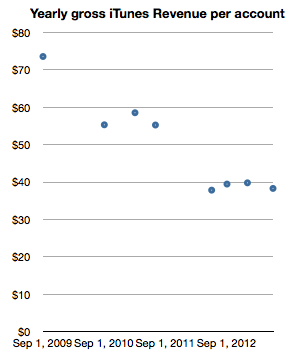
    Looking at iTunes revenue (gross) reveals a picture of revenues/account, shown below:

    Screen Shot 2013-06-14 at 6-14-1.13.11 PM

    This can be read as: "Each of the current 575 million accounts generates about half the revenue of the 100 million accounts of 2009." One would expect such a decline as an user base expands and this approximate 50% decline in revenues per account seems reasonable for a six-fold base increase. In absolute terms the graph shows that an iTunes account generates about $3.2/month in transactions.[1]  Put another way, during the last year, an average of $40/yr of economic value is generated by every iTunes account.

    Stretching further, one could also use the 575 million iTunes accounts as a proxy for "the Apple customer base". The assumption would be that iTunes accounts are attached to some Apple product, be it an iPhone, iPod or Mac. As a bounds check, a total of 865 million Apple devices (which interact with iTunes) have been sold since 2007. Assuming 575 million users does not seem to be a contradiction.

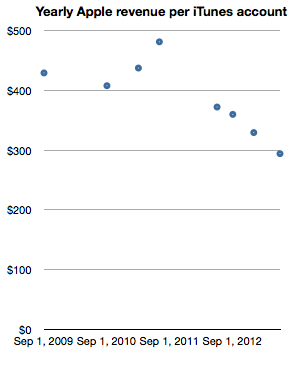
    The logic deployed would be that it's unlikely for a consumer to have an iTunes account without owning or using an Apple product. If we take this leap in logic then it would make sense to measure Apple (not just iTunes) revenues per iTunes account. In order to smooth out seasonality I took trailing twelve months' average quarterly revenues and measured the following company revenues per iTunes account.

    Screen Shot 2013-06-14 at 6-14-1.13.19 PM

    Note again the reduction in revenue per "customer" as the base grows. The reduction is less pronounced however, with about one third lower spending for a sextupling of the base. One can read this graph as "Three years ago an Apple customer used to spend $400/yr on Apple products but as the number of users increased six-fold the spending decreased to about $300/yr per customer."

    The practice of valuing a company by the rate of spending of its customer base is not uncommon, especially when the customer base is relatively loyal. Apple emphasized the importance of customer satisfaction (and, implicitly, loyalty) during its WWDC presentation. It was singled out as the most important metric they track. So perhaps valuing Apple itself on the basis of repeat purchase behavior should be considered.

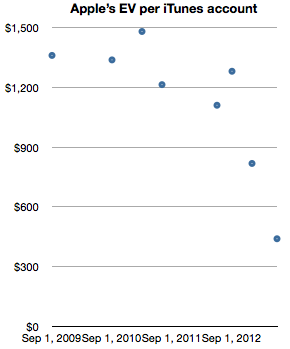
    When framing the value of of the company itself as a function of users (in the form of iTunes accounts) we get the following graph.

    Screen Shot 2013-06-14 at 6-14-1.13.26 PM

    The graph measures the Enterprise Value (i.e. Market cap minus cash) on a per-customer (i.e. iTunes account) basis.

    It shows that for a number of years—from 2009 until late 2012—Apple's users were valued (implicitly by the stock market) as likely to create a net present value of about $1200 in earnings. The current value is about a third of that, or $440 in earnings. Today's expectation is therefore that each current customer will buy the equivalent of 1.8 iPhones. And nothing more, ever. A few months ago it was expected that each customer would buy three times as much.

    Although the rate of spending of each customer is decreasing, the number of new customers is increasing more rapidly. As this is happening the company's equity is being priced such that an Apple user is considered less than half as valuable as she used to be—from 3.2x revenues to 1.5x revenues. This change in user value has been quite abrupt, happening only within the last nine months. What could justify a drop in user value would be a drop in customer satisfaction or loyalty. So far, I have seen no evidence of this happening.

    --

    Notes:

    1. Note that these revenues include App Store, Music Store, TV Shows, Movies, iBookstore, Mac App store, and Services (including iCloud). Some of this revenue is not reported as part of Apple's statement of operations since some content is treated with an agency model.
  10. Measuring the latest iOS accessory market

    Podcast · 45 comments

    One of the most startling announcements during the WWDC 2013 was iOS in the car. The mockup that was shown seems to indicate the use of the car's in-dash display as an "external monitor" for an iOS device while control would come from inputs using Siri.

    The technical details were not released so it's hard to know the protocol used to accommodate this interface. However it seems that it will be generic enough that a number of launch brands signed up for the launch. The list includes Honda, Mercedes-Benz, Nissan, Ferrari, Chevy, Infiniti, Kia, Hyundai, Volvo, Acura, Opel and Jaguar.

    Is this a significant opportunity?

    Before we get excited, it's important to note that this will likely take a very long time. It won't even begin until 2014 and the number of new models may trickle into showrooms quite slowly. Consider that the time it took for automakers to universally support external audio input (mostly the trivial line-in) was about a decade.


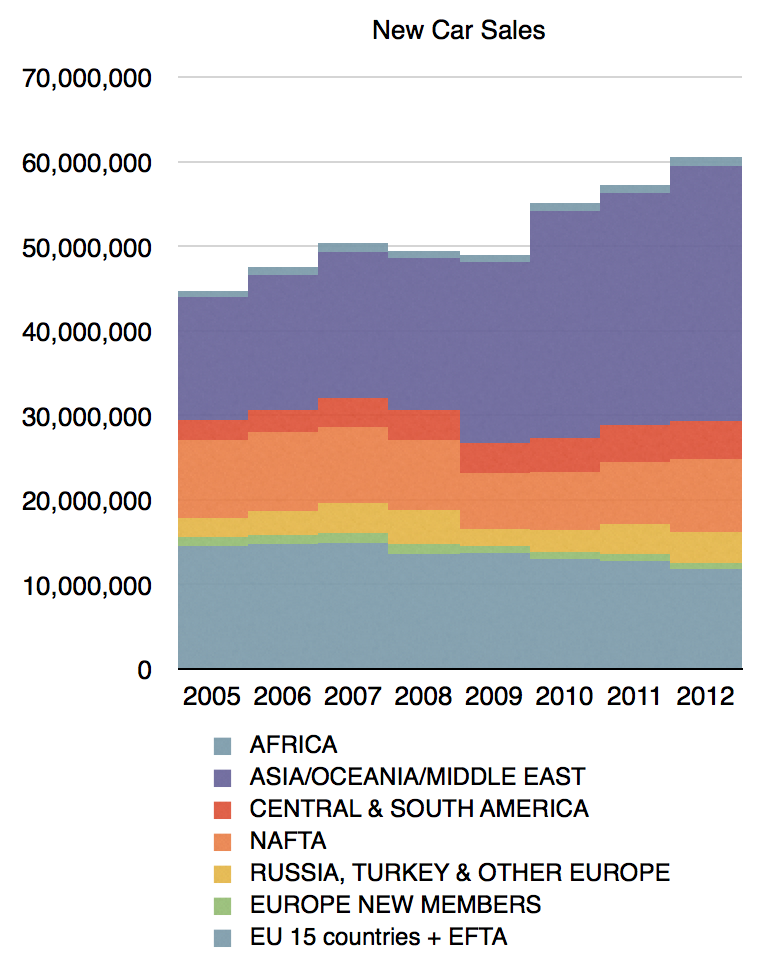
    To also curb our enthusiasm we need to realize that the car industry does not produce many units. In 2012 there were over 60 million cars produced (with the following regional mix:)

    Screen Shot 2013-06-11 at 6-11-6.02.32 AM

    In contrast, 60 million is about the number of phones sold every two weeks. In 2013 there will be more iPads sold than cars.

    In particular the companies mentioned had the following production figures in 2011:

    • Honda (including Acura): 2.9 million
    • Mercedes Benz (Daimler): 1.44 million
    • Nissan (including Infiniti): 4.5 million
    • Fiat (Ferrari parent): 2.4 million
    • GM (Chevy, Opel parent): 9.1 million
    • Kia: 1.6 million
    • Hyundai: 6.6 million
    • Volvo: 315k
    • Tata (parent of Jaguar): 1 million

    Including the parent companies and all vehicle types they produce, the total is about 30 million units, or about half of the world-wide production. Obviously, not many of the cars produced will have iOS in the car capability.

    Therefore the total unit opportunity is not very significant, perhaps less than 10 million a year. Is there a per-unit cost that compensates for this?

    This is harder to answer. The way Apple has been licensing accessory makers is through the MFi (Made for i) program. There used to be a flat 10% fee off of the retail price of the accessory sold. However, there may have been changes. The licensing fees are not public and it's quite possible that the price is a flat amount per unit and that it's a negotiable. It's hard to know what terms are being negotiated with automakers but my bet is that it's not likely to be a significant source of revenue per unit.

    So the total revenue from licensing the "Made for iPhone" trademark to automakers won't be significant.

    But it is significant for the car industry. The significance is that cars have finally risen to the role of being phone accessories. They have acquired the ability to participate in a computing ecosystem. During all these decades when the world has embraced the information society and intelligence has been embedded in the fabric of life, automakers have resolutely avoided being a part of it. Automotive information, connectivity and user experiences have remained in a Galapagos Syndrome-like isolation from reality. The reasons are rooted in the crisis of rigidity that plagues the industry, something I've touched on briefly in The Critical Path podcasts (e.g. Asymcar).

    So this is a hopeful development. If.

    If it actually moves at a slightly-faster-than-glacial speed.

    If sufficient cars get display systems (billions are produced for the pockets of  young and old, poor and rich; but cars have to be considered "luxury" to be graced with an LCD)

    If standards are adhered to.

    If all brands (which operate individually as autonomous divisions irrespective of group-level strategy) accept the notion.

    If these and many other conditions are met, it would allow, finally, the migration of autos to the status of information appliances and, eventually, to being hired for jobs that are currently left undone.

  11. Measuring US Mobile Platform Shares: Kantar vs. comScore

    Research · 34 comments

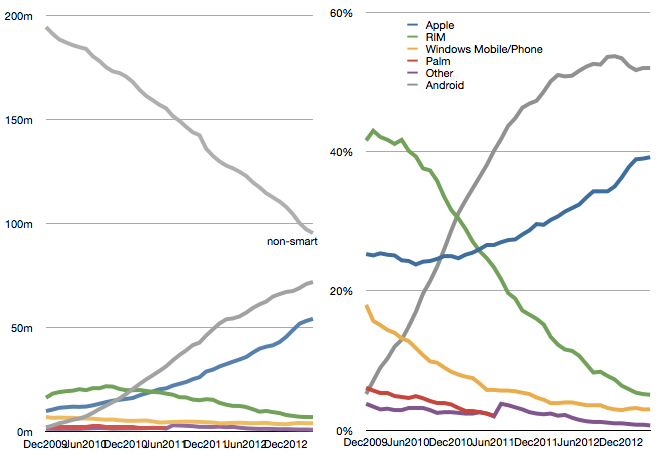
    The latest comScore US smartphone install base data is in and there are few surprises. iPhone has reached a new record high penetration (39.2%) and user base (54.3 million). Android has reached a new high in user base (72 million) but share at 52% is below the peak reached in November 2012.

    Screen Shot 2013-06-05 at 6-5-3.48.35 PM

    This pattern of gradual iPhone share gain in the US has been consistent for over two years even while Android has catapulted into an overall lead. The surprising thing is how Android seems to have peaked in share. There are still 95 million non-smartphone users and there seems to be headroom for growth even though the other platforms have been tapped out. But it does not seem that Android phones have any particular advantage over iPhone. My hypothesis remains that as price is taken out as a differentiation, the adoption of iOS is slightly higher than Android.

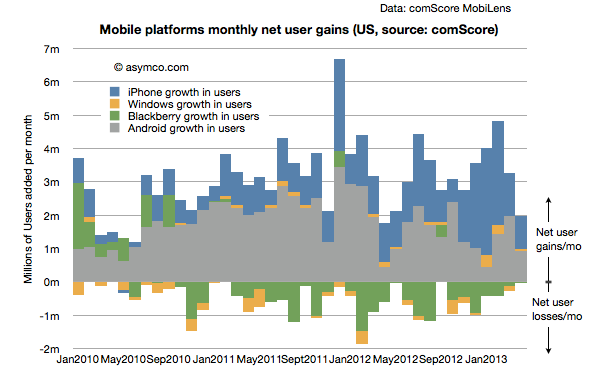
    Another measure of market performance is the implied net platform user gains which is shown below:

    Screen Shot 2013-06-05 at 6-5-3.23.55 PM

    It shows that iOS added more users in the last few months than Android.

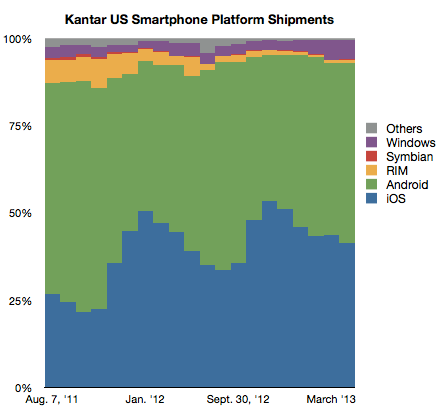
    The problem is that Kantar Worldpanel measures shipments and their share data shows a seemingly different picture.

    Screen Shot 2013-06-05 at 6-5-3.22.23 PM

    In their data Android is shown as selling more units during January through April while Apple sold more during October through December. Of course we don't have the absolute number of units so can't see the effect of higher holiday overall sales volume. Nevertheless, the balance of growth seems to be disproportionately in favor of Android relative to the data from comScore.

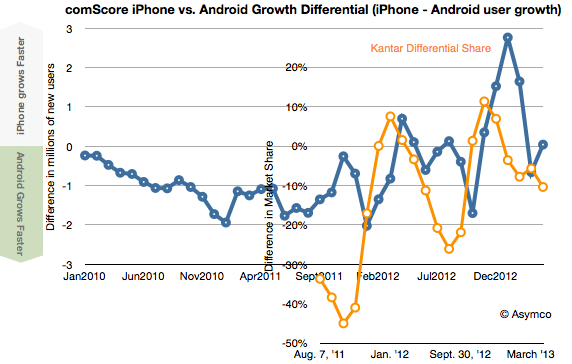
    To look at the situation more closely I measured the differential in user adds for comScore and the differential in market share for Kantar's data. Then I overlaid the two differentials so that months are matching, as shown below:

    Screen Shot 2013-06-05 at 6-5-3.51.57 PM

    There is a similarity to the frequency of oscillation with comScore data showing a delay (as would be expected since their data is sampling over a three month period). However, we are still facing a vertical offset where there is apparently more growth bias for iPhone in the comScore data.

    Possible factors which might be explanatory:

    • Methodologies used. comScore data excludes ages below 13 and non-personal devices (business expensed phones.) 
    • Replacement sales are invisible in comScore data since the user base does not change when phones are replaced (and old ones are discarded.)
    • Missing data from Kantar. Given their survey methods it's possible that their panels miss some market segments.