Asymco

Asymmetric Intelligence

revenue

  1. A new view into the phone market

    Research · 54 comments

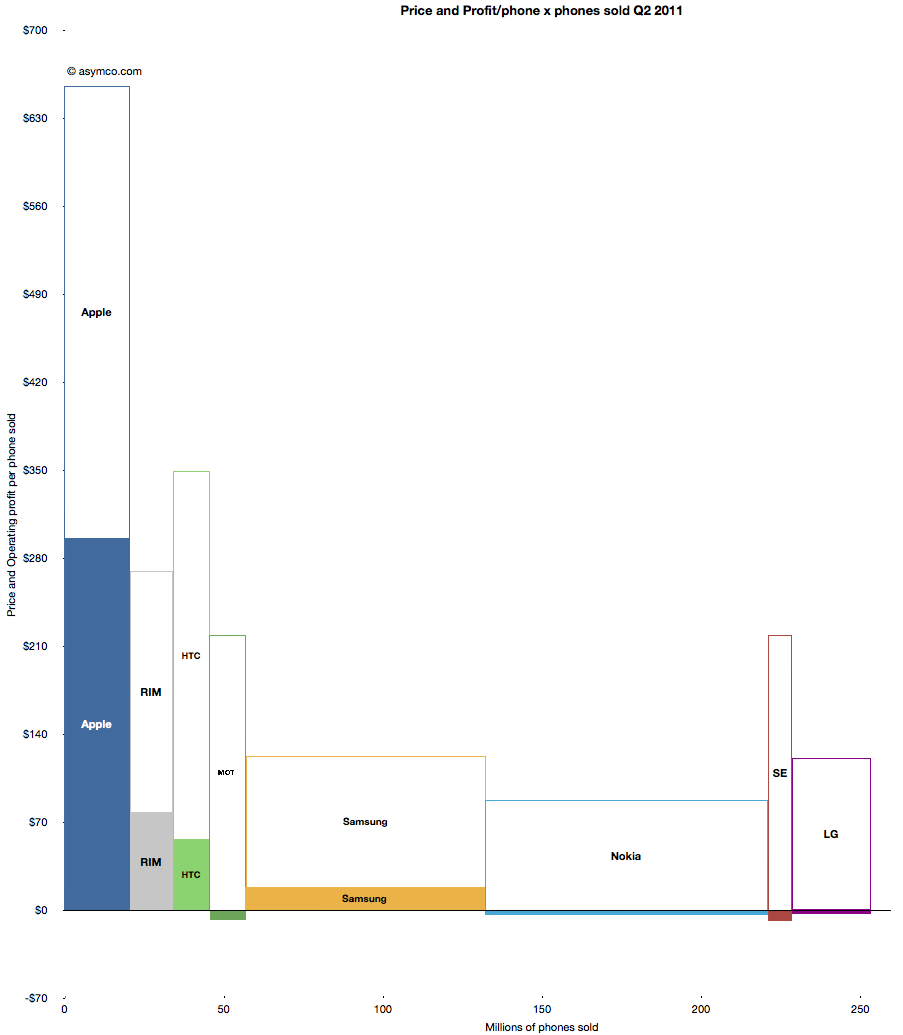
    The profitability (aka Profit/Phone x Phones Sold, aka Rawr) chart is a great way to see the "shape" of the industry at a glance, with attention to volume and profitability.

    What is missing however is a perception of the sales level and the pricing of the products. To help in that regard, I prepared an extension to the profitability chart which covers the price and sales for each participant.

    You can interpret this graph as an extension of the profitability chart where the "empty" or white areas above each profit area are payments to suppliers and operating expenses. Thus the sum of empty and filled areas (above zero) are equivalent to revenues. If the sum of the empty and filled areas are greater then revenues (i.e. they extend below zero) then the difference is operating losses.

    The top of both empty and filled rectangles are set at the average selling price per phone (and the top of each filled rectangle is the operating profit per phone). The width of both rectangles is the volume of phones shipped.

    The things you can read into this chart are:

    • Margins at a glance (ratio of filled area to total area)
    • Sales as well as profit relative to peers (top of each box relative to others)
    • Pricing power (overall top relative to competitors)
    • Any combination of the above

    Finally, the sum of all the areas are the overall market revenues for the quarter. Sum of white areas are expenses and sum of solid areas are profits & losses.

    A natural evolution of this chart would be to animate it across multiple quarters/years.

  2. Apple share of phone revenues increased to 28%

    Research · 21 comments

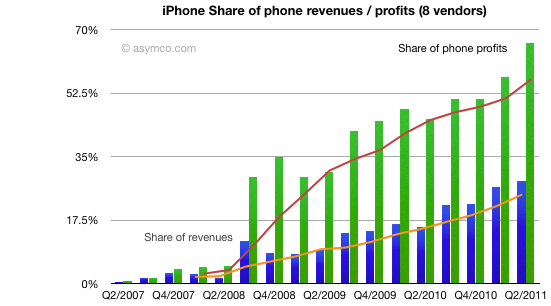
    As previously pointed out, Apple reached two thirds profit share in mobile phone vendors among the eight vendors I track. The following charts shows the historic growth in that share and the share of revenues (including 4 quarter trend line). Revenue share increased to 28% in the last quarter.

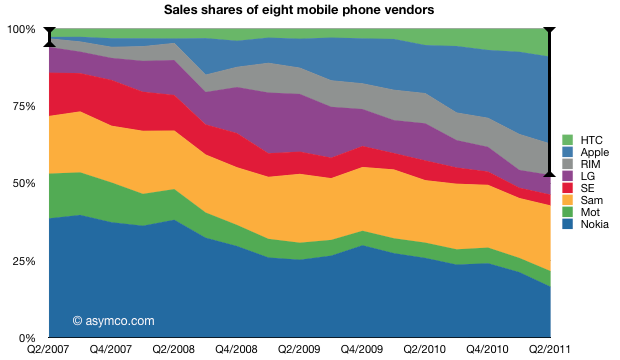
    The share doubled from Q4 2009. I should also point out that it was the highest of all the competitors. The following chart shows the split over time:

    The dedicated smartphone vendors (highlighted with segment bars) are now at 47% of total sales, a significant increase from the 6% share they held four years ago. Another remarkable show of entrant power and incumbent weakness.

  3. The Verizon small bang

    Research · 50 comments

    As Verizon has reported iPhone sales for one and a half quarters, it's time to try to discern the impact on the product. There were several hypotheses floating around prior to the "big bang" of Verizon.

    Some assumed that there would be a large migration away from AT&T and that AT&T iPhone sales would slump. Others that there would be no Verizon iPhones volumes at all because there were so many Android users already converted. There were also suggestions that the iPhone would explode in growth with two major operators carrying it.

    What really happened?

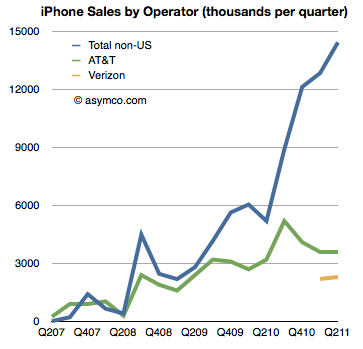
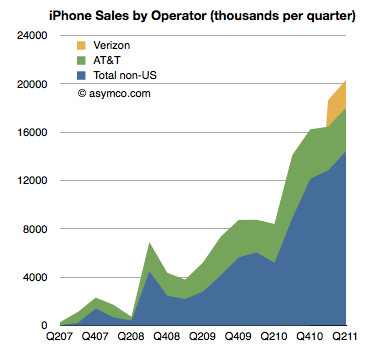
    The first chart shows historic AT&T activation with Verizon activations added. It also shows sales to "none of the above", namely non-US sales of iPhones[1].

    AT&T iPhone activations show no significant impact from Verizon and Verizon itself shows a modest start to sales[2]. What did not happen is an exodus from AT&T. We also did not see a rejection of the iPhone by Verizon customers long exposed to anti-iPhone Droid advertising. We also did not see a considerable impact of Verizon on growth.

    Verizon did contribute (4.5 million Verizon iPhone users is nothing to sneeze at)  but the contribution was to a degree that was nowhere near a big bang.

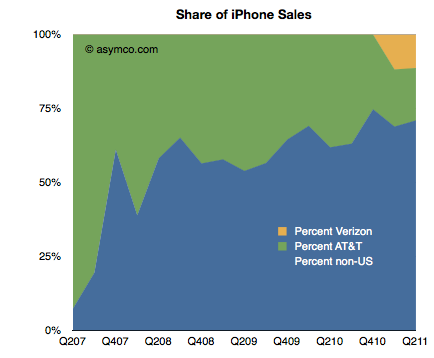
    That was because the real big bang was from the rest of the world. The same data in the first chart is shown below as a stacked area chart and a share chart. Had Verizon not come on board the business would still have grown year-on-year over 100% (and sequentially).

    The US activations have been decreasing as a percent of total iPhones sold. Before Verizon came online, the US share was decreasing (from an average of 45% share in 2008 to 33% in 2010). After Verizon, the US continues to slide to an average of 30% share (two quarters).

     After waiting nearly four years, American observers of the iPhone could perhaps be excused for their obsession on the impact of expirated AT&T exclusivity. But the real impact is that by the time it came, it was moot.

    It would be a mistake to look upon Q1 and Q2 and say that the explosive growth was due to Verizon or the end of US exclusivity.

    The global market is far greater than the US and the iPhone business has simply grown to reflect that.


    ---

    Notes

    1. Non-US sales are total iPhones sold minus activations in the US. There is the possibility that some of the unactivated phones were activated on T-Mobile or that there is some delay between purchase, channel inventory and activation, but the time frame shown should smooth out any of the noise.
    2. What we don't know is what was the impact of iPhone sales start on Verizon's other smartphone platforms. Unfortunately, Verizon does not report overall smartphone sales/activations so we can't conclude directly that iPhone has slowed other platforms on Verizon. Some other data (NPD, Changewave, ComScore) do indicate some slowing in Android growth in the US but we have no definitive data to prove it.
  4. Apple has moved on

    Research · 36 comments

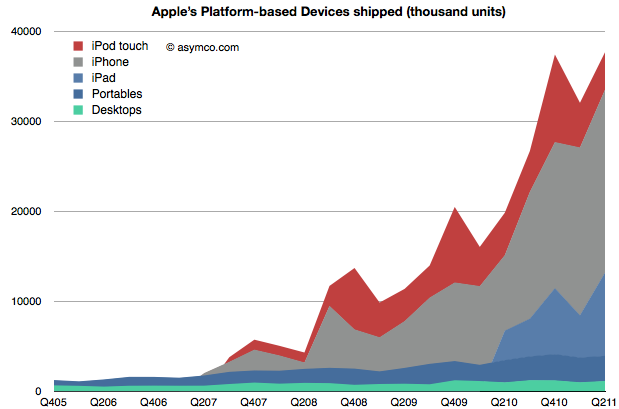
    When Apple changed its name from Apple Computer to Apple Inc. they signaled that their business has moved on. We can say it's to devices or to mobile computing or to the Post-PC era. To understand that this is not a shift driven only by wishful thinking we can plot the change in volumes for the platform-based devices Apple sells.

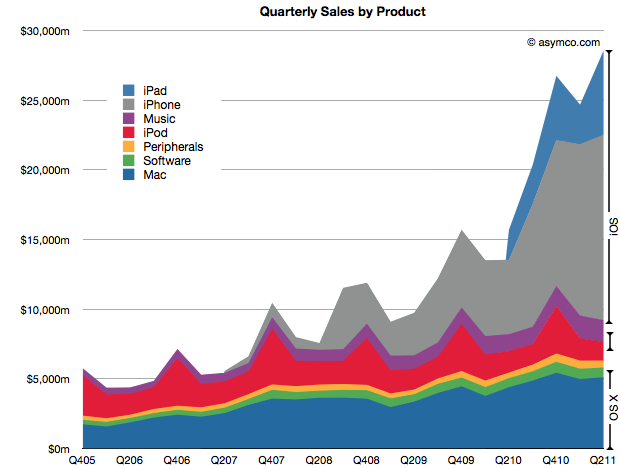
    The stack of products is shown in an increasing level of mobility. At the bottom is the non-portable desktop Mac, above are Mac portables (laptops) followed by the iPad, iPhone and iPod touch. The mobile computers Apple sells are explosively more popular (and important).

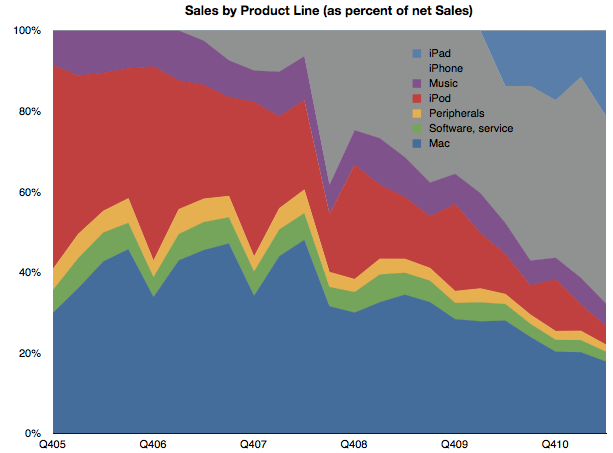
    To gauge importance consider the following chart which shows the unit values above multiplied by the average price they are able to obtain for a picture of the sales mix.

    (I also added Peripherals, Music and Software sales as well as iPod (non-touch) for a complete split of revenues).

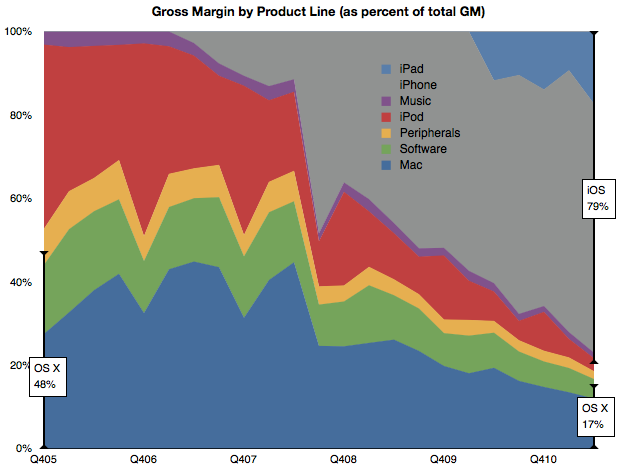
    Mobile computers are now well above half the revenue base for Apple. Finally, if we consider the contribution to profitability of each product line, we can see how iOS-enabled products (as a proxy for mobile computing) have become the vast bulk of profit creation for Apple.

    By this metric, we can see that mobile computing (as opposed to portable or immobile computing) is driving 80% of Apple's profitability. This 80/20 mix of mobile/non-mobile should put aside any doubts that Apple has moved on to be a business oriented around mobility rather than traditional computing.

    This cannot be said for many of Apple's contemporaries. Microsoft derives negligible revenues from mobility. Neither does Intel, nor Dell or HP and even Google's revenue lines don't make mention of mobile income.

    In fact, the only companies which do have mobile revenues as 80% of their income are those dedicated to telecom markets. Namely, Nokia, Motorola, Sony Ericsson, RIM et. al. But, as we shall see in the quarterly mobile market overview, few of Apple's mobile-focused competitors are doing well.

    So Apple is a unique company that has made the transition from one industry to another and, in so doing, captured the bulk of the profits. In passing, I should also mention that the traditional Mac business is still doing well and, by some measures, is capturing the bulk of the PC hardware profits.

    So the key to much of assessing Apple's value and opportunity should be based on this new market (mobile computing) rather than the traditional competitive landscape of PCs and operating systems. The company has moved on, now we wait to see how long before analysis of the company follows.

  5. Apple's growth scorecard for second quarter 2011

    Research · 83 comments

    Apple's second calendar quarter was a record breaking performance. This is surprising because it shows super-seasonal performance. For as long as I can remember the fourth calendar quarter (i.e. holiday) was always the strongest quarter, by a large margin. This quarter was higher than the last holiday quarter. A glance at the following chart shows the anomalous performance:

    iOS products make up 71% of sales (and at least 78% of profits) which makes the following growth scorecard a bit moot.

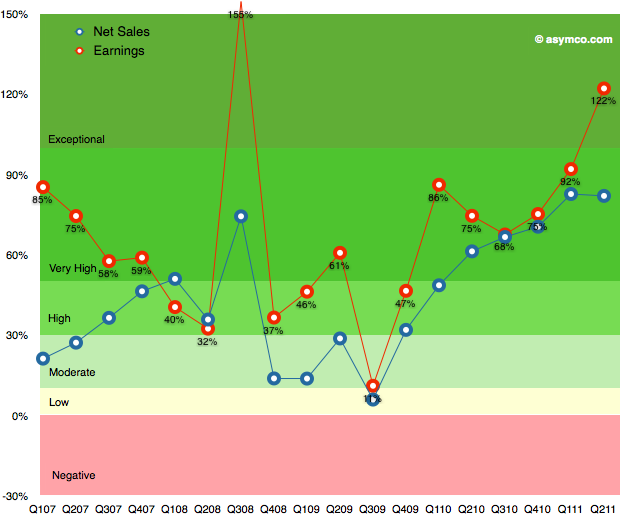
    The growth in iPhone sales of 150% is hard to understand given the previous product cycle, but more about this later. The 122% growth in profits is (nearly) unprecedented. The growth in Q3 2008 was due to the launch of the iPhone 3GS and since there was no iPhone launch this quarter the growth shatters existing assumptions about the franchise.

    The pattern in the table above is shown in the following chart:

    This performance needs to be digested and contemplated a bit longer but I will make one early conclusion: One of the most common themes during the last year was that Apple's growth rate was unsustainable. The theory cited was one of the "law of large numbers". Apple's performance shows it to be nonsense.

    Instead of decelerating, Apple's growth is accelerating.


  6. A new way to value Apple

    Research · 38 comments

    Almost all valuation models for Apple assume it's a hardware company. The modeling algorithm for hardware is simple:

    • For each year in near future
    • For each product line
    • Compute contribution
    • Determine company value by summing contributions and multiplying by a P/E ratio

    The major difficulty is in predicting the growth of each product line. This is difficult because buyers can be fickle. Companies employs all sorts of tools in order to secure repeat customers but if switching costs are low, the company can crash in value. For this reason, analysts pick various ways to predict device  sales. Some choose to index each product on production (channel checks), demand (customer surveys,)  or even on a top-down share of total (market research on growth of whole market and assumptions of share).

    Although simple and convenient, this model does not probably match the way Apple is managed. The company does not build hardware products to sell and forget. It builds platforms which are best seen as sources of recurring revenues. Users are incentivized to continue buying devices. iCloud, iTunes and other Apple properties are expressly designed to that goal--and they are not cheap to run. So, the company must see the world through a different set of lenses than the default model shown above.

    To think about the business like they do, we need to put the data through a similar set of lenses. I began with a modest proposal last month to value each user as a source of recurring revenue. Now it's time to expand on this method.

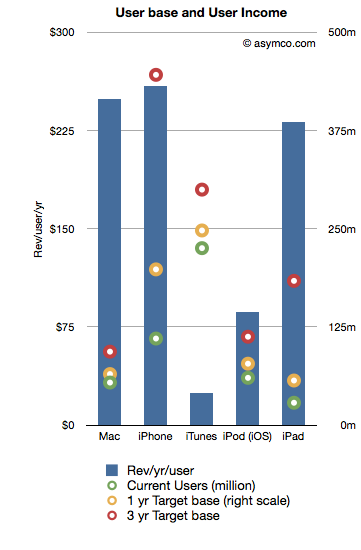
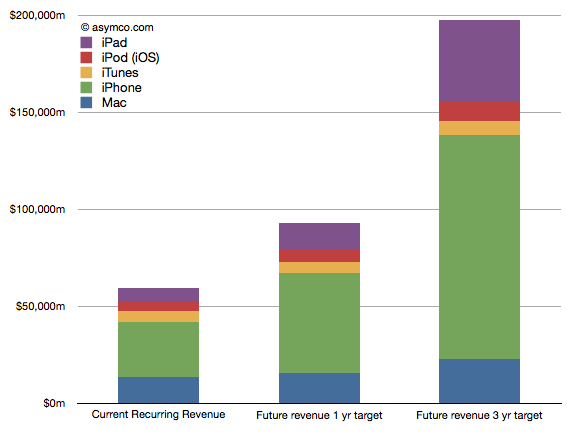
    The following chart shows the recurring revenues per user by product and the current and possible future size of user bases.[2]

    Revenues/yr/user are bars with the left axis and the User bases are various colored circles indexed with the right axis.

    The assumptions that went into the data are as follows:

    1. Device life span is as per previous article linked above
    2. User base growth for 1 year is: Mac 20%, iPhone 80%, iTunes 10%, iPod 30%, iPad 100%
    3. User base growth for 2nd and 3rd years (recurring): Mac 20%, iPhone 50%, iTunes 10%, iPod 20%, iPad 80%.
    4. The Revenue per user is assumed constant

    Note that the user base growth figures are lower than the product growth levels seen historically. Obviously, the model is highly sensitive to these growth assumptions so they need to be scrutinized and tested rigorously.

    Nevertheless, as a straw-man proposal,  the recurring revenues for all these products[1] is shown in the following chart:

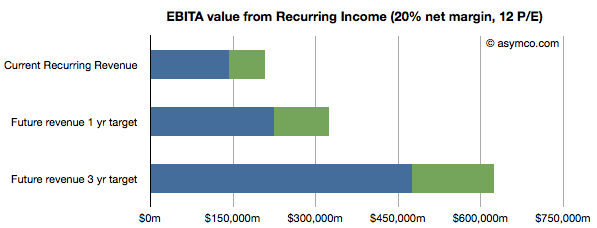
    Once the income is estimated, we can take that value and assume a profit margin (net) and then multiply the earnings by a multiple. Using a 20% net margin and 12x P/E yields the following chart.

    (I added an assumed level of cash in green.)

    This model would imply that the company today could be valued at $208 billion on the basis of its installed base alone. That value would be about $323 billion in one year and $620 billion in three years. Dividing by the number of shares outstanding (935m this year increasing at 2% a year) yields a share price of $222, $339 and $629 by mid 2014.

    These values can be considered "lower bounds" on valuation since they assume income from previously secured customers. The speculative part of investment would be based on what the future bases will look like (so, for example, if one believes these assumptions, the $629 figure could be considered a target to be discounted to today).

    ---

    Notes:

    1. Excludes Software, Peripherals, non-iOS devices, and any other service revenue.
    2. Compare this char to social media companies (MIT Technology Review)
  7. How much is an iOS user worth to Apple? About $150. Every year.

    Research · 48 comments

    During the last WWDC Apple revealed that there were 54 million active Mac users. If we look at the history of the product we can see that it took about 5.5 years to sell 54 million Macs. If we assume therefore that the average lifetime of a Mac is 5.5 years and knowing that Mac sales generated revenues of about $73.8 billion then we can estimate the average revenues/year/mac user: $250.

    Repeating the exercise with 180 million current iOS users who purchased about 200 million iOS devices and assuming a life span of 3.5 years gives the average revenue/year/iOS user of about $150.

    These are recurring figures. If we assume these users are loyal then they will likely spend this amount indefinitely and each additional user will be worth a similar amount.

    So, for example, if we assume that the number of Mac users reaches 100 million then we can also assume that they will generate about $25 billion/yr in recurring revenues.

    Likewise, if we extrapolate growth of iOS to 500 million users then we can assume they will generate $74 billion/yr in recurring revenues.

    Adding these together gives a potential recurring income level of $95 billion/yr for installed base alone (excluding iPods, Peripherals, iTunes apps/songs, and Software sales.) Today that figure is about $40 billion/yr. [1]

    Interesting valuation exercises can follow. [2] It would also be interesting to perform a similar analysis for other vendors/platforms.

    ---

    Notes:

    1. Note that actual sales are considerably higher than this figure as new customers are added. These figures should be considered "baseline" sales.
    2. Thanks to a kind reader for suggesting this line of analysis.
  8. Thinking over Apple's value

    Research · 71 comments

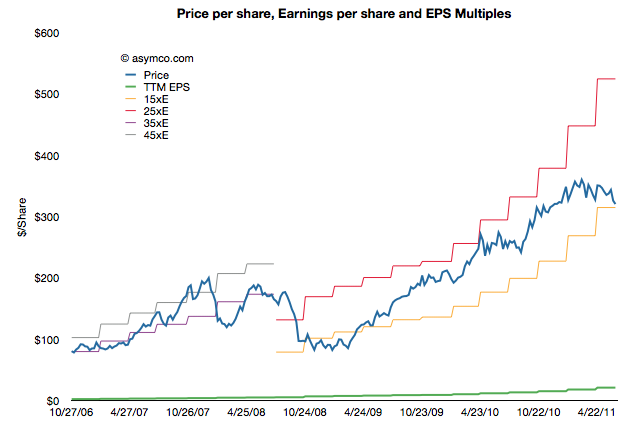
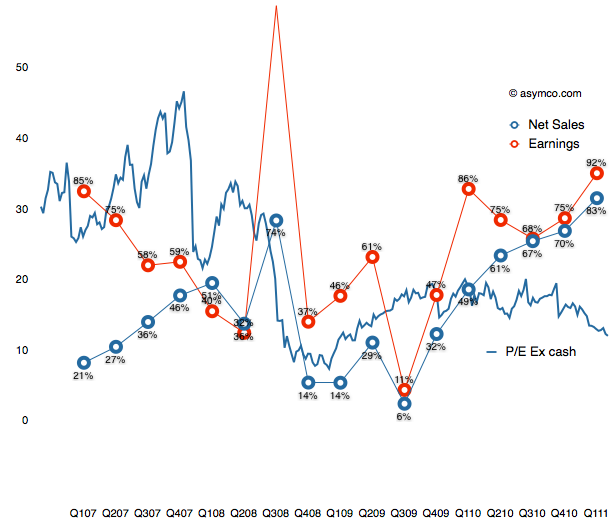
    In intra-day trading Apple's stock price traded at a P/E ratio below 15. That threshold is now at a price of about $315/share. Excluding cash the P/E is under 12. On a forward basis, there is widespread agreement that Apple has the reward (yield) profile of a bond without the risk of inflation.

    The history of the P/E ratio and the share price is shown in the following chart:

    As the chart shows, Apple traded in a range of P/E between 35 and 45 until late 2008 and has been trading between a range of 15 and 25 since about spring 2009. It might seem that the price is rewarding growth, but it's not.

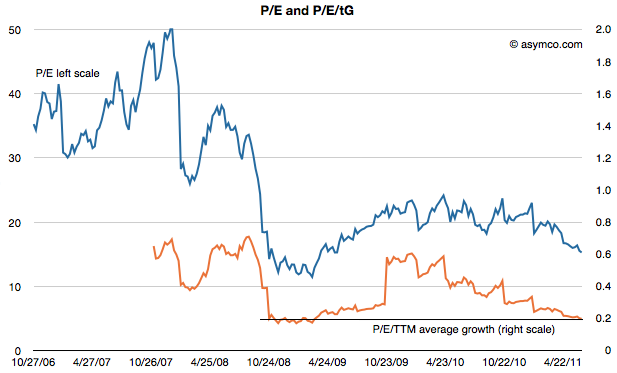
    When adjusting for the growth the company has maintained, the company is at a similar P/E/tG (Price/Earnings/trailing Growth) to the depths of the recession.

    At the trough shown above, the company was growing earnings at high 30% rates and sales in the teens. Today the company is growing earnings at 92% and sales at 83%. the following chart shows P/E ratio vs. growth.

    From a historic perspective, Apple is as cheap as it was at the bottom of the recession. At the time there were many reasons given for why the company would suffer 'headwinds'. Most commonly cited was that the company was a maker of "luxury" products and luxury does not sell in a recession.

    Today reasons being given for why the company will not prosper are far more nuanced. I won't re-iterate them but they deal with competition, platform issues, production issues, sympathy with companies that are failing, and saturation of markets.

    The trouble is that these arguments are easier to refute than the luxury vs. economy argument.  Exactly because the arguments are more precise, there is data that can be used to counter pessimism.

    And yet, with or without data, markets sometimes decide that profits are not reliable indicators of value created or potential for value creation.

  9. The app industry vs. the music industry

    Research · 25 comments

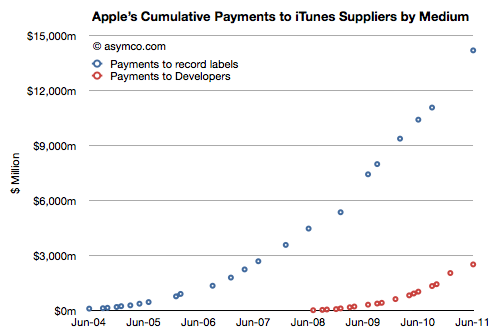
    By my estimate, Apple has paid out $16.6 billion to content owners. $2.5 billion to app developers and about $14 billion to music companies. The developer payments are published by Apple, the music payments are estimated based on total downloads and guesses about the split and pricing of that content (90% for the content and $1 to $1.2 average pricing over time.) There might be reason to move the music figure up or down but the difference will still be nearly a factor of 5.

    The cumulative payments are shown in the following chart:

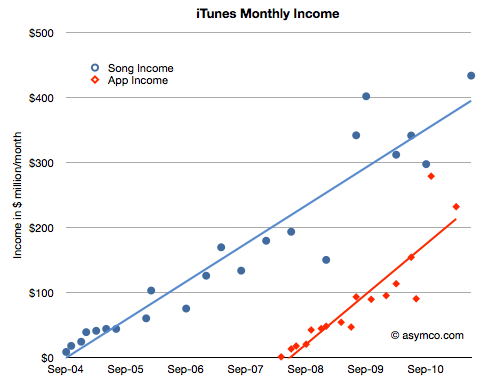
    From this perspective, the music business is still a far bigger ecosystem than apps. However that's cumulative data and digital music has been around far longer. The story can be told a different way: What's the rate of sale in the present period? From what we know about the business, we can see what Apple takes in for apps and music (I've already estimated what Apple "keeps" after paying content owners)

    The combined "sales rate" is a remarkable $665 million per month, but the split now is that music generates only twice the income of apps (i.e. cumulative is a factor of 5 but on a monthly basis the factor is 2). But what should be more impressive is how quickly the app business is ramping. By the slope of the trend lines, it would appear that app income will exceed music income within three years. Therefore, it's only a matter of time before apps generate as much income (exclusive of advertising) as music.

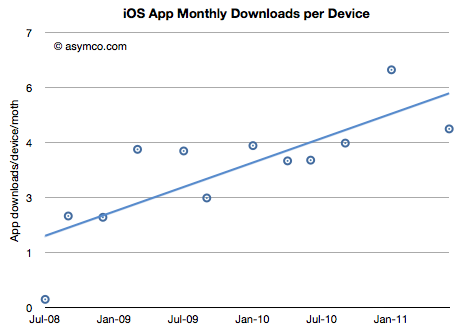
    Another perspective is the number of downloads per device per month. This shows that the rate of consumption of apps is increasing and is now about 6 apps per device per month.

    (You have to think of apps not as traditional computer applications or console games where each device has a certain number of expected apps attached, but rather that apps are more like a subscription where there is recurring monthly income).

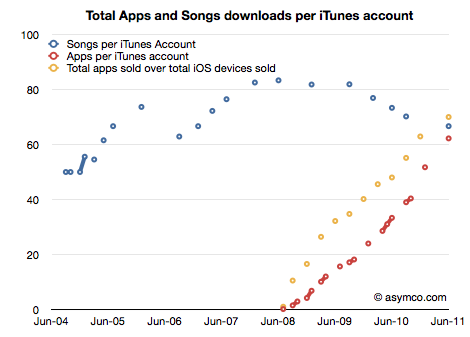
    I don't have a comparable figure for music because the number of iPods and Macs as target devices is hard to estimate, but I doubt consumption for music on a per device basis is increasing. As a consolation, I can estimate the number of apps or songs per iTunes account. Here the story is consistent.

    Each iTunes account has "consumed" about 67 songs but also 62 apps. Remarkable parity in such a short time. And the trend speaks for itself.

    All this data points again to the ascendancy of apps as a new medium. In a mere three years these digital objects have redefined themselves. They went from being tools to enhance the use of your phone to a new medium of expression and art. They have the ability to create a powerful economy of their own and will likely lead a profound shift in where value resides in mobile computing.

  10. iPhone liquidity: Why an unlocked Phone in the US matters

    Research · 93 comments

    The iPhone is now available in the US unlocked. Judging by the lack of reaction to the news, one would assume that this is not a significant event. I would argue however that it's a very significant event.

    What is unappreciated is that the iPhone is a very restricted product. Unlike any of Apple's other products (iPod, Mac and iPad), the iPhone is designed to be hard to get. Apple did not make it easy in the one dimension of ease that matters most: its purchase.

    Consider that many people in the world cannot buy an iPhone because it's not available locally. In case it is, in most cases you need to sign a contract and commit to a long-term relationship with a company other than Apple. In those cases where you don't sign a contract, you cannot use it with a service provider other than the one (arbitrarily) chosen for you.

    A few have been able to buy iPhones unlocked if they lived in a few countries (UK, France, Australia, Belgium, Hong Kong[1]) but those phones could only be purchased online if sent to a local address or in an Apple retail store--of which there are not many.

    Consider that in Europe alone, the following countries do not have iPhone distribution: Albania, Armenia, Azerbaijan, Belarus, Bosnia, Georgia, Iceland, Kazakhstan, Serbia and Ukraine. The populations total over 100 million people. In Asia the number of countries without iPhone distribution outnumber those with distribution. Add in Africa, Latin America and the Middle East and the unaddressed market begins to look very large.

    If you contrast this with every other phone platform out there, Blackberry, Android or Symbian, the iPhone is extremely restricted and the number of people that are permitted to buy it much more limited. The number of operators supporting Blackberry outnumber the iPhone at least by a ratio of two to one.

    Then there is the matter of distributors. This is a channel that iPhone does not leverage. Distributors account for more than half of Nokia's volumes. They buy in bulk and resell (sometimes illegally or in violation of contracts) vast quantities of phones.

    By offering unlocked iPhones in the US, the restriction on distribution is lifted to a large degree. What's different is that these phones can be purchased in 200+ retail locations. Many of these locations are in tourist hubs where there are large diaspora communities rotating continuously back to home countries. iPhones can now be purchased with cash and become as good as cash.

    And this is not a new phenomenon. When the original iPhone was available, Apple had to restrict buyers to 5 per person and stopped accepting cash because of the huge grey market demand. The same thing happened with the original iPad and with iPad 2 lines are still forming for it because distribution is so restricted. Consider also that sales in Verizon stores pale in comparison with those for GSM products.

    The way to think about it is that the iPhone has just become more "liquid" and it can now flow to parts of the world where it has been difficult to acquire. The iPhone was already liquid to some degree with unlocking and sales through Hong Kong/UK, but the US market's retail footprint and the lower costs that result will boost liquidity dramatically and probably increase volumes substantially.

    ---

    Note:

    1. According to Apple, the following 27 countries offer phones which are not "locked to carrier" : Belgium, Czech Republic, Finland, Germany, Greece, Italy, Luxembourg, Russia, Slovakia, Turkey, Hong Kong, India, Indonesia, South Korea, Macau, Malaysia, New Zealand, Singapore, Taiwan, Thailand, Vietnam, Bahrain, Kuwait, Qatar, Saudi Arabia, United Arab Emirates, South Africa

  11. Is Nokia worth less than Skype?

    Research · 57 comments

    Yesterday Nokia warned that its guidance for the quarter and the year were "no longer valid." The surprise to me is that management was surprised. In February I warned that even if Nokia could fool consumers into buying products whose platform was publicly executed, distributors and operators would not likely go along with the deception. Pricing collapse is the proof of a channel breakdown.

    That seemed predictable. What I struggled with was how Nokia itself could present such an optimistic forecast. Absent any explanation, Nokia's forecast of robust sales for Symbian products into the near future belies a failure of understanding of the dynamics of platforms and especially the impact of destruction of trust and brand value that commenced in February. Distress is a slippery slope and it does not model well in a spreadsheet. It takes a leap of non-linear faith to predict the piling-on effect on the up- and the down-side.

    Faith in the company's guidance meant that the market reacted to the bad news by discounting Nokia down to a market cap of $26.7 billion. One analyst even cut his target price down to $4/share, 57% of yesterday's close. How can this fair? What is Nokia's phone business worth?

    Here's a quick sum-of-the-parts analysis. After yesterday's hair cut Nokia's overall enterprise value is about $20 billion. The Navteq part of the business (purchased for $8.1 billion in 2008) could get a value of $3 billion (based on about 3x sales) and the value of Nokia Siemens networks could be at $6b (less than 0.5x sales). That makes Nokia's phone business worth about $11 billion.

    An alternative view based on "the Motorola case study" $4 target price would imply an overall enterprise value of $11 billion. This either makes Navteq and NSN worthless and Phones worth $11 or it makes the phone business worth a lot less than $10 billion. Perhaps less than $8.5 billion which is what Microsoft paid for Skype. Should we be shocked? Nobody would argue that Nokia is worth more than Facebook so who's to say that Skype or Twitter aren't more valuable than a device company in crisis?

    I don't try to predict the market's behavior, nevertheless, the markets are now very skeptical that there is much in Nokia to salvage. It's perhaps unfair and illogical but this is the end game of disruption. It ends much more suddenly than it begins. It's the consequence of nobody noticing the beginning that makes the end so shocking.