[Goldman Sachs analyst Bill] Shope also expects both iPad and iPhone sales to exceed expectations in 2011; he sees sales of 37.2 million iPads next year, “which could potentially make Apple one of the largest vendors in the global personal computing market,” if you include both tablets and PCs.
Apparently, it's not just the crazy ones who dare to think the iPad is computer.
My forecast for iPad in calendar 2011 was set at about 33 million since last summer. I may raise it if Q4 units top 6 million.
Meanwhile...
He re-launched coverage of the stock for Goldman this morning, setting a Buy rating and $430 price target, while placing the stock on the firms “America's Conviction List.”
I don't make stock price forecasts as they are based on a random number called 'sentiment'. But by forecasting earnings and assuming a range of P/E multiples between 15 and 20 (essentially in-line or below the S&P 500) values Apple's stock at between $360 and $480 by this time next year.
Goldman's target of $430 is about in the middle of this range so I don't see it as requiring much in the way of conviction.
[ITG sent an explanation of their methodology and there is no indication that the data represents inside information.]
ITG Investment Research analyst Matthew Goodman is forecasting monthly sales record for all of Verizon's devices "based largely on our proprietary daily point-of-sale data from thousands of independent wireless retailers across the US."
Assuming the data is accurate, we are going to dive into it but I will state up-front that without confirmation, the conclusions below should be taken with a grain of salt. All statements should be read with a preceding "if the data is accurate..."
So, if the data is accurate, here is what I conclude [1]:
Verizon Has three strikes against them:
The iPhone has stolen their growth
They are facing the prospect of a single OS platform supplier
Android is not competitive vs. iOS
The iPhone has stolen Verizon's growth
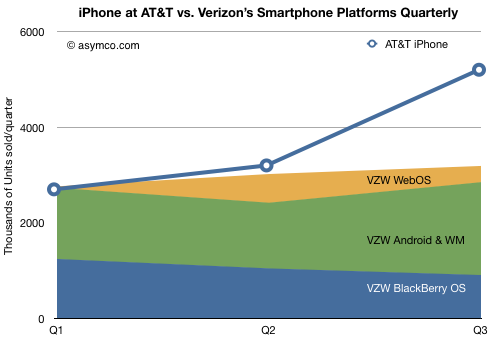
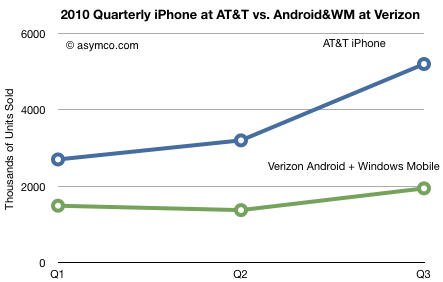
The chart below shows the performance of all of Verizon's smartphones vs. the iPhone at AT&T. The area chart shows how Verizon's volumes grew from 2.7 million in Q1 to 3.3 million in Q3. Not a bad story in itself. However, the iPhone at AT&T went from 2.7 million to 5.3 million in the same time frame. Relative to just the iPhone, Verizon has been underperforming over the last quarter.
Those additional 2.4 million iPhone/AT&T activations in Q3 could be due to replacements but the same could be said for Verizon's volumes. The fact remains that iPhone alone is nearly twice the volume of all of Verizon's smartphone activations.
Just to be clear, this is a direct, apples-to-apples comparison. AT&T and Verizon smartphone performance figures are highly comparable. The two operators are highly representative of the US market. AT&T and Verizon Wireless raked in 75% of all mobile data revenue in Q2 of 2010 and account for 62% of the U.S. wireless customer base.
In addition, Verizon enjoys a larger customer base (has 92.1 million subs vs. AT&T's 90.1 million.) Over the time frame of the data the overall market did not increase dramatically therefore the conclusion that AT&T's win is Verizon's loss is plausible.
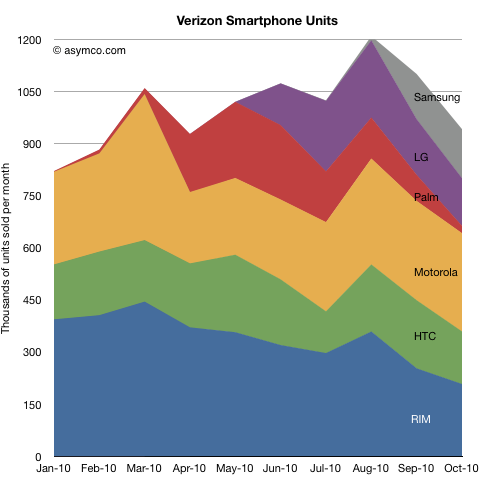
I used quarterly data so that iPhone at AT&T could be compared. But if we look at monthly data, the story gets worse:
These are absolute volume figures. You can see how RIM's fade was replaced to some degree by new vendors. However, growth hit a wall in August. Following widespread iPhone 4 availability, sales dropped. Coincidence? Perhaps, but the drop happened even with the addition of Samsung volumes.
That's strike one.
Verizon is facing diminished degrees of strategic freedom
The other notable is that even though Verizon doubled the number of vendors selling smartphones, it seems they are growing their smartphone base slower than the overall market.
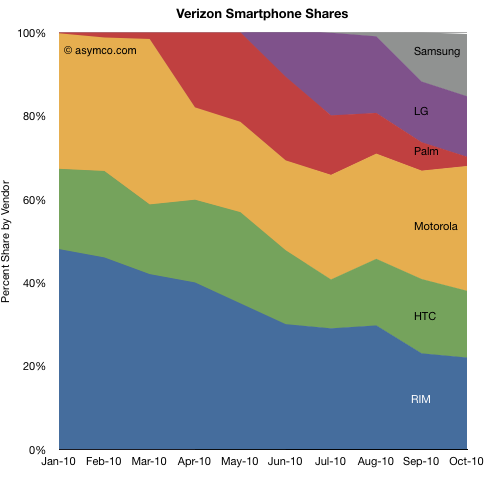
Consider each vendor's share is shown below:
From three vendors to six. Shares are roughly evenly split (except for Palm) but none of these vendors are able to drive volume growth.
Consider that Motorola Droid is outselling RIM. This should be rightly noted as amazing. It plainly shows the power of Android. However that power is not something Verizon will benefit from. Quite the opposite.
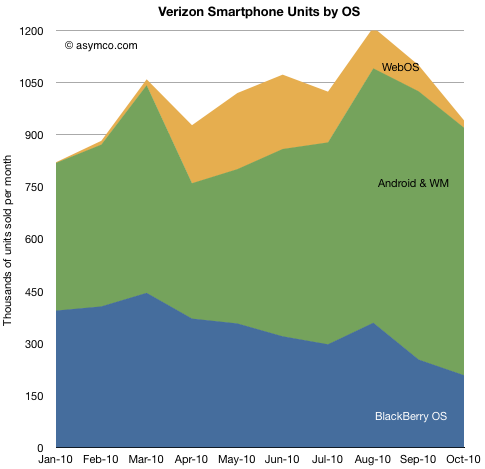
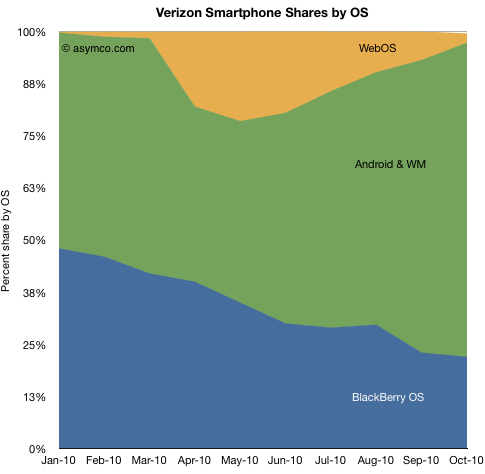
Consider the share map by units and share of each OS:
Android (and WM, though that's likely to be a very tiny part of the green area) made up 75% of all smartphones sold in October. It's possible that the share could grow to 90% as RIM continues to fade.
For Verizon this would be a serious problem. Although Verizon used to have a disproportionate share of RIM's products, that OS was not enabling an ecosystem like Google's. It was a product narrowly defined around messaging. Verizon is facing the prospect of a single OS supplier who may or may not maintain alignment with Verizon's core profit algorithm. If they diverge, Verizon's bargaining power will be strictly limited.
Strike two against Verizon.
Android is barely enough to keep the battle with AT&T from becoming a rout.
In an apples-to-apples comparison, in Q3 the iPhone at AT&T outsold Android at Verizon (remember, same addressable market) by a factor of 2.5. This is with a variety of devices and vendors thrown in the market. We hardly ever get to see this finely grained a comparison when looking at platforms.
I wrote this up as a lack of competitiveness. It may seem provocative, but I define competitiveness narrowly: the competition is for a purchase decision on equal terms. These purchase decisions are fiendishly complex to predict, but the data speaks: whether it's due to brand, visibility or performance and in spite of "antennagate" the iPhone is cleaning up.
That's strike three.
The devil they know
By 2009, Verizon was probably optimistic that they could head off AT&T (and Apple) at the pass. With the vast array of vendor Android roadmaps laid out in front of them they saw a way to stem the flood of defections. I think that optimism dissipated sometime this year and was replaced by a more dreadful prospect than what iPhone presented in 2007.
It is perhaps coincidental that the rumors of a Verizon deal with Apple seem to have started in earnest right after August. It's thin, circumstantial evidence, but the only evidence we have to corroborate the data above is that Verizon has been signaling more desperation.
Reading further into the data, I would say Verizon faced these problems and decided that they had to throw in the towel. Apple may be the devil, but so could be Google. Apple was predictably evil. But Google? The devil you know is perhaps better than the one you can't predict.
What's more, the devil Apple seems to be helping your worst enemy way too much and the unpredictable one does not seem to help all that much.
Final question: how many iPhones will Verizon sell
I think this data shows that Verizon has another reason to sell the iPhone. The underperformance of their smartphone franchise is not the only determinant, but it is perhaps another straw on the camel's back.
What would happen if (or more likely when) Verizon sells the iPhone? I believe they will sell them at the same rate as AT&T does.
The data shows that Verizon sold, on average, about 3 million smartphones per quarter during the first nine months. That's about 1 million a month. That was based on three platforms, six vendors and widespread promotion.
The iPhone sold almost 4 million a quarter over the same time period.
Verizon users bought smartphones at a lower rate than AT&T users bought iPhones. This is even though the two carriers have approximately the same subs base which churns very slowly. Since a mass-market product will appeal equally to statistically equivalent populations the product should be taken-up with similar vigor.
So the question is not whether Verizon can sell iPhones at the rate of 4 million a quarter. The question is only whether these 4 million will be in addition to the 3 million that are currently buying non-iPhones.
My guess is that the 3 million run rate for non-iPhones will drop, but not to zero.
The impact on the other vendors supplying Verizon may be strongly negative depending on the level of promotion Verizon puts on the product. That promotion budget is usually fixed as a percent of sales. What Verizon applies to iPhone will be taken out of what is spends on Droid. I have always said that operators will be motivated to balance their supplier power. The promotion budget is the primary instrument to meet that end.
On the other hand, the overall market will grow so 2010's 3 million/Q will be 2011's 6 million/Q. There is plenty of room for multiple platforms.
So my conclusion remains that iPhone will find at least 8 million new users with Verizon. The analysis above give me confidence to increase the upper bound to possibly 12 million.
Verizon striking out means they need to change the way they play. The iPhone is a new ball game.
------
[1] To assemble this discussion I used only the data provided in the article linked above and the officially published iPhone activation numbers from AT&T. Obtaining specific smartphone vendor volumes is a matter of reverse engineering the share chart and cross-referencing it to the table of vendor sales.
When I wrote my opinion on the future of publishing (Citizen Publisher), I focused my lens on books and magazines. Published works that have relatively low time-sensitivity and hence relatively long shelf life are quite different from newspapers which package material with very brief temporal relevance.
The print-based news industry has suffered much more than print-based books and magazines. The primary cause is that "print" plays a far larger role in newsprint-based newspapers than in books.
To give you an idea of how important the printing plant is, consider that a huge proportion of a newspaper's assets are tied up in its printing plant. That plant is so large and so demanding that it ends up causing the whole business to revolve around it: Print runs are done at night to make sure the product is delivered in the morning. That puts a hard deadline on the writers to submit stories before the product is "frozen" into a final edition. Writers and editors and advertisers need to march in lock-step to the cycle time of a big manufacturing operation.
There are 19 presses and 17 printing plants that print the two million copies of the U.S. edition of The Wall Street Journal. To make changes to the plant require large amounts of capital investment and that capital's depreciation is an integral part of the financial balance of the company. So much so that one wit remarked that a newspaper is nothing more than an instrument that permits the depreciation of a printing plant.
Costs of manufacturing have been slightly offset by better technology and distributed printing but newsprint itself has soared in price so the dependence on physical product has made the economics worse over time.
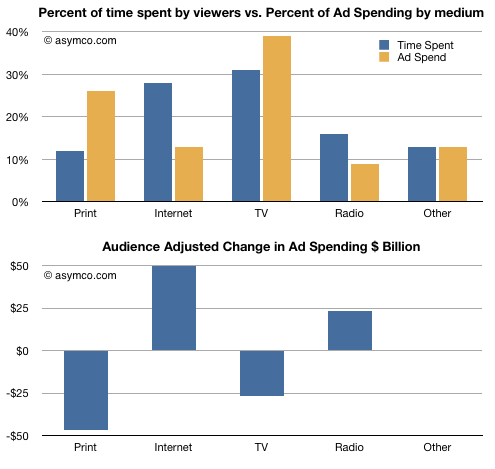
That's the cost side. But if you keep following the money from the revenue side, you realize that the situation is critical. In the US, a large part of the local paper's revenue base was wiped out by Craig's list. Classifieds are a fading memory. With respect to regular ads, the story is almost as bad. 26% of ad spend in 2009 was allocated to print, while only 12% of time spent consuming media was spent on it. In contrast, Internet use is at 28% of time where only 13% of ad dollars are allocated.
Source: Morgan Stanley Internet Trends Presentation.pdf
It's inevitable that advertisers will shift their budgets to follow where the attention is going. Potentially that's a $50 billion shift into Internet advertising. The number nearly matches the $47 billion loss from print.
This future is not far off. In fact, it's already happening. in recent years the number of newspapers slated for closure, bankruptcy or severe cutbacks has risen—especially in the United States, where the industry has shed a fifth of its journalists since 2001.
Once the printing plant is taken out of the equation, the raison d'être of the package itself ends. For this reason, the newspaper product cannot survive on-line. Reading news is still very popular, but newspapers aren't.
So will the iPad save this medium?
As in Citizen Publisher, I argue that for that to happen, the medium needs its Orson Welles. Furthermore, to have him emerge, the business must be architected as an integrated approach to solve a new job to be done.
The latest story from The Guardian suggests that Rupert Murdoch is working on just such an approach. In another interview Murdoch explained the project in more detail:
What is the biggest thing on your mind now?
...There are so many disruptive technologies coming all the time! [This in almost a whoop of excitement.] Pretty. Damn. Interesting! Just trying to stay ahead of the technology. I'm starting a paper in six weeks. A brand new paper. It will be a bit like the New York Post . But it will be national. Have that sort of humour and attitude like the Post . It will only be seen on tablets. It will only employ journalists - and maybe eight to 10 technicians.
What sort of circulation will you need?
At the price we are talking about, that's $1 a week - not a day, a week - we need 800,000. By the end of next year there will be 30 to 40 million iPads. I believe every single person will eventually have one, even children.
What's more, it's suggested that an unreformed disruptor is mysteriously involved. One can only speculate, but the hints of autonomy, dedicated (and incentivized) creative professionals involved in a new (not re-purposed) publication with a low-cost structure bodes well.
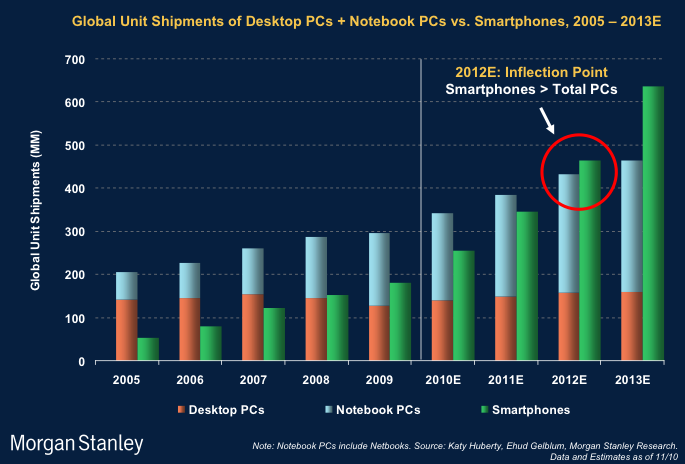
Morgan Stanley's Web 2.0 update came out yesterday and it's full of nice charts. Here is one:
Note that the expectation for smartphones to overtake all PCs (including netbooks) will happen when smartphones sell more than 450 million units per year.
In 2013 nearly 650 million smartphones are forecast to be shipped.
My estimate for the iPhone in that year is 180 million. That would give iPhone (excluding iPad and iPod) about 28% share. The last quarterly figure is around 17%.
Perhaps 180 million iPhones per year will be defined as failure by those who consider over 80% share as a threshold for success but I still think it will be a healthy business.
Even assuming a cut in ASP to about $350, Apple will still be able to get about $62 billion in sales from phones (a bigger number than 2009 total sales for the whole company).
I would also add that by the end of 2013 Apple will have sold about 470 million iPhones. Though many will be out of use by then, the installed base will not be small (I'd guess about 300 million). Including all iOS devices, 500 million is a credible estimated audience for developers.
It's entirely possible that Android variants, offshoots and forks will add up to a bigger number by then, but to pre-emptively declare the platform "war" won because the also-ran Apple will only have half a billion users seems disingenuous.
You really can’t stress this point enough: We’re a decade past Napster, but the music industry still runs on CD sales. In Warner’s case, digital now accounts for 25 percent of overall revenue.
What's even more amazing is that after ten years not a single industry participant has found a new job for which its product can be hired by consumers.
The music companies wait for Apple, Google, Spotify to "invent" some new consumption model from which they can extract a rent.
When mobile platforms are discussed, the conversation frequently turns to market share battles between Android and iOS. I've pointed out before that the problem with this reasoning is that market share in a market that's growing at 90% is a false measure of performance.
The more important measure is how much of the non-smartphone market is being taken by smartphones and how fast the whole phone market is growing. Competition with non-consumption is very different from platform warfare.
But even when discussing the rivalry between current platforms, the Blackberry and Symbian are often overlooked as contenders. Windows Phone and iOS come in and out of discussion only on the basis of press releases. The truth is however that Symbian, Windows, Blackberry are not going to disappear anytime soon. Why is that?
The reason is that when you stop framing the market as rivalry between platforms, you see that many buying decisions are driven by specific device value propositions or jobs that the products are hired to do. For many years smartphones were purchased because they had the best cameras or the best keyboards and users never downloaded any apps or even used data plans.
Later, smartphones were purchased because they allowed for browsing and gameplay. Very rarely did buyers opt for "iOS" or "Symbian". Most buyers don't even know what these words mean. Phones are rarely advertised according to their platforms. (As an aside, the mention of Windows in a PC ad is made possible by Microsoft funding, the same as "Intel Inside." So for platform recognition, someone needs to fund the promotion and that implies some revenue to justify it.)
To illustrate, consider the Blackberry: A product that continues to grow despite a completely different basis of competition from the large screen touch competitors. It comes down to being good at some very specific jobs. RIM continues to grow in certain markets like Latin America and the Middle East on the basis of BBM (RIM’s sales outside the U.S. climbed 94 percent last quarter from a year earlier.)
“A 15-year-old boy who likes a 15-year-old girl, sends her a BBM and he’s able to measure how important he is to her based on the speed of response after the letter turns to an R,” meaning it’s been read, he says. “No one else runs an end-to- end service plan like we do. That’s killer and is why it’s almost a social phenomenon.”
or
BBM is also popular in socially conservative Saudi Arabia where its speed -- messages are typically sent in less than two seconds, according to Morgan Keegan -- has made it a way for teenagers to communicate in a country where religious police bar unmarried couples from meeting in public.
You could argue that the other platforms also allow for free messaging (through free texting apps) but the combination of a low cost device, a data plan and attention to detail (like Message Read notification) gives the Blackberry an edge.
The general purpose smartphone that Google and Microsoft and Apple promote is still not the prevailing view of mobile usage for most buyers. One could also argue that many if not most Nokia smartphones are still being "hired" to do feature phone jobs.
The fact that all these devices are classified as smart and therefore competing misses the point that they are hired for different things.
In previous posts I detailed shares for units, sales and profits. I also offered different ways to look at the data like rankings and profit "area" maps.
This article is about the absolute numbers. What is the total market in terms of units sold, sales and operating profits.
The time frame remains from the second quarter in 2007 to the third quarter of 2010. The same eight vendors are analyzed (with "Other" available for units analysis only).
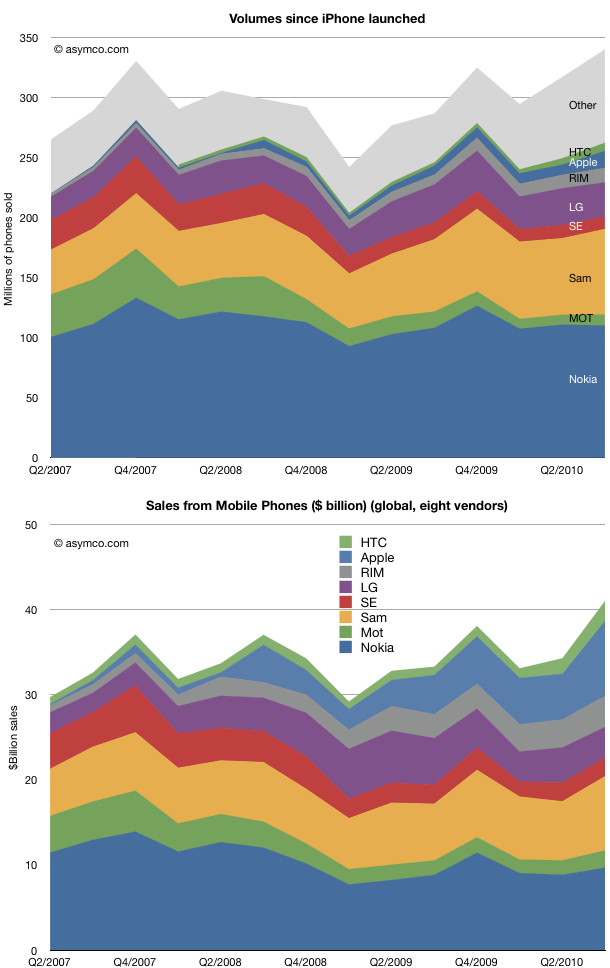
The first observation is that the market grew to new heights in Q3. 340 million phones in the quarter means that we might be looking at a very good holiday season. The market was range-bound due to the recession and its over-hang, but there seems to be a good indicator of macro-level recovery
On an individual competitor basis, the share snapshot pictures we saw earlier gave a good summary of the condition of competitors. Here we see the evolution of absolute units and sales over time. It's instructive to scan the two charts as a pair to see how units and sales are affecting the positions of the participants.
I clustered the "pure smartphone" vendors at the top of the charts so you can visually separate them from the broader portfolios of the others.
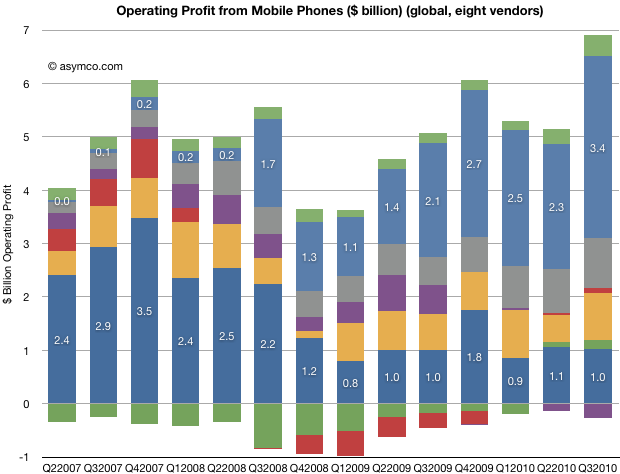
Finally, here is the evolution of total profitability (operating) for the participants. I annotated Nokia and Apple for calibration.
(note the color coding legend in the pervious charts).
What is most impressive is how LG, Motorola and Sony Ericsson seem to be in the same boat. At the same time, Apple, RIM and HTC are outstanding in performance. And Nokia and Samsung are stuck in a dilemma. On the other hand, every vendor is different in many ways, and it's inaccurate to paint them with the same brush.
Overall, we see a pattern of increased absolute value in the market. All but one vendor is profitable, and sales are increasing. A large part of the growth is due to the transition of the market to smartphones.
I am dead serious. I am now convinced that we have enough data to determine for a fact that Apple will not only see a dramatic decline in quarter-on-quarter sales in units of the iPhone this January-March quarter (which is the predictable pattern and no surprise) but that we will also see a decline in iPhone market share against at least HTC and Blackberry; that would be demoralizing news in itself. I know now that the numbers are clearly stacking up so, that the annual sales level of iPhone units, will result in a decline in iPhone annual market share in 2010.
Sales from its handset business climbed 20 percent to $2 billion last quarter, helping to narrow its loss to $43 million from $216 million a year earlier. The division had an operating profit, excluding some charges, of $3 million. Motorola said it shipped 3.8 million smartphones last quarter.
Motorola shipped a total of 9.1 million phones. This is down 33% from the year-ago quarter's 13.6 million units but up 10% sequentially from 8.3 million last quarter.
I'll summarize the top tier vendors' unit volumes, sales value, price and profitability in a few days.
Every quarter I try to score growth by top, bottom and product lines. As unforeseen growth is the only driver creating shareholder value, it's of paramount importance to measuring a company's performance.
For Apple, the analysis is fairly straight-forward. There are relatively few product lines (seven including the iPad). I measure y/y sales growth and try to form a picture that is easy on the eyes and mind.
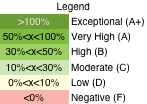
The method I'm using now is color coding growth for each line according to the legend to the left.
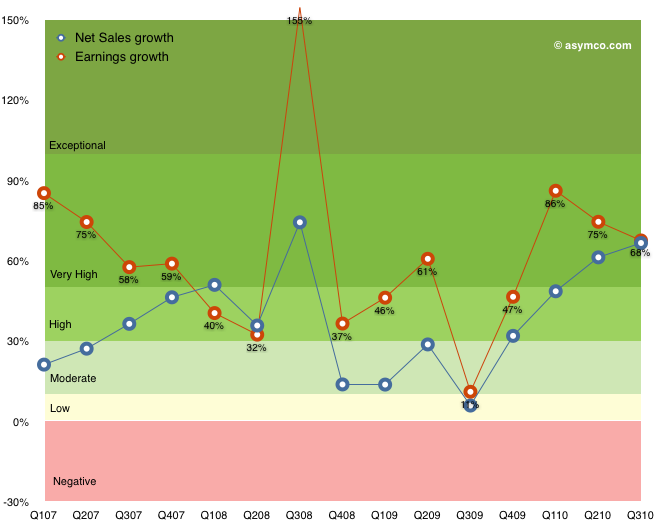
The table that follows shows each product plus the Net Sales and Earnings lines according to this color coding. I also added an average column for reference.
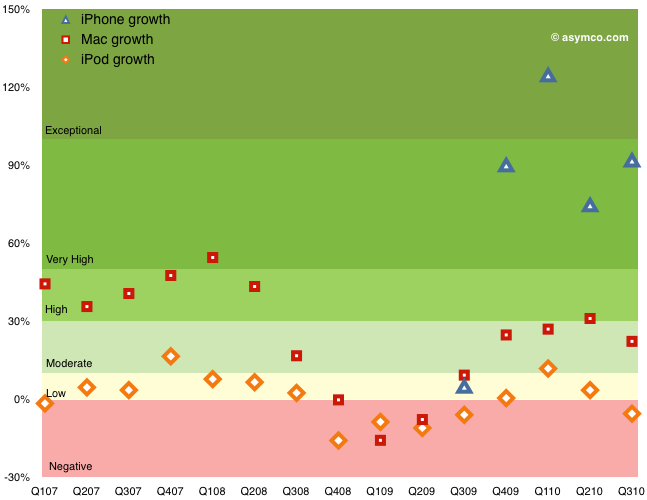
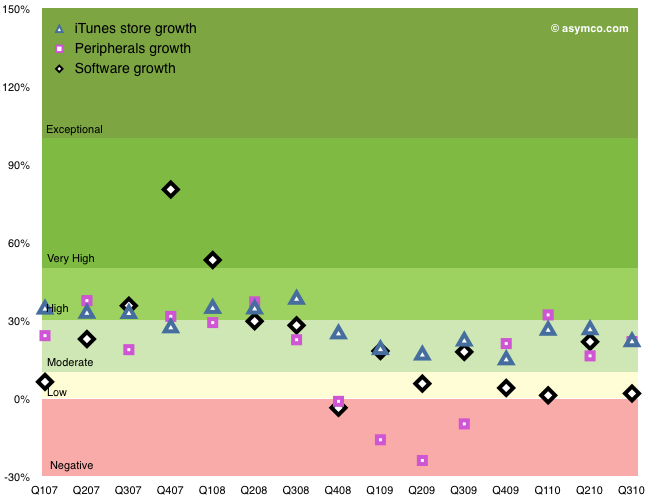
The following graphs show the same data with color coding for the rates as they change over time. I broke the data into three charts: Top/Bottom lines, Hardware Products, Other Products.
Discussion
Hopefully this representation describes the company's growth without requiring too much explanation. Earnings growth, which determines ultimate value created is near all-time highs, well into the "Very High" (A) growth band. Apple have recovered from the Moderate-to-High (B/C) bands during the recession and are near the levels of 2007 when the company was trading at a P/E of 50 (today's P/E for Apple is 20). Sales growth broadly followed earnings growth.
Within the products, the iPhone again shows exceptional performance. The growth during the first five quarters was (literally) off the scale (above 150%--see table for actuals). The average quarterly y/y growth has been 234%! Last quarter's 92% growth is very near the 100% threshold for exponential growth. This after three years in the market.
The Mac growth is Moderate (B) and that may be because it was not a launch quarter for portables. The Mac underwent Very High (grade of A) growth for a period of 2008. The iPod shows weakness. The product has been in a Low-to-Negative (D to F) band of growth since the iPhone launched. Clearly a mature product line but one which has been largely subsumed into the iPhone and iPad. The iPod touch is increasingly a large proportion of the iPod line.
The non-hardware product lines are Low-to-Moderate growth products. The Peripherals business tracks very closely to the Mac business and dipped negative during the recession.
Overall, the growth scorecard is in the "Very High" category, or a grade of "A", mostly driven by the iPhone and iPad. Whether this growth will be reflected in the share price is a question reserved for a future discussion.
After the last earnings report, many noted that Apple's gross margins dipped. Turley Muller noted in a letter to PED that the cause was probably the aggressive ramp in iPhone 4 production which broke new records at 14.1 million units.
That may be. My estimate of iPhone margin shows it dropping to about 49% from the more usual 55% (sometimes even higher). We'll never know exactly how much, but sometimes margins drop. RIM and Nokia are punished for drops in the GM percent so why shouldn't Apple?
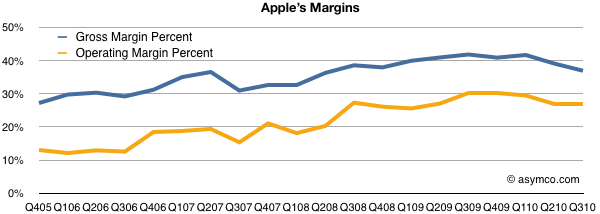
However, there are some other factors to consider: the overall margin is currently historically very high. As the high-margin iPhone makes up more of the total product mix, the overall margin should be growing. And it is. The chart below shows the trend since 2005. GM was in the high 20's five years ago.
Note however the other margin: operating margin. After taking the fixed costs into consideration (which we saw to be shrinking as a percent of sales), Apple's bottom line profitability has been rising slightly more rapidly than the GM. It has plateaued recently but not dipped significantly.
Also note that there have been dips in the past from which GM expansion resumed. One such dip was at the launch of the first iPhone in 2007, though we can't be sure that was attributed to the iPhone itself or to other factors like that most cited by management: components costs.
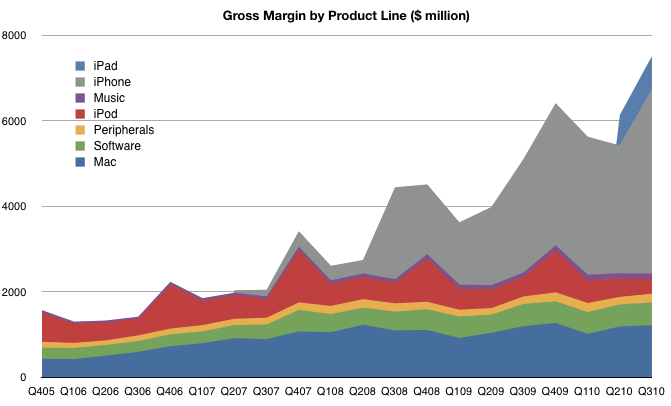
However, the bottom line profitability is only part of the picture. It would be instructive to look at which product contribute how much. You won't see this analysis often because the gross margin by product is not published by Apple and it takes quite a bit of guesswork to get there.
I maintain product-level gross margins and compute the overall GM bottom-up. The product-by-product line profitability is based on several assumptions which I won't detail here, but those assumptions lead to the following contribution chart:
There are several takeaways here:
The iPhone is huge (57% of gross profits). It is far more important than most people assume. Without it, the company would not have materially grown EPS since 2007.
The "Music" which includes iTunes revenues is tiny. Many people assume that iTunes is a large contributor to Apple's operating profitability but operating margins on the store are 10 percent. Peripherals add more to the bottom line than the iTMS/App Store. The benefit of the iTunes/App Stores is in the hardware sold.
Software contributes more now than the iPod. This is completely under everyone's radar but Apple's software business has been growing and with 80% gross margins (assumed) it's a big part of the profit picture.
The iPad margins are lower than the iPhone. As it grows in volume, the profit share will grow, but it's a long way from being the profit share leader.
This picture should also be a warning to Apple's competitors. If they seek to grow shareholder value and shift profits away from Apple they need to see just how much of that profit is captured in hardware. At the same time, they need to realize that it's the non-hardware businesses which make the hardware so desirable. Like it's products, Apple's income statement is very inter-dependent.