Asymco

Asymmetric Intelligence

revenue

  1. How does the Mac gain share while increasing its price premium over the Windows PC?

    Research · 54 comments

    Apple set a new record for Mac sales in the fourth quarter. This was not a surprise. The growth was perhaps a bit lower than some expected (including me) but it was still a healthy 23% and 8x the PC growth rate. The Mac has outgrown the PC (and hence has gained share) for 19 quarters straight, nearly five years.

    What's more interesting is where the growth came from. Every region outgrew the market. Asia-Pacific led with a 67% year-over-year increase, almost 10x the market. Japan grew at 56%, which is about 6x the market, and Europe and the United States both grew in double-digits despite both markets contracting overall.

    Looking over a longer time frame, the Mac has nearly quadrupled in volume in five years. In the last quarter of 2005, Apple sold 1.2 million units. In the latest quarter it sold 4.1 million. So the performance has been relatively good.
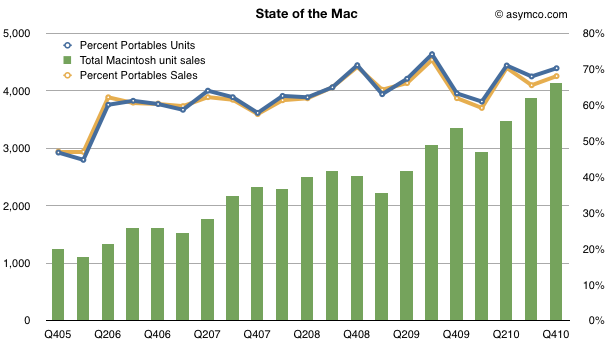
    One significant reason for the growth has been the shift from desktop to portables. The lines show how the percent of portables went from about 50% to 70% of units and sales in four years.

    [hang1column]
    [/hang1column]

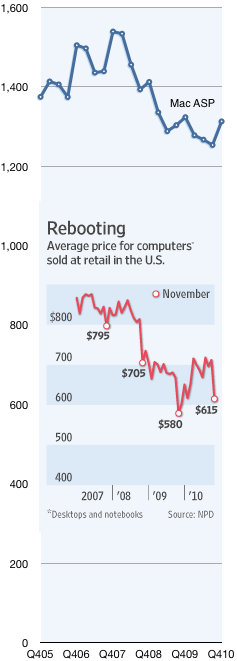
    But what was surprising was that the average selling price increased to $1,313, up from $1,253 and nearly even with last year's $1,324.

    Prices in the PC industry tend to fall. Actually, to be more precise, they tend to collapse. Compare the Mac's price trend with the rest of the industry as seen in the chart to the left[1]. It shows the Mac Average Selling Price which is what Apple books from selling into the channel vs. the retail price of PCs in the US.

    The chart tells a partial story. The PC figures are retail while the Mac figures are wholesale. Furthermore, the PC figures include Mac, so stripping out the Mac would show the PC prices to be even lower. Lastly the Mac figures are global whereas the PC figures are US only.

    But what I want to focus on is not the absolute difference, rather the relative value difference, which is diverging: The average PC went from $795 retail at the end of 2007 to $615 in November 2010. That's a drop of 22%. In the same time frame the Mac went from $1,539 to $1,313 wholesale, a drop of 15%.

    In other words, the Mac price premium at the end of 2007 was at least 93% and it now is at least 114%.

    So here's the real surprise: How does the Mac gain share while increasing its price premium over the PC?

    The only answer I can offer is what I already wrote on the Mac in November:

    ...something changed with PCs when the laptop became “good enough”. With portable computing, the job the PC was hired to do evolved. It was more important that the product be well designed (for aesthetic value, usability and reliability) than just fast and spacious. The microprocessors were plenty fast but what mattered more was low power consumption, a low profile and tighter integration with software.

    In other words, computers became re-integrated. You only need to touch the MacBook Air to understand why.

    ----

    Notes:

    1. The inset chart comes from The Wall Street Journal using data from NPD. The Mac data comes from Apple financial reports.
  2. Estimates for Apple’s second quarter earnings (ending March)

    Research · 39 comments

    Apple's CFO guidance statement:

    We expect revenue to be about $22 billion, compared to $13.5 billion in the March quarter last year. We expect gross margins to be about 38.5%, reflecting approximately $50 million related to stock-based compensation expense. We expect OpEx to be about $2.35 billion, including about $250 million related to stock-based compensation. We expect OI&E to be about $50 million, and we expect the tax rate to be about 25.5%. We are targeting EPS of about $4.90.

    via Apple Management Discusses F1Q11 Results - Earnings Call Transcript - Seeking Alpha.

    This is a particularly aggressive revenue growth forecast of 63% (note again that Apple's P/E has dropped to 18 and 14 ex cash and 10 on a forward basis) . Since Apple always guides very conservatively, the likely figures for the top and bottom lines are likely to be higher.

    How much higher? Here are my estimates (growth in parentheses is year over year).

    • iPhone units: 18.4 million (110%)
    • Macs: 3.62 million (23%)
    • iPads: 6 million
    • iPods: 10.1 million (-7%)
    • Music (incl. app) rev. growth: 25%
    • Peripherals rev. growth: 23%
    • Software rev. growth: 23%
    • Total sales: $24.5 billion (82%)
    • GM: 38.8%
    • EPS: $5.89 (77%)

    Looking a bit further ahead, earnings suggest the company is now trading at a forward P/E of about 9.5.

  3. The end of exclusivity doesn't change the price operators pay for the iPhone

    Research · 55 comments

    AT&T does not pay a higher price for iPhone exclusivity | asymco.

    At the risk of repetition, there are three instances in conference calls that Apple management has stated that the iPhone has a fixed price for all operators and resellers.

    The first was in October 20, 2009:

    “So when you go from exclusive to multiple, you don’t change the charge to the carrier?”

    Cook answered: “Correct.”

    The second was a year later, October 18, 2010:

    Chris Whitmore – Deutsche Bank:  And what is your experience then when you’ve gone non-exclusive from a subsidy and margin standpoint on the phone, have you had to give anything up in the past?

    Tim Cook: We don’t give specific information out on the margins. But I think you can look at our ASPs and see that they’ve generally stayed above $600, and that’s despite opening up several markets from an exclusive market to a non-exclusive market.

    And the third was a few days ago on January 8, 2011:

    Toni Sacconaghi - Bernstein Research:  You've said on previous earnings calls that the move to iPhone non-exclusivity in regions of the world has had no impact on your ASPs. Can you comment on whether that is it still the case today and whether we should expect any impact in the migration away from U.S. exclusivity?

    Timothy Cook: I don't envision the overall iPhone ASP decreasing from the December quarter that we just completed to the March quarter that we're currently in.

    But, as always, we can confirm and validate using the data on pricing we have available.

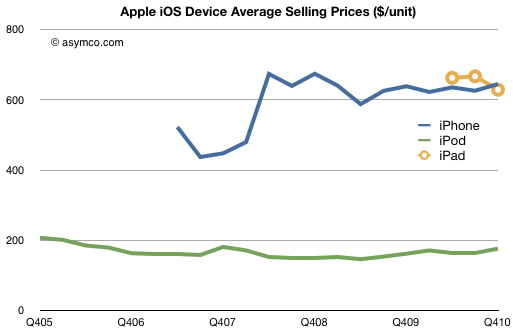
    In this case in the financial reports (take iPhone revenue and divide by units sold):

    You can see that after the first iPhone "2G" which had a peculiar pricing that included revenue sharing with the operator and which showed up differently in the accounting, the iPhone has had a steady price slightly above $600 for over two years[1].

    This is despite having more than 60% sales outside the US and being non-exclusive multi-operator in many countries. Despite being available locked, unlocked and everything in-between.

    We can even confirm what one particular operator paid exactly. In October 2008 AT&T reported that they had paid $900 million for 2.4 million iPhones. That's $375 per phone. Assuming a mix of $199 and $299 3G phones that gives something around $600--below the global ASP for that quarter of about $676. Here exclusivity would imply a discount to average price! The reason for the discount is most likely volume as AT&T was by far the largest buyer of iPhones globally.

    Still unconvinced? Try shopping for an unlocked iPhone at any of various retail locations where it's available unlocked. Accounting for VAT or other taxation, the price is always the same and is a slight mark-up to the operator ASP due to retail margins.

    Judging from comments on this site, the myth that loss of exclusivity in the US will change profit margins for Apple still persists no matter how many times I repeat this story.

    -----

    Notes:

    1. The steadiness of the price should give another huge clue as to the effect of competition on the product.
  4. 65% of Apple's sales came from iOS powered devices

    Research · 46 comments

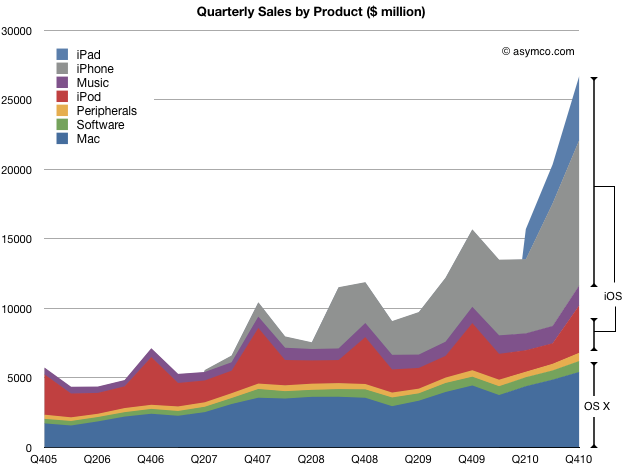
    The iPhone and iPad generated $15 billion of revenue last quarter. In addition, iPod touch generated about $2.3 billion, implying that iOS based devices were responsible for sales of $17.3 billion.

    To put that in perspective I drew this chart which shows not only the sales by products but a rough representation of share of the two OS variants Apple uses to power its products.

    iOS powered products (which did not exist three and a half years ago) generated 65% of all sales in the last quarter. OS X powered products generated 20% of sales. That's a noteworthy combined total of 85%.

    But software is even more important for Apple.

    The sale of OSX software (both the operating system and applications for it) accounted for another $786 million or 3% of total. In addition, I've put forward some evidence to suggest that the proportion of sales due to Apps in the Music store is nearly half, or another $600 million (a bit more than 2%).

    Therefore only 10% of Apple's sales were for products not directly powered by its vengeful operating system. That speaks volumes not only for the importance of software to Apple but for the cohesion of an extensible, flexible architecture that allows it to inhabit a portfolio spanning from a music player and an enterprise server.

    I recently answered a question on Quora on whether Apple is a Software, Hardware or Media company by saying it's all three.

    With 90% of sales dependent on a unique, proprietary operating system[1], perhaps the answer should have been different.

    ---

    1. I know that OS X has a large amount of open source. Proprietary, like Open is a partial definition.
  5. Apple's Growth Scorecard: 63% average earnings growth over 16 quarters

    Research · 30 comments

    In the last quarter Apple's top line grew by 70% and the bottom line by 75%.

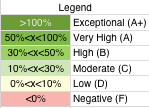
    For a historical perspective, the following table shows year-on-year growth for products[1] and sales/earnings color coded with an arbitrary scoring range.

    The major changes from the last quarter were the acceleration in software sales and the return to growth in iPod sales. iPod benefited from the continuing shift to iOS as the mix is now 50% touch in the portfolio.

    Software growth reached a level not seen since 2008. It's not clear to me yet  which products drove this increase.

    Overall the growth is both wide and deep. I'm most impressed with the iPod as it was a surprise to hear such a high mix of touch.

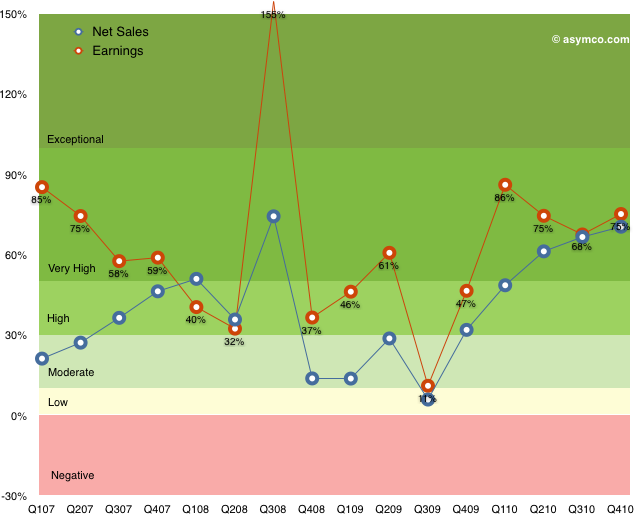
    The following chart shows the top and bottom lines plotted over time with color bands corresponding to the score system in the table above.

    Note how earnings growth has been in the high or very high or exceptional range for all but one quarter over in the last four years[2].

    Apple transcends the mythical "rule of large numbers"[3]. It's not only a mega-cap, but the second largest company in the world by market cap. Not only has this enormously valuable asset just grown in intrinsic value creation by 75% but it has maintained a growth of 70% for the last five quarters.

    If that weren't enough, the average earnings growth has been 63% for the last sixteen quarters.

    ------------

    Notes:

    1. The iPad is not included since we don't have more than one year of sales and this is year-on-year not sequential growth.
    2. The low growth for Q3 '09 was due to the corresponding spike the year before when the iPhone 3G was launched. That launch quarter in 2008 was a seminal turning point in the history of the phone industry when it became clear that the iPhone was not a passing fad. Steve Jobs famously participated in the conference call calling attention to the data which was obfuscated by subscription accounting. Alas, the news was lost in a sea of credit crunch panic.
    3. I have an aversion to this rule as "large" is never defined except in relative terms. For example a $1 trillion market cap may be large because it's unprecedented, but it may be a trifle if the company is priced at book value.
  6. How long before apps overtake physical video game content sales?

    Research · 28 comments

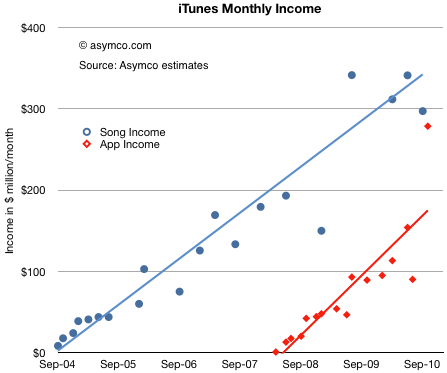
    After reviewing the payments to suppliers, we can look at the store's revenue generation rate. With the same assumptions, we have the following chart:

    We will have to wait for another report to see whether the recent burst of volume from apps is sustained[1], but the trend shows income from apps narrowing the gap to music. In the last few months apps may have been generating $300 million/month[2].

    The blue line above can be interpreted as an arrow aimed at the music industry. We know how that turned out. The red line above can also be interpreted as an arrow aimed at the gaming industry. What are the chances it will play out the same way?

    According to NPD, U.S. retail sales of new physical video game content, which includes portable, console and PC game software, generated revenues of $10.1 billion in 2010. That's $840 million per month. A big number compared to the app business. The trouble is that the figure is going down (-5% from the year before).

    If you look at the red line above and its slope, it would indicate that, given time, the App store will overtake the entire physical media gaming industry. The time when that happens will depend a lot on the growth or decline of the physical game media business, but another four years seems a safe bet.

    Would this cause the same effect to the industry as digital music had when it replaced physical media? I would say yes. The main reason is that physical media has associated with it a different sales cycle and margin. These factors determine the processes and cost structures of incumbents. Such changes are very difficult to absorb and adapt to.

    ----

    Notes:

    1. App sales are highly seasonal as there is a burst of downloads post-holidays.
    2. Apple reports iTunes income in financial reports. In the third quarter it reported $1.2 billion in revenues. This is roughly consistent with the data above given that the analysis excludes iBooks, Movie and TV Show sales and rentals.
  7. Is Android more efficient than iOS at generating search revenue?

    Research · 63 comments

    Thanks to David Chu for forwarding the data that made this possible and reader Narajanan for spotting the divergence in platform efficiency.

    iOS and Android are both growing rapidly. According to Gartner, during the first three quarters of 2010, about 44 million iOS devices and 36 million Android devices were put into use. That's 80 million devices. An amazing achievement for two platforms that did not exist 3 years earlier.

    But obviously not all devices are used the same way. Devices which have unused capabilities limit network effects for a platform and for the category of product in general. Question is: how can we measure the "smartness" of a device; how much more likely is a device to be used as a mobile computer vs. being a regular phone?

    The best proxy I can think of is a measurement of browsing use. The smarter the device, the more browsing is a joy and the more it is actually done. Browsing leads to more data load on the network and creates a virtuous circle of revenues for the mobile computing value chain.

    If we could measure the increase in browsing generated by each additional phone, we could compare whether one platform is better (specifically, more efficient) at generating value asymmetric to voice.

    Fortunately we have data from Netmarketshare.com (see sources below) which attempts to track browser consumption and hence allows us to measure this variable. What we need to pair that with is the incremental increase in the installed base of devices.

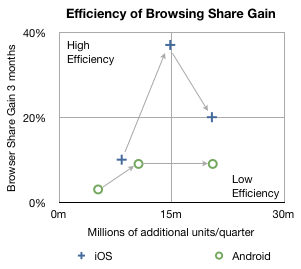
    In the chart below I plotted how much browsing share increased for every phone sold by platform over the first three quarters of 2010.

    The arrows indicate the sequence in time from Q1 to Q3. The vertical axis shows gain in share three months after the corresponding number of units shipped in the previous quarter on the horizontal axis. So, for example, the second circle means that in the second quarter approximately 10 million new Android devices created a gain of about 9% in browsing share. In the same quarter, 14.8 million iOS devices created about 37% gain in browsing share.

    In the third quarter approximately the same number of iOS and Android devices shipped (iOS  including iPads and iPod touch) but the browser gain was 20% for iOS vs. 9% for Android.

    A line drawn diagonally from lower left to upper right (0,0 to 30m,40%) could represent the average gain in share per units sold--the sort of measure we're looking for.

    Measuring that slope tells us that, on average, every million devices sold should generate a gain of 0.75% share[1]. I took the additional step of labeling two quadrants which are orthogonal to the expected trend. If browsing increases dramatically faster than 0.75%/million units then I call those devices sold as creating "highly efficient" browsing gain. If browsing increase lags dramatically below 0.75%/million units then those devices added share with "low efficiency".

    So four data points follow the trendline down the middle of the chart, however, there are two notable outliers. Finding the causes for these outliers gives clues to what's happening with the platforms.

    I believe the explanation for iOS's second quarter's extraordinary efficiency is that was the quarter when the iPad launched. It seems to have yielded a very strong spike and the trajectory of iOS improved even into the next quarter as those iPads continued to be in use. iPad seems to be a very effective way to gain browser share.

    I also believe that the cause for Android's fall in efficiency in the third quarter was that it began to be sold in large quantities in the developing world. The third quarter saw a rapid acceleration of sales without a proportional increase in what was measured as sales in the US (and Europe).

    Interpretation

    If this trend continues, and there is no guarantee that it will, then a question could be raised about Android's value to, of all people, Google.

    The core value of Android to Google is the increased use of browsing and hence search. All the other Google services and in-app ads are tiny opportunities in comparison to the potential of search on mobiles. One could argue that the raison d'être for Android since day one was to create browsing consumption. In that regard it's not as good at doing that as iOS is.

    Perhaps Google can justify the under-performance of consumption of browsing (and hence search) on Android devices as benign since there is no marginal cost added to supplying Android to non-consuming devices.

    But I wonder. There is the problem of opportunity cost: Those iOS devices that create more browsing activity are going to take more share. The more they do that the more Google will have to pay Apple for placement as the default search in mobile Safari.

    It may be a stretch, and perhaps the data is wrong, but that's what this exercise is all about: how much can we learn from fragmentary data? Without a hypothesis there is no discovery.

    -----

    Notes:

    1. Since these platforms have very low shares (less than 2% for iOS and 0.3% for Android by November) almost all the gains can be assumed to be against other browsers (e.g. Internet Explorer) and not against each other.
    2. Update: the original Unit estimates excluded iPad and iPod touch which have since been added.

    Sources:

  8. Big in Denmark: iPhone captures 36% of phone market value

    Research · 35 comments

    Thanks for Rob Marsh for forwarding the following snapshot of data from Denmark:

    Salget af smartphones eksploderer i Danmark.

    According to GfK data in Denmark, during the first quarter of 2010 29% of phones sold were smartphones. In the second quarter, the share grew to 37%. In the third quarter, 51% of units and 71% of sales value was captured by smartphones.

    Looking at September alone, Apple's share of the smartphone market was 34%. In terms of value share, 51% of all the dollars that consumers spent for smartphones, was spent on the iPhone.

    In other words, in September in Denmark, iPhone captured 34%*51% = 17% of all units and 51%*71% = 36% of all mobile phone sales.

    Rob adds:

    iPhone 4 is now available on all (4) major networks in Denmark. iPhone 4 has not been advertised very heavily, whilst Android has received a lot of advertising. My experience travelling on public transport in Greater Copenhagen is that iPhone is everywhere, whilst Android and Blackberry is less prevalent.

    To get a sense of how that compares with the global average, in the third quarter Apple's unit share was only 4.1% while sales share comes to about 17%. Seems like there is plenty of room for growth.

    While Denmark is a small country (population: about 5.5 million) and it's not likely to reflect global patterns, it has been rated the happiest place on Earth.

  9. [Updated] Samsung's Android Problem

    Research · 53 comments

    [Samsung] said it has sold around 4 million Galaxy S smartphones in North America, 2.5 million in Europe, and around 2 million in South Korea in the past seven months.

    via Samsung Sells 10 Million Galaxy S Android Smartphones - Digital Lifestyle - Macworld UK.

    Samsung's US Android sales are very similarly allocated to Apple's iPhone sales: 40%. But at 20%, South Korea represents a very large portion of their sales (2 million phones sold in 7 months into a country of 48 million). This is understandable given Samsung's distribution power in its home country. However it also implies that Samsung's [high end] Android sales in Asia excluding South Korea are tiny. Only 1.5 million were allocated to outside Europe, US and South Korea--a market that includes the whole of Asia, Africa, Middle East and Latin America.

    If we believe that Android is activated at the rate of 300k units per day, then Samsung represents around 40k of that. (10 million over seven months, linear extrapolation.) So where are those remaining 260k units/day going? Gartner calculated that in Q3 Samsung was the leading Android brand (about one third of all units). The Samsung figures make these share numbers very obsolete because 40k/300k is only 13.3%.

    It's hard to pin down the market because the share shifts are dramatic and the market's growth is not linear. Nevertheless, intuition and guesswork leads to me believe that Android activations are to a large degree (perhaps two thirds) in Asia. This in turn implies that Samsung is not a major participant in that market.

    Since neither LG (who does not have a strong Android portfolio) nor Sony Ericsson or Motorola which have low volumes, (nor obviously Nokia, RIM or Apple) are supplying the Asian Android market, the question is who is? Only HTC remains a contender but it's not big enough to account for the difference and they too are focused on the established Western markets (except for a modest presence in China).

    We are left again with circumstantial evidence that "Other" lower tier vendors are carrying the Android torch in Asia. Pdadb.net shows 277 Android models available. Brands like ZTE, Huawei, Acer, Notion Ink, Linx, TMN, FirsOne, Ziss, Kogan, Highscreen, Saygus, Haier and Forsa are selling Android devices (though not all in Asia).

    Not that there's anything wrong with that

    If there is a worry it is perhaps that Samsung might find it hard to maintain the top spot in supplying Android once the unbranded vendors make it through the distribution obstacle course (as HTC did when it reached 80% of the Windows Mobile share.)

    If one is to argue that Android empowers the desperate incumbents, then one has to also agree that it also empowers the more nimble entrants--inevitably leading to even more desperation.

    [Updated: thanks to reader @UVStaska who noticed on glaring error in the analysis. I had failed to see the "S" in the original quote and been assuming the 10 million figure represented all Samsung Android sales. The Galaxy brand is the Android brand but the "S" model is only one product within the line-up. Samsung Android sales are likely much higher than the 1.5 million I assumed.

    Back to the drawing board with the question of Samsung's strength in Asia. One does still wonder how well they are doing relative to entrants.]

  10. [Updated] RIM's sales down 15% in the US, up 112% outside the US

    Research · 41 comments

    First, a round-up of the quarter's numbers:

    • 14.2 million devices shipped, sell-through: 12.3 million
    • expect to ship 14.5 to 15 million units in the next quarter
    • ASP of approximately $315
    • US, UK and Canada are 56% of sales
    • US represented 34% of the total revenue
    • Last year US represented 57% of revenue
    • BlackBerry Torch launched in over 75 new markets, Torch launched with the $99 pricing from AT&T
    • BlackBerry Curve 3G launched with 118 carriers in 48 countries
    • China Mobile introduced BIS for small-to-medium sized businesses. The service starts at $14 per month
    • App World applications grew 60%
    • More than 16,000 applications available
    • 2 million downloads daily
    • 1,000 vendors registered for PlayBook apps
    • Revenue: $5.5 billion
    • Net subscriber additions: 5.1 million
    • Top three customers: 12%, 9%, and 9% of revenue
    • The same quarter a year ago: 25%, 13% and 10% of revenue
    • Service revenue in Q3: $835 million
    • Software revenue: $78 million
    • Gross margin in the quarter was 43.6%
    • Cash: $2.5 billion

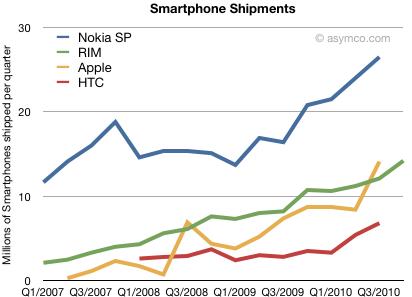
    For comparison, here are a select few vendors' smartphone reported shipments. RIM is the first to report and we'll be hearing the the rest by the end of January.

    The number most RIM "bears" focus on is the new subscriber additions. At 5.1 million out of 14.2 million units sold implying that the new subscribers added per unit sold is 0.34, a new low.

    The bulls will argue that the gross margin is healthy and slightly higher than anticipated.

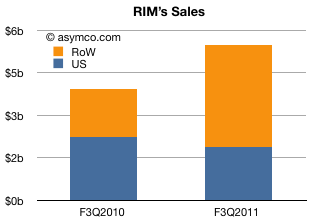
    My observation is that the company is finding growth outside its traditional markets. Given the figures above, the US went from $1.65b in revenue to $1.87b; a mere 13% growth while the company experienced 89% overall growth in revenues.

    The following chart illustrates the situation:

    Of the total increase in sales ($1.6 billion), the US contributed -15% while the rest of the world accounted for 112%.

    This can be seen as positive news since RIM has been weak internationally for many years and they really need to penetrate world markets. However, a -15% growth in the US is implies significant share loss in a rapidly growing and traditional stronghold.

  11. It's time for Apple to look at owning factories again

    Research · 95 comments

    Toshiba plant to make LCD panels for Apple: report | Reuters.

    Apple will invest in a portion of the investment for the factory, the Nikkei said.

    This is one of the more interesting news items I've seen for a while.

    [UPDATE] Toshiba denies rumor Apple will invest in mobile display subsidiary

    There was a time when Apple designed and owned factories. From an interview with John Sculley:

    That went all the way through to the systems when he built the Macintosh factory. It was supposed to be the first automated factory but what it really was a final assembly and test factory with a  pick-to-pack robotic automation. It is not as novel today as it was 25 years ago, but I can remember when the CEO of General Motors along with  Ross Perot came out just to look at the  Macintosh factory. All we were doing was final assembly and test but it was done so beautifully. It was as well thought through in design as a factory--a lights out factory requiring many people--as the products were.

    During the 90s the manufacturing function moved outside Apple's ownership umbrella. It was more economical, more flexible and more scaleable to outsource manufacturing to Asia. The time has come to rethink this.

    For the past few decades outsourced manufacturing has grown in scale and scope as prices fell and quality increased. However there are signs that this global web of suppliers and assemblers is reaching a point of disruptive change.

    Press attention has focused on labor practices, pay structures and the enormity of factory towns where literally millions of workers are employed and housed. As is often the case press attention only hints at some causality and as such misses the point. Journalists looking for a story about child labor or suicidal workers might serve us better by putting the spotlight on the fact that factory towns are not competitive.

    centralized Manufacturing is not good enough for the coming mobile computing disruption

    The real problem with Chinese factory towns is that they are not flexible enough. By concentrating facilities and workers, electronics manufacturers have improved on measures of scale and quality but are still only able to ramp up and down on individual products once or twice per year. This does not meet the need to increase responsiveness to markets and the pace of development and design. It also reaches some critical overweight mass. Capacity cannot double or triple again to meet the need of six billion consumers. There are signs that the business model must change.

    Typically a product is born in Product Marketing, progresses through Design, R&D and then to Manufacturing and finally to Sales. Each of these stages of development has to be re-started for each new product, often in a pipeline fashion. However, some of these stages are increasing their cycle times while others are at their limits. This limits the throughput of the whole chain. If, for example, R&D can put out two product designs in the space it takes for one Sales cycle then they need to be tasked with different product while they wait for "capacity" in Sales to catch up.

    My contention is that the bottleneck in device product development is now manufacturing. The evidence is that Apple (among many others) cannot meet demand. Sometimes it's a lack of components, but often there is a forecast error and capacity is simply not allocated. What I also see is that this bottleneck is not solvable with the current value chain architecture. When there are 5 billion consumers of platform devices, centralized factory town manufacturing does not match the cycle time of either design or of consumption.

    The answer to low capacity is more investment in more lines of production, more workers and more suppliers. However the problem is that this takes time. The window of opportunity for a product is less than six months.

    Consider the iPhone product cycle. A new variant goes into development 18 months to two years before it's launched. It's ready for manufacturing a few months before launch. The R&D team is off making the next version long before the product hits any shelves. The cycle time for R&D changes unpredictably. Sometimes it slips, sometimes it may be shorter because the changes are minor. Perhaps marketing sees the need to react to changing market conditions. However, manufacturing plods along at an inflexible rate.

    How can it be fixed?

    I'm not an expert in this area, but as a student of disruption I see signs of opportunity to re-engineer the manufacturing business model. The patterns from history are plain to see: Centralized systems get broken down and re-aligned with new bases of competition. Value chains disintegrate and re-integrate as profit algorithms change.

    The new algorithm says you need to ramp production quickly (up and down) and to increase "product turns" from one to two each year. Each ramp needs to be even bigger than they are now. Maybe by a factor of two. Products should be built closer to where they are consumed to drive costs and delays out of transportation and tariffs. Carbon footprints need to be reduced.

    Sounds daunting. But the rewards could be enormous. The business model may need re-definition. By owning the means of production, the value added can be shifted to another point (i.e. production can be run at a loss in exchange for higher margins elsewhere.)

    All this requires capital. Lots of it. Apple has it. I see no better use for it than to re-define production as a synchronized development module.

    It's time to look at owning factories again.