As previously described in an earlier piece on the transistor, there is a theory that underlies much of what this web diary is about. Telecommunications is undergoing wrenching change. And not for the first time. The history of the industry is filled with disruption and thus with drama that leads to fine storytelling.
One such great story is that of Western Union and the telegraph.
Western Union was formed as a company in 1851 and ten years later had completed the first transcontinental telegraph line. Following on that breakthrough, it introduced the first digital real-time data service, the stock ticker, in 1866. Business boomed and by 1870 it was the world's most powerful telecommunications company.
By any standards it was innovative: it offered remarkable and revolutionary telecom data services, a century before the Internet. But in the century that followed why didn't Western Union become the leader in voice communications, ceding that position to the Bell companies?
Alexader Graham Bell did not invent the voice telephone with the intention of toppling Western Union. In the language of today's technology entrepreneurship he hoped Western Union would be his "exit". He pitched the phone to them as an improvement to their core telegraphy business. Bell offered the patents for the telephone to Western Union for a mere $100,000, roughly $2 million in today's dollars. In other words, today the deal would be: two million dollars to own all voice IP.
Western Union passed
Now why would they do that? Imagine you are an analyst at Western Union advising management on technology acquisition and M&A. What process would you use to evaluate it? First, most obviously, you would try to get feedback from marketing and sales. They should go out and survey their customer base to find out who would be interested and how much they would be willing to pay.
The sales force would naturally seek out their best customers and ask them first. Those customers were the stock ticker users. They were extremely voracious users of the ticker tape system. It should be no surprise why we have "ticker tape parades"--there was enough of the stuff lying around offices in New York to shower down and flood Broadway end-to-end". Ticker tape was a boon to merchants and traders. Chicago would know what's happening in the New York stock exchange instantaneously. Price data was traveling at the speed of light. The sender and receiver were in lock-step sync. To suggest to these customers a voice product would sound like a step backward. Why would they want to talk to the other party? The data was coming on tape and it was also recorded for posterity. Speaking with the other person meant confusion and delay and a mess of record keeping.
The word from the customers would be a resounding negative.
Second would be the business model. How would you charge for voice? Data was subscription based, and the fees were huge. Voice would be metered and the price low. If targeting consumers, telegrams were priced by the word, but you couldn't price voice by the word. Marketing would stare back at you as if you had committed a judgement error.
Thirdly you would look at the cost side. Operations would give you more bad news. Voice technology was different enough that it needed new infrastructure. Switchboards, operators, handsets and new power and insulator requirements were all expensive and had no clear return. Voice was a loser all around.
So the decision was perfectly reasonable, smart even.
This is not to suggest that Western Union did not accept any new technology or invest in it. For decades after the phone, Western Union continued to invest in innovation: It introduced an electronic payment system (called money transfer) in 1871. In 1914 it offered the first charge card and in 1923 it introduced teletypewriters. Singing telegrams followed in 1933 and fax service in 1935. Intercity wireless microwave communications were introduced in 1943. Telex came in 1958 and the product of marketing genius, the 'Candygram' in the 1960s. By 1964 its network was all wireless using a transcontinental microwave system. Western Union became the first American telecommunications corporation to maintain its own fleet of geosynchronous communication satellites, starting in 1974. The fleet of satellites, called Westar, carried communications within the Western Union company for telegram and mailgram message data to Western Union bureaus nationwide.
And it wasn't lacking in talent either. Western Union had the best telecom managers in the business and was raking in profits to fund expansion. It attracted the best and brightest engineers for generations. Western Union probably passed on hundreds of other inventions and ideas, and rightly so.
So what happened to WU?
It's still around. However, due to declining profits and mounting debts, Western Union slowly began to divest itself of telecommunications-based assets starting in the early 1980s. Due to deregulation in the US, Western Union began sending money outside the country, re-inventing itself as "The fastest way to send money worldwide". In 1987, an individual investor acquired control of Western Union through an outside of chapter 11 process that was a complex leveraged recapitalization. After several other changes in ownerships and moves through bankruptcy, WU is now a public company with an enterprise value of about $12 billion based entirely on international money transfer business.
3G as a disruptive technology
Today we've come around full circle. Whereas voice was disruptive to a data network provider in the 20th century, data is disruptive to a voice network provider in the 21st. The mis-application of 3G network technology to sustain voice-oriented business models gives one a strong sense of déjà vu.
The telecom world moved swiftly to 1G and 2G cellular voice. Each new generation of mobile telecom was sustaining the core business model of subscriptions feeding centrally managed networks and symbiotic device vendors benefiting from handset and switching system upgrades. Standardization, international expansion, lower price points and network effects made this industry the most ubiquitous technology distributor the world had ever seen.
3G however was different. It was effectively mobile broadband data. It enabled data services to be de-coupled from the network operators. IP protocols did not require the servers to be located on operator premises or even to be managed or monitored by them. Devices could be general purpose computers not specific purpose communicators. Incumbents did not adapt to this well. They continued to build business plans according to a central-switch blueprint.
So although incumbents did not reject the smartphone as a technology, they tried to make it sustaining when plainly it isn't. They essentially tried to cram it into their business models.
The struggle to keep the service structure of telecom centered around the network operator will continue, but short of pulling the plug on 3G and LTE, there is little that the incumbents can do to stop it.
So what's the lesson?
Some technologies are embraced and some are rejected. You can't fault every rejection and you can't praise every acceptance. The most likely reason for embracing something is that it helps grow your existing business. The most likely reason for rejection is that it may harm your business. Even acceptance sometimes leads to mis-application in sustaining the core rather than planning for its demise.
The decision on how to handle something new and potentially disruptive requires a different sense of what's right and wrong about it.
--
Photo: Former headquarters of WU, located at 60 Hudson, New York.
In recent articles I highlighted the acceleration in iTunes App downloads where the rate is approaching 18 million apps per day and the cumulative total apps which is about to overtake the cumulative songs downloaded.
We now turn our attention now to constructing the iTunes income statement: namely total sales, gross margins and deduce its operating budget.
Gross Sales
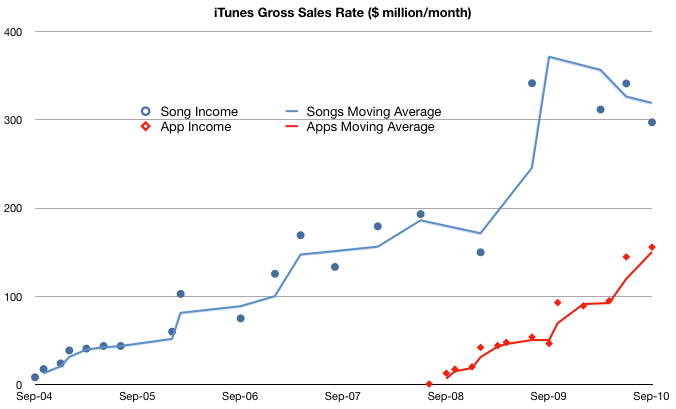
To obtain the top line (income) for iTunes we need to know the average selling price (ASP) for songs and for apps. Apps are easy, we received that info in June: $0.29 per app. For songs, it was easy before early last year: $0.99/song. After the selective price increase, the blended price needs to be estimated. I chose $1.10 for 2009 and $1.2 for 2010. These are just assumptions and can be adjusted but should give us a rough estimate:
I followed the convention of using income rate or $/month to show the history of sales. It shows that even with a price less than a third of the music product, apps are generating over half of the sales of music. In other words, apps are adding 50% to iTunes sales today. If the decline in music units continues and the app sales increase with the current trajectory then app sales value will overtake music sales next year, consistent with the cross-over of cumulative units sold.
Gross Margin
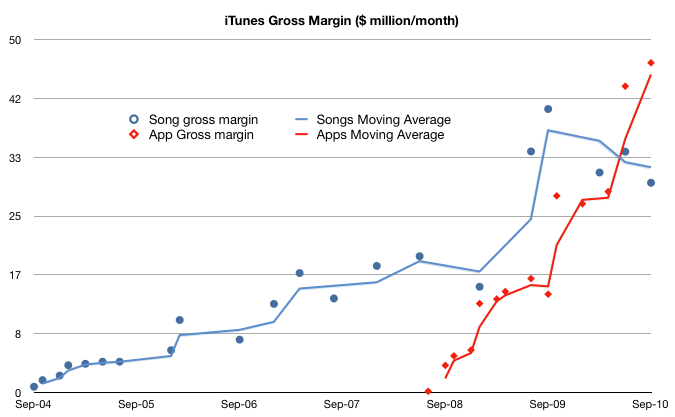
If we know how much Apple pays music licensors and developers (i.e. cost of goods sold) we can calculate how much it keeps for operations (gross margin). Apple's app margin is 30 percent. The music margin was never official but the consensus has been 10 percent for a while.
Using these figures, we get the following chart:
This shows that what is left after paying the content license, Apple "keeps" about $50 million every month to run the App store (iTAS) and another $30 million to run the Music store (iTMS).
The Operating Budget
Apple has made a point of saying that both iTAS and iTMS are run at "break even" implying that the gross margin is used up in operating costs (CAPEX, R&D, SG&A). To be sure, the cost of bandwidth and the data center(s) needed must be considerable.
But the operating budget for the store is beginning to reach a level that may be beyond what can be spent reasonably. The amount left over for operations has increased from ~$30 million a month in 2009 to $75 million/month today.
In fact, if this burn rate is maintained (even though it's increasing) the operating budget for iTunes is nearing $1 billion/yr.
I'm not an expert on the cost of operating data centers but $ 1billion a year seems like a lot. I would love to see an analysis of how this could be allocated.
Implications
I would also add that because of the increasing mix of apps, the overall gross margin percent is increasing. I estimate that to be a blended 17%--a healthy margin for a content store--and an increase from 10% before the app store came online.
Finally, one implication of the economics involved is that a budget like this may provide a significant barrier to entry for any competitors looking to take on the iTunes juggernaut. iTunes has reached content critical mass (12 million songs), user base (160 million users) and wide distribution (23 countries for songs and 80+ countries for apps).
These are non-trivial operational issues that even the best in the "cloud" business models will find challenging.
Footnote:
This discussion excludes video sales, rentals, book sales as we don't have solid histories for these product lines. However, we can do a spot check on the cumulative totals:
450 million TV episodes downloaded implies $1 billion in sales.
100 million movies downloaded probably adds at least another $1 billion
35 million books adds another 500 million.
Compare with 11.7 billion songs at ASP of $1 for about $12 billion in song sales and 6.5 billion apps at ASP of $0.29 or about $1.9 billion.
iTMS content downloads have generated $16.4 billion in sales to date.
IDC raised its 2010 smartphone sales growth forecast to 55 percent from 44 percent earlier. Citing booming smartphone demand it also lifted its forecast for overall cellphone market growth to 14.1 percent from 12.6 percent.
Keep in mind the 55% growth figure when reviewing analyst forecasts for iPhone growth. If their forecast is less than that then it implies market share loss. When I suggested 50% compounded annual growth rate (CAGR) for iPhone going forward 3 years, there was a lot of skepticism but this market is growing faster than most people expected.
I still believe that Apple can grow the iPhone at least as fast as the market.
Here are the quarterly y/y growth rates for iPhone units since sales began:
Thirty days after the launch of the iTunes App Store, Apple announced that 60 million apps were downloaded in the first month of operations generating sales of $30 million. "This thing's going to crest a half a billion, soon," Jobs said adding that it may be a "$1 billion marketplace at some point in time."
Mr. Jobs was being modest.
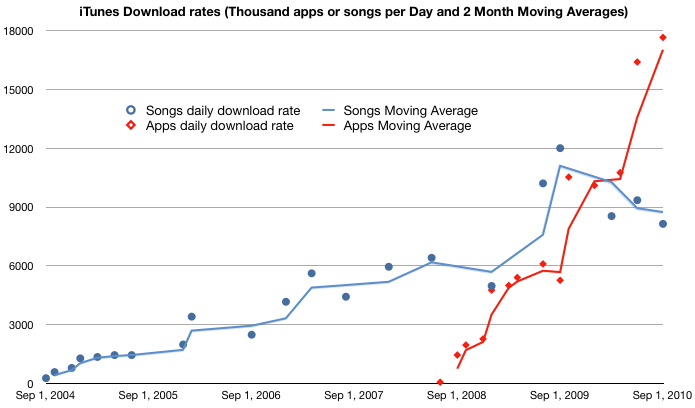
To see how modest we have the following data:
If the current download rate is maintained (17 million apps/day) and if the pricing of $0.29/app is preserved, then $1.8 billion will have been spent on iOS apps this year.
With the rate of downloads increasing as steeply as it is, $2 billion in sales is not unlikely in the third year of the store. Twice what Jobs was predicting for "some point in time".
The other line in the graph is the iTunes music download rate. I've written about it before and pointed out that the point of inflection in the download rate coincided with the increase in price for songs from $0.99 to $1.29. Not much more to say here except that the trend continues and music downloads continue to slow.
As far as Apple is concerned, the slowdown in iTMS is more than offset by the increase in iTAS. As far as the music industry is concerned, I don't think CD sales are increasing. Does anyone know?
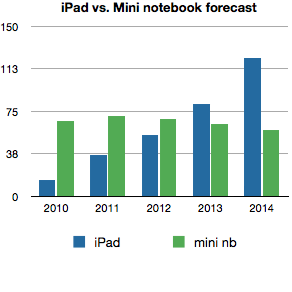
According to Gartner, mini notebooks constituted less than 18.0% of the total mobile PC market in the second quarter of 2010, down from 20.0% of the total market at 2009-end. Gartner expects mini notebooks market share to drop to approximately 10.0% by 2014.
However, worldwide PC shipments are projected to total 367.8 million units for the full year 2010,
Speculation about the iPad production ramp indicates that the iPad will ship about 14 million units this year and 36 million next year. Projecting a forward growth rate of 50% and adding the Gartner forecast above gives us the graph on the left.
The iPad (plus competitors) will likely overtake the sales of mini notebooks as soon as 2012. The collapse in netbook sales is likely to be much more rapid than Gartner suggests.
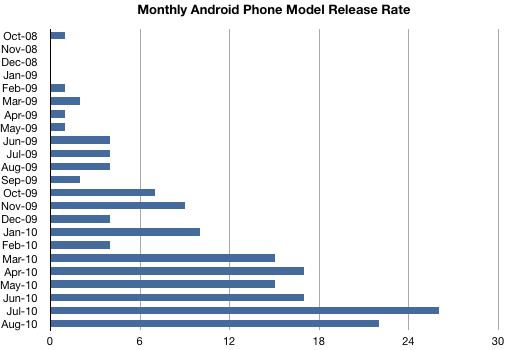
Next month will be the 24th since the first Android device launched in October 2008. The G1 was followed by another HTC device in February of 2010 and a few others in the spring. The summer of '09 showed a steady release of up to four new phones every month. Since then the number of Android phone stock keeping units (SKUs, uniquely identifiable stockable products) increased dramatically, with the release rate increasing to 26 per month during July of this year (source: pdadb.net).
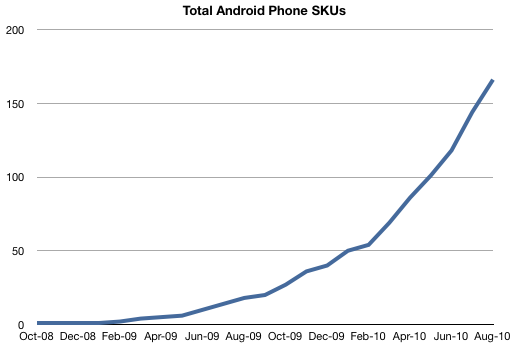
Altogether, there are have been 166 Android phone SKUs in the market with another probable 25 or so ready to launch in the next few months.
Now this may seem like a large number of different phone models in a short time, and it is, but Windows Mobile was even more proliferated as a licensed OS. At its peak over 50 new devices were released every month. The total now is over 1700 and it's still growing.
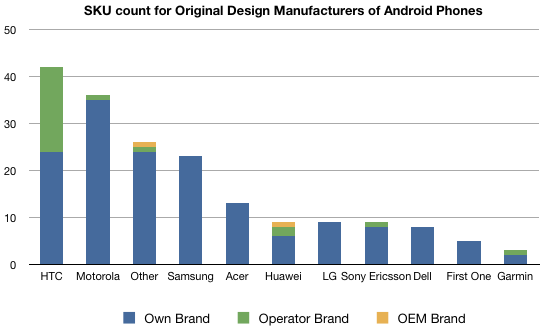
The 183 known Android devices are distributed among 10 principal vendors with another 18 minor vendors. The 18 "other" vendors (see footnote 1) have either one or two devices in the market.
The vendors or original design manufacturers list ranked by most devices follows:
I broke out the devices also by the number of operator branded devices designed by the same manufacturer (green) and any devices designed and built by one vendor but sold under a different vendor's brand (orange). It shows how, excluding "other", HTC is the most prolific Android builder (and seller) but also how it still depends a lot on Operator branding.
The proliferation of Android devices is indeed striking, but as I've pointed out before, the licensing model for Android is symmetric with that for Windows Mobile with the exception that Android is both open source and cost-free to license. This should make it highly disruptive to the paid-license model that Microsoft worked so hard to implement. It should be no surprise then that the adoption dynamics for the platform are very similar, with the same licensees that took Windows Mobile a few years ago embracing Android today.
The proliferation still has a while to go. There is production capacity for over 2000 SKUs among all the vendors in the market (especially the "other" category) and it's only been two years since a stable version of the OS has been available. So it would not be surprising if the total number of licensed Android products will overtake the 1700 or so Windows Mobile SKUs.
So what's the paradox?
The question that should jump out from this data is what's the value to the participants in this, or any mobile OS licensing model? When I analyzed the Windows Mobile field in 2007 or so, it was pretty evident that very few vendors other than HTC shipped enough volumes to make a product profitable. In fact, I coined the phrase Pocket PC Paradox to describe the situation where hundreds of vendors would line up to make undifferentiated products competing for a shrinking pie. This went on first with Pocket PC PDAs, then repeated with Windows Mobile and is now repeating with Android. Nobody ever made money except for HTC, not even Microsoft.
It's still a mystery to me why any manager would decide to make the (n+1)th Android/WinMo phone. It must be difficult to make market projections that justify the cost of developing and marketing this new product.
But here's some help: The total number of Android phones sold through the end of last quarter was about 23 million units. The total number of SKUs launched to date then was about 118. That means that the average Android phone SKU sold 200k units (2).
Now this may seem comically low, but I will again bring up history and point out that while the WinMo bubble was in its zenith, the average Windows Mobile SKU had 50k units sold. With the SKU count increasing more rapidly than the sales rate (40% more SKUs since June) it's very likely that the average units per SKU is dropping. So by my reckoning there's plenty more in the Android bubble to go.
-----
(1) The "other" category includes the following vendors:
Lenovo
Gigabyte
Highscreen
Notion Ink
WayteQ
Forsa Posh
Inventec
Kyocera
Pantech
TechFaith
Saygus
Sharp
Ziss
Alcatel
General Mobile
(2) I'm fully aware that the distribution of sales over the products is not even and very likely exponential, but there is no way to predict whether a given new product will be a "hero" or DOA. The dream for every manager must be that his product will be a star, but the odds get worse and worse over time and the average units sold has to be considered as including these odds.
Gartner explicitly explained so in its press release: "Gartner's PC group does not track media tablet sales in this PC shipment data, so iPad sales are not included in these results
The reluctance of industry analysts to measure the iPad as a computer is a fascinating and vivid symptom of how analysts conspire with their customers to smother visibility of impending failure.
Before we dive into the motivation to ignore iPads, we need to understand how analysts in general and companies in particular group products into comparable piles. This process of grouping is called categorization. It should be distinguished from segmentation which groups buyers in a market. Categorization is essential for competitive analysis and measurement of the performance of a product (relative to other products).
Categorization is a challenging problem for most companies. To illustrate why, consider four possible methods for categorizing products:
By product attributes. The assumption here is that products with similar attributes compete in the same market. As an example hard disk drives might be categorized by dimensions of the cases and sub-categorized by capacity and perhaps transfer speeds.
By user attributes. This method is similar to segmentation where products are grouped by the type of buyer. Magazine titles might be properly categorized by the age and gender of the readers. This can also cover geographic data.
By user behavior. This method, sometimes called psychographics is a more advanced method than demographics where user personality, values, attitudes, interests or lifestyles are measured. You might have seen examples where users are defined with a "prototype" person and the products are attached to this prototype. This is a common way to categorize mobile phones (Nokia is a known leader in this method).
By modes of consumption. Determine what products are hired to do the same job. In this case you have to have real insight into what people actually do with their products and try to look broadly at what they substitute. The classic example of this is to understand that a power drill competes with products what make holes in walls not just with other drills.
When reading this list, it's easy to see that it's ranked in order of difficulty. The easiest thing to do is group according to things you can measure easily. Products are easier to measure than demographics which are easer to measure than psychographics and that's easier to capture than observed behavior.
Consider how you would structure a study to capture this data.
In the first case, you need an analyst to collect products (or just their descriptions) and record values in a spreadsheet.
In the second case, users need to be surveyed for basic data. This is hard because you have to find users and then you have to get a statistically significant unbiased sample.
In the psychographic study you need to ask a lot more questions about lifestyle in your survey and hope that the subject answers honestly. You still need a large sample.
In the case of consumption analysis you need to observe a subject use a product for a prolonged period of time in the usual context where the product is used and be able to interject questions when certain behavior is encountered. The observation of one person can take one research person-day per subject. To get statistically significant data requires literally man-years of work.
Now it should be clear why an analyst will only categorize according to product attributes. It's not only economically and temporally expensive to perform research on methods 2 to 4 but it also requires interpretation and insight into study development.
A few companies go beyond buying analyst market data and do their own research. As far as I know user studies are more commonly done by consumer products companies. But it's extremely rare to see this research done by low-margin technology companies. They don't have the budgets or skill sets to do any research.
However, in my experience, nobody performs the fourth, most difficult, form of categorization.
The result is that good, smart managers trained to always base their decisions on hard facts, pick up these lowest-deonominator analyst reports to help decide which products to develop. And it should be obvious why they are surprised when products that did not show up on any market study suddenly take all their profits away.
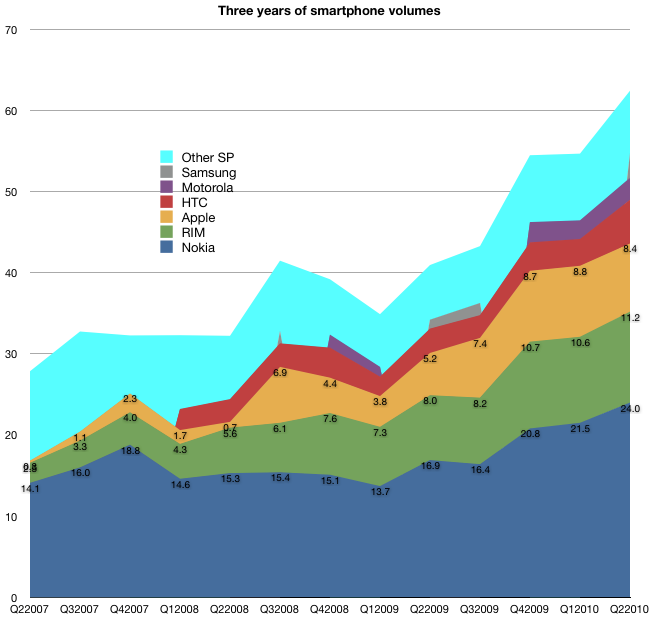
I did not include all vendors for various good reasons. The first survey (market share) did include an "others" category that made the volume data complete, but in the financial data sets, I chose to include the top 7 vendors that make up 80% of device volumes.
One noteworthy vendor that was not included was HTC. HTC is an important vendor for several reasons:
it's a pioneer in smartphones having made the first Windows Mobile devices and the first Android devices
at one point it sold 80% of all Windows Mobile devices
even if it did not brand its devices, it was the name behind many re-branded or white-label operator branded phones
it has a brand of its own today and is expanding its reach
HTC has been around building devices since 2001 and so it would be a pity to exclude them from any analysis of the effect of iPhone on the market or any discussion on the effect of smartphone disruption on feature phones.
The challenge with HTC was that historically their branded devices and white label devices were not reported by the company separately. This matters because white label devices are valued differently. Typically these devices are not marketed by the original manufacturer so SG&A is not applied to their cost base. Operating margins, ASPs and hence profitability is not directly comparable with other OEMs.
But HTC has recently changed its reporting. Thanks to a reader I discovered that, since 2008, HTC has been listing its ASP and Operating Margin making direct comparisons possible. I still don't have all the data, but enough to add HTC to the analysis.
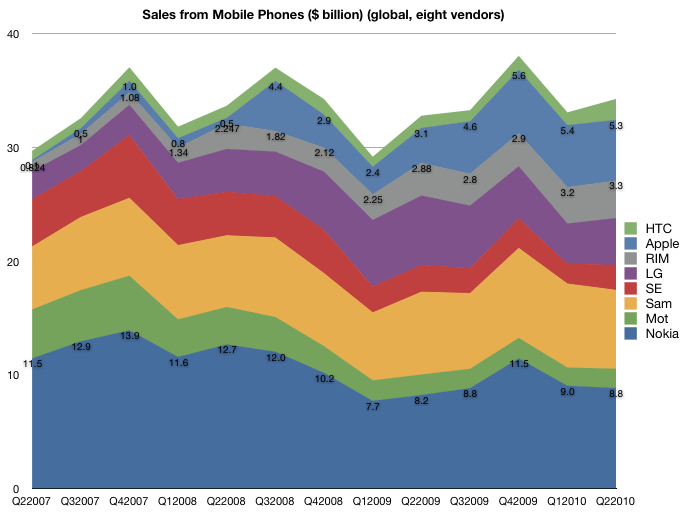
So, here are the 5 industry performance criteria, now with eight vendors listed.
Volumes
Note that HTC volumes start in 2008.
The volume of units HTC sold has been increasing at about the rate of market growth.
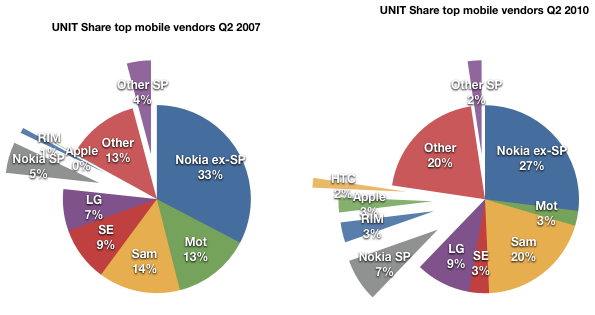
As a result, HTC's share has not increased as dramatically as those of the other smartphone entrants.
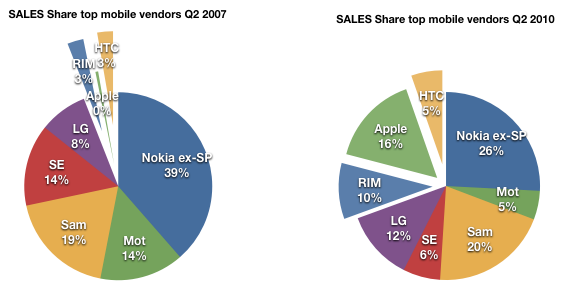
Sales
A similar story in the sales picture. Although a consistent performer, the growth has not matched that of RIM and Apple.
ASP
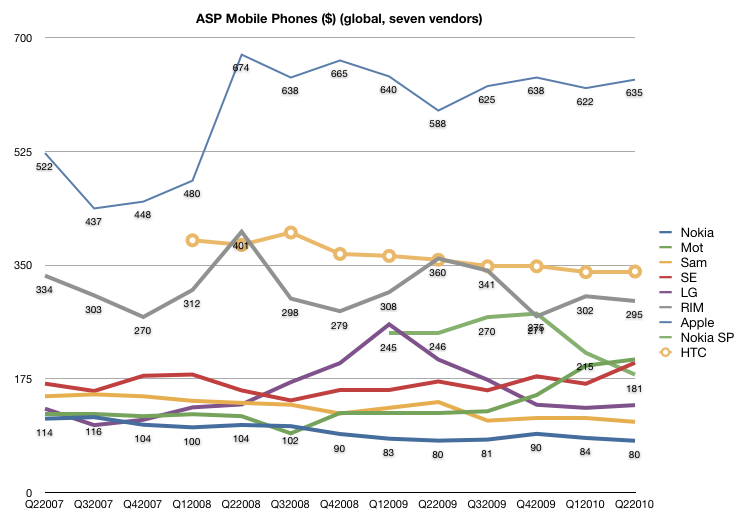
The pricing story is also a mixed one. Although HTC lies between RIM and Apple in price, the erosion is more consistent with RIM and the rest of the industry.
Margin
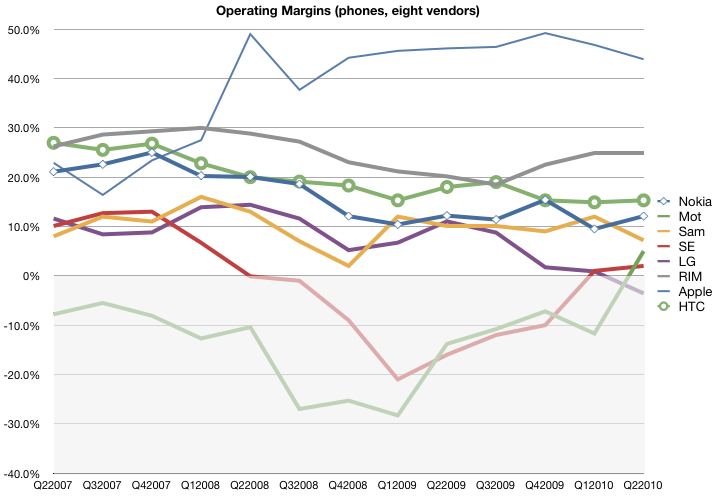
The margin story is also not as positive as one might expect. The margins for HTC started out above Apple and RIM but have dropped to closer to industry average. This is not what one might expect from an exclusive smartphone vendor.
Earnings
The share of earnings has remained unchanged at 5% over the period of iPhone presence. It's perhaps a credit to HTC that they did maintain their position in the market with the massive change that has come to pass.
However, here we also have to ask if HTC is riding a disruptive wave.
When I wrote the last series, my definition of “loser” was a company that had faced a long series of operating losses and has no viable software assets of its own, making it vulnerable to Android (and Windows Mobile). Motorola first, Sony Ericsson second and LG now coming into the picture. Nokia is not a loser in this sense since it has remained profitable and does maintain an investment in software. Same with RIM and Samsung (now with Bada). When/if they do have the near death experience, they might opt for the Android lifeline (flimsy as it is).
However HTC does not fit the mold of either "winner" or "loser". It's the Goldilocks company, not too hot, not too cold.
But I would add that HTC is not an example of a winner because of its adoption of Android. HTC’s dependence on Windows Mobile made their move to Android the most desperate of all. Unlike the larger OEMs, who had their low end devices to fall back on, they are completely dependent on a smartphone OS vendor. When WinMo was showing the first signs of crisis in 2007, they were the first to flee to Android (think of why they would risk the wrath of Microsoft for something so fragile as Android in 07). They are also trying hard to escape the dependence by building up their own UI (SenseUI) and I would not be surprised if they move to their own OS in the future. Being associated with Android does not confirm them as "winners" but in fact, shows their vulnerability.
What does this all say about Android?
Again here my thesis is that Google chose to sustain the industry rather than try to upend it. I don't judge their motives, but the fact is that with Android, Google is not in a position to disrupt telecom. There were high hopes dashed with the Nexus One and hearts broken with net neutrality and now there are patent wars to be fought. Android, with its licensees, is still at the mercy of operators.
The mobile phone market is intertwined with the telecommunications industry which is vast and there are numerous competitors which are much more dynamic and better capitalized than the moribund PC or music player vendors. It’s also a regulated and fragmented global market with 1.2 billion units and 5 billion consumers—far greater than any of the markets Apple played in for its first 30 years.
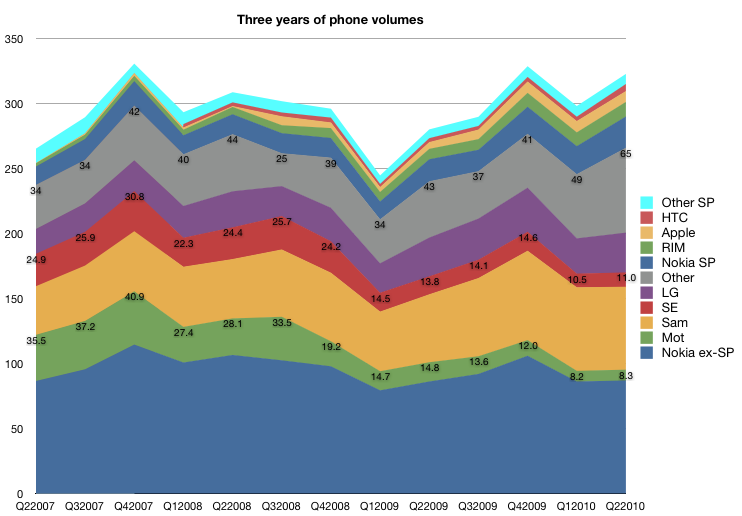
Nevertheless, the iPhone has had a huge impact on the industry. To show just how much of an impact, I dove in and pulled over 500 data points on three years’ financial performance of seven competitors responsible for 80 percent of units being shipped today. The time frame covers the iPhone’s participation in the market so it allows for “before-and-after” comparisons.
Now I turn my attention to draw a bottom line from all the data above, namely the operating earnings (EBIT or Earnings before Interest and Taxation).
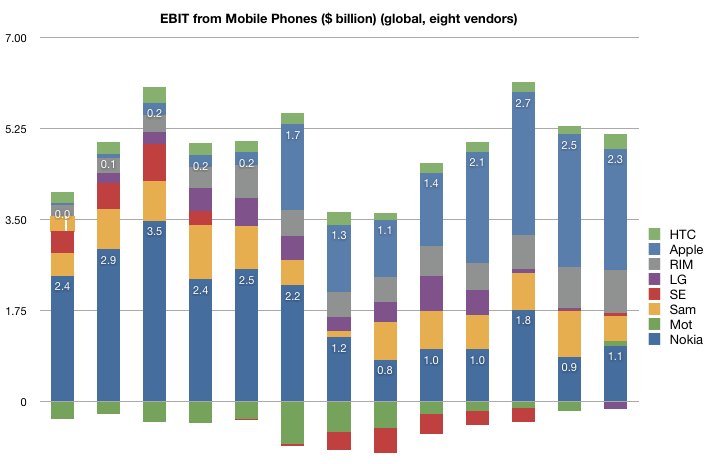
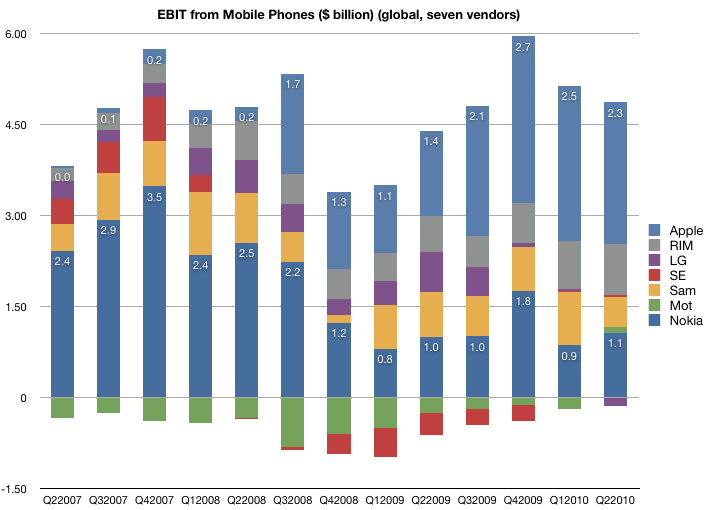
The first chart shows the EBIT from the top seven vendors of mobile phones since the quarter when the iPhone launched. I annotated Nokia and Apple's bars to give perspective.
The total available profits in the industry dipped to a bit under $4 billion at the trough of the recession, and have recovered to nearly $6 billion in the holiday quarter last year. However, not all vendors are profitable. As you might expect from looking at the operating margins, Motorola and Sony Ericsson have been generating losses for most of this time period. They have both reached profitability in the last quarter, though at very low levels and after having lost a large part of their sales. LG has turned negative this past quarter after being a modest earner for some time. Samsung has maintained a fairly even consistency in its profit capture, though with its expanding market share, it seems to have come at the cost of pricing.
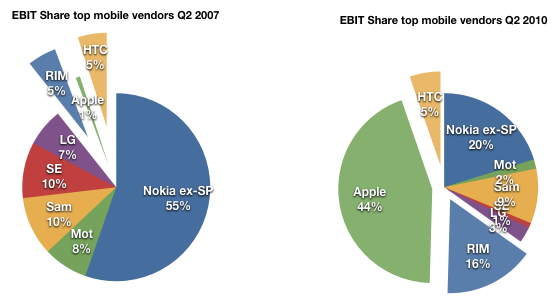
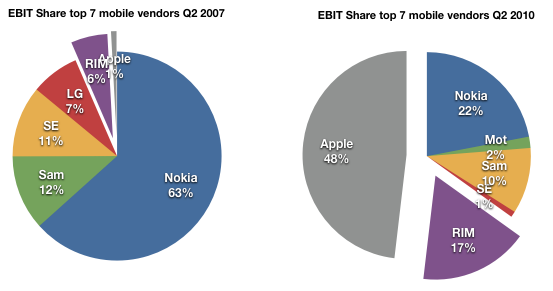
Finally, looking at the pure smartphone vendors RIM and Apple, the picture is nothing short of astonishing. This before-and-after share-of-available-profit chart shows that the two entrants went from about 7% profit share to 65% in three years.
Apple in particular is capturing about half of the available profits with three percent of the units. It dwarfs all the other vendors, more than double the nearest (Nokia). All that in three years and with the added burdens of only three models, a recession and limited distribution.
What does it all mean?
Here are my conclusions, enumerated:
The lack of a real response. The recurring theme in this series of articles has been that giant multinational incumbents in a vast and rapidly growing industry, enjoying all the advantages that size and incumbency, have had their profits taken from them. And they don't seem to have put up much of a fight.
It's all wealth transfer. Note the total amount of profit available has not increased markedly; this is not about incumbents growing the pie. Two thirds of what should have rightly been theirs moved from the incumbent shareholders to the entrant shareholders.
Speed. This shift of profit occurred over an unprecedentedly short period of time. Three years is no more than two product cycles in the industry and it's an order of magnitude faster than what happened historically to other industries.
Disruption is the diagnosis here. The incumbents were caught in the headlights. Disruptive innovation leads to asymmetric competition and this is what we just witnessed. History has shown that the shift of profits is usually the last stage of disruption and is usually irreversible because the change in business models cannot happen at the rate of change of profit transfer.
Which leads me to one final point.
When analyzing the potential for challengers to the new winners, the most cited is Android. Can Android affect this redistribution of profit once again? And to whom?
If Android is to become the dominant platform, does it depend on the success of its licensees? Who are these licensees and what are the chances that they will be able to align their businesses to what Android offers (a new revenue model based on services and advertising).
One problem I see is that Google is making a bet on those same vendors who are now squeezed in the middle of that last pie chart: Samsung, LG, Motorola and Sony Ericsson. Nokia, Apple and RIM will certainly not take the OS over what they already have as it dilutes their differentiation and margins. That means Android is aligned with the biggest losers in the industry.
So how likely are these disrupted ex-giants to recover and take Android forward? My bet: slim to none. Android does not offer more than a lifeline. It is not a foundation for long-term profitability as it presumes the profits accrue to the network and possibly to Google. Profit evaporation out of devices to Google may be a possibility at some time in the future, but only if the devices don't need too much attention to remain competitive. But because they're still not good enough (and they won't be for years to come), it's certain that attention to detail is what will be most important to stay abreast of Apple.[1]
So here we have the real challenge to Android: partnership with defeated incumbents whose ability to build profitable and differentiated products is hamstrung by the licensing model and whose incentives to move up the steep trajectory of necessary improvements are limited.
In other words, Android's licensees won't have the profits or the motivation to spend on R&D so as to make exceptionally competitive products at a time when being competitive is what matters most.
[1]: I would argue the same lack of symmetry with licensed software vendor Microsoft is what led the the failure of the same incumbents to make a dent in the industry with Windows Mobile [2003 to 2010].
The research and development budget used to be 9 percent of revenue, Mr. House told me; now it was closer to 2 percent. “In the personal computer group, it is seven-tenths of 1 percent,” he added. “That’s why H.P. had no response to the iPad.”
HP, by sales, the largest technology company in the world, can't be bothered to spend money on R&D for its PC division. This is a surprise? Since when does any PC company spend any money on R&D? Put another way, even if they did spend the money, what would they be researching and developing? PCs are commodity products where any improvements would neither be valued nor used. On the measures of performance that everyone has for the PC, the product has been more than good enough for a decade.
They did not have a response to the iPad because they did not think anybody needed an iPad. And that is mostly because Microsoft did not think anybody needed an iPad.
None of this has anything to do with Mr. Hurd. His peer group all agree on these fundamentals.