Asymco

Asymmetric Intelligence

revenue

  1. Phone incumbents' average operating margin: 4.5%. RIM and Apple: 34%

    Research · 10 comments

    After ASP, Sales, and Unit Volumes we look at the three year history of operating margins for the seven most significant mobile phone vendors (Nokia, Samsung, LG, Motorola, Sony Ericsson, RIM and Apple).

    The following chart shows the OM from mobile phone sales. These figures are as reported by the companies with the exception of Samsung and Apple. Samsung reports OM for its telecommunications unit as a whole and we have to assume that it's largely accurate for mobile phones. Apple does not report margins for its iPhone but it's possible to estimate gross margin percent for the iPhone and then subtract its overall OPEX as percent of sales. This assumes that OPEX is allocated to the iPhone in proportion to sales, which is the best assumption we can make at this time.
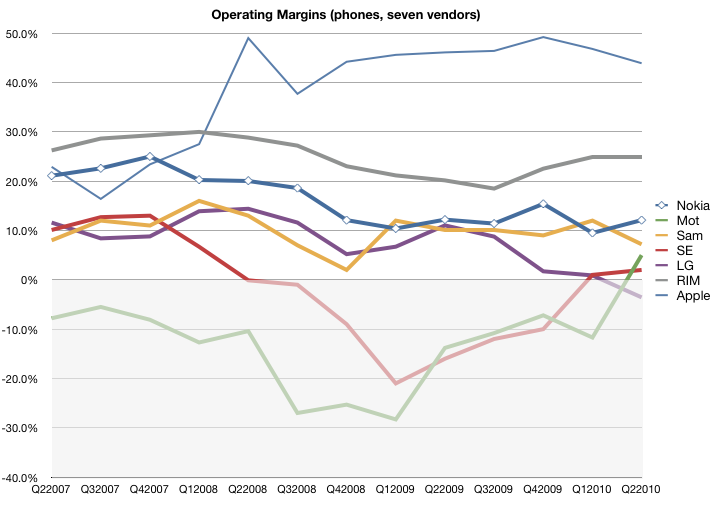
    The data shows that the iPhone has been considerably more profitable, due mostly to a high ASP, than other vendors. Motorola and Sony Ericsson have been "underwater" with respect to margin for much of the time period, with LG recently dipping into the red.

    Nokia's margin erosion is a source of significant angst but note that it has just reached Samsung's historic level (around 10%). LG, long seen as an up-and-coming vendor who took over the number three spot from Motorola is shown to have done so with moderate-to-low profit margins.

    Overall, the phone incumbents have an unweighted average operating margin of 4.5%, down from 8.6% three years ago. In contrast, RIM and Apple have an average OM of 34%, up from 24%.  In other words, profitability has halved for the volume leaders while it has increased nearly by half for the entrants.

    This goes a long way toward explaining the "smartphone gap" which is being filled by Android. As vendors see their unit growth, ASP and operating margins under pressure from low end disruptors, there is a tendency to flee to the high end that smartphones represent. Android offers an irresistible siren's song.
  2. Is an iPhone worth 8 Nokia phones or 2 Blackberries?

    Research · 4 comments

    Pricing is a leading indicator of value. Some might argue price and value are often out of whack but, in the long term the two converge.

    So it's instructive to measure how a vendor creates value by what it's able to charge for its goods. In the case of mobile phones, price is summarized by something called ASP (average selling price) which is measured each quarter across a vendor's entire portfolio.

    Again, there might be local fluctuations, but the trend is your friend here.

    Take a look at these charts I prepared based on the group of seven vendors I previously analyzed in terms of their sales and volume performance.

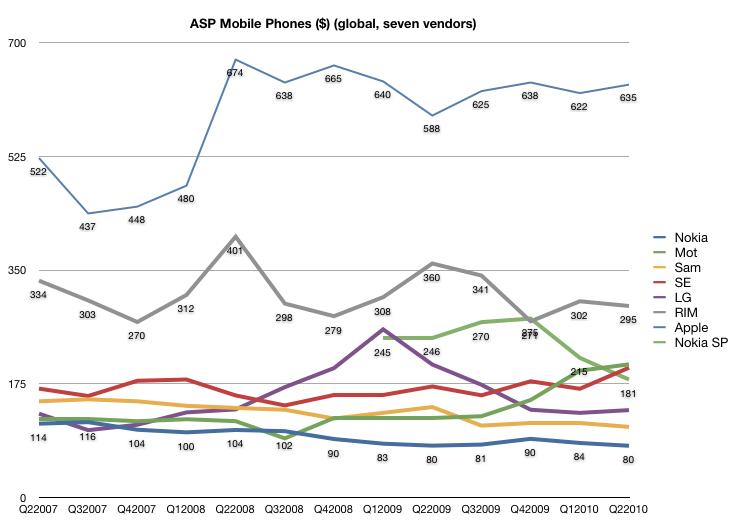
    First, a history of pricing since Q2 2007. All figures are in US dollars current as of time of reporting.

    Here we see the ASP erosion inherent in the large incumbents with Nokia and Samsung both seeing price slides. LG went through a phase of price growth but has returned to a point near to where it started three years ago.

    While Sony Ericsson and Motorola were following the downtrend until 2008, they reversed and began an ASP climb while fleeing upmarket (at the expense of volumes).

    Finally we have RIM and Apple both holding the line on pricing while growing volumes. Not only are the lines steady (with Apple slightly increasing and RIM slightly decreasing) but they are way above their competitors; Apple's shockingly so.

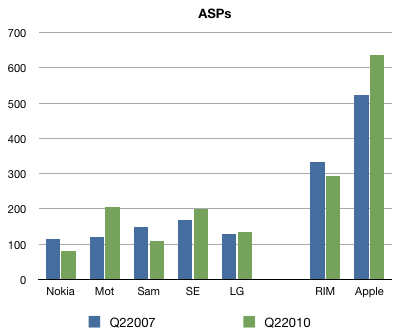
    Here is the before-and-after view:

    During the three year window we're looking at, Apple and RIM showed ASP durability while incumbents showed ASP erosion.

    Pile these data points on top of the volume and sales data and we can move forward.

    (In answer to the question in the headline, the answer is: Yes.)

  3. In phone sales, RIM plus Apple equals Nokia

    Research

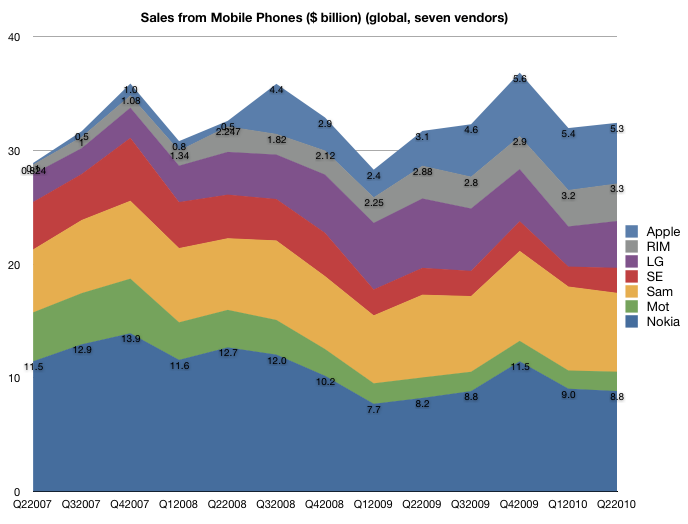
    Following up from the last article on the global phone units sold over the last three years (Visualizing the winners and losers of three years of smartphone share growth), we take a look at the sales in dollar terms over the same period.

    Remember that in the article on units, the pure-play smartphone entrants HTC, RIM and Apple grew from a combined unit share of 1.3% in Q2 2007 to a combined unit share of 7.7% in Q2 2010.  That's a 6 fold increase in volume share. Quite remarkable for companies lacking the vast resources and industry connections of the incumbents.

    However, when we look at their performance in value (dollar sales) vs. units sold, the performance of the entrants begins to look miraculous.

    The sales figures can be obtained from the company reports, though I caution that not all vendors publish data and data published is in local currencies. Fluctuations in exchange rates may lead to differences in reports of sales from different sources.  For the sake of consistency, I omit all "other" vendors and focus on the top seven: Nokia, Samsung, Motorola, LG, Sony Ericsson, RIM and Apple.

    First, the cohort's overall performance is shown in the following graph:

    I again annotated Nokia and RIM and Apple with actual sales (USD) figures for some perspective.

    The first thing to note here is that the whole industry sees a low rate of growth (unlike in the units picture). Total sales in Q2 2007 were $29 billion and total sales in Q2 2010 were about $32 billion. A mere 12% growth over three years and only 4% compounded over three years. Total units in Q2 2007 were 255 million and total units in Q2 2010 were 318 million, or 24% over three years and 6.2% compounded. This means industry-wide sales growth is half the units growth.

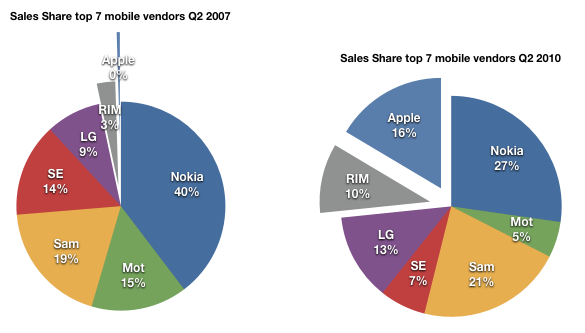
    The second thing to note is that the Apple+RIM group grew from 3.3% share of cohort to 26.6%.  That means that more than 1 in 4 dollars sent to these 7 companies was spent on Blackberries and iPhones!

    Jointly, Apple and RIM took $8.6 billion and Nokia took $8.8 billion.  Compare that with three years ago when Nokia took 40% of the income and RIM + Apple took 3%.

    So whereas the entrants increased units share by 6x in this time period, at least in this large subset of the market, they increased revenue share by 8x.

  4. Warner Music slows while iTunes grows

    Research · 3 comments

    Revenue from digital sales of recorded music grew just 3.7 percent to $169 million. That's a slower pace than the 4.5 percent growth posted a year ago and 39 percent growth two years earlier.

    via Warner Music CEO looks `beyond iTunes' amid losses - Yahoo! Finance.

    For the record, iTunes did grow at 35% in the quarter that Warner Music grew digital sales by 39% two years ago.

    But the two diverged a year ago with 17% iTunes vs. WMG's 4.5% and this past quarter iTunes grew at 27% vs. 3.7%.

    Gives us an idea of how much Apps have swelled iTunes' top line.

  5. The deterioration of Nokia's core business

    Research · 5 comments

    The saga of Nokia's challenges has been well documented in this weblog.

    For this quarter, we take a look at the sequential deterioration in Nokia's bottom line and draw causal inferences to its lack of competitiveness in mobile operating systems.

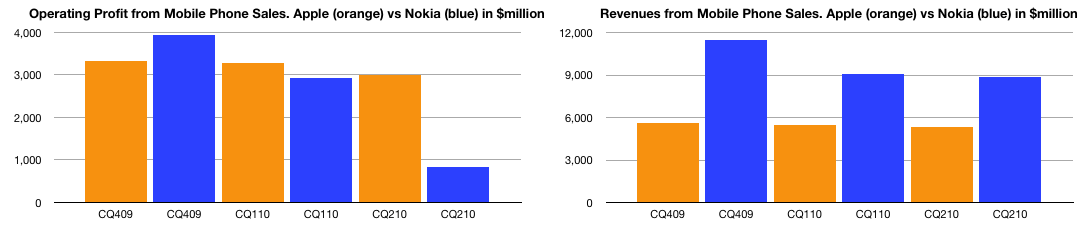
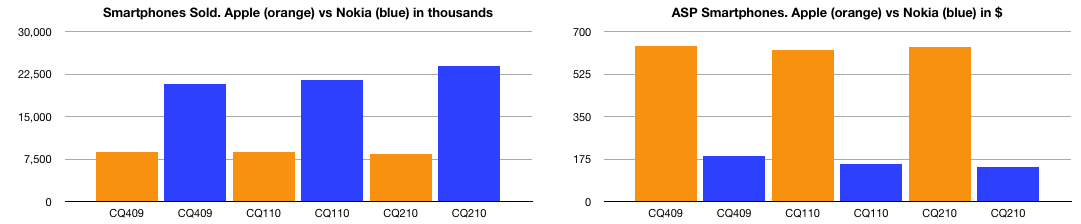
    First, the bottom and top lines are shown below (in blue) and compared with Apple (in orange):

    The charts show how Nokia's bottom line (left) collapsed while the top line (right) remained relatively solid. By comparison, Apple remained consistent in revenue with slight dip in profit as it transitioned to a new model.

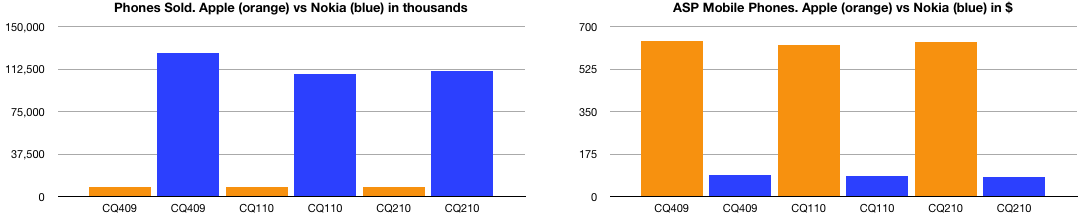
    The top line (sales) is the product of units sold and their average selling price (ASP). Here are these two quantities side-by-side:

    Note how Apple's units are hard to discern relative to Nokia's volume and how the opposite is true for the selling price. These values include all phones sold by the companies.

    The story is a bit more clear when comparing the smartphone part of Nokia's business, again with units and ASP:

    The story here is telling: even in smartphones, Apple's ASP is dramatically higher and much more resilient.

    The question has to be why: Why can Apple retain not only higher prices (and hence margins)? The answer is competitiveness. Margin is an indication of value created and value differential is competitive differentiation. All the user satisfaction surveys, the reviews and tests boil down to these hard numbers above. The deterioration of Nokia's business is directly traceable to its historic failure to embrace mobile software as a disruptive force and instead using it to sustain a hardware business.

  6. Apple sales by product line

    Research

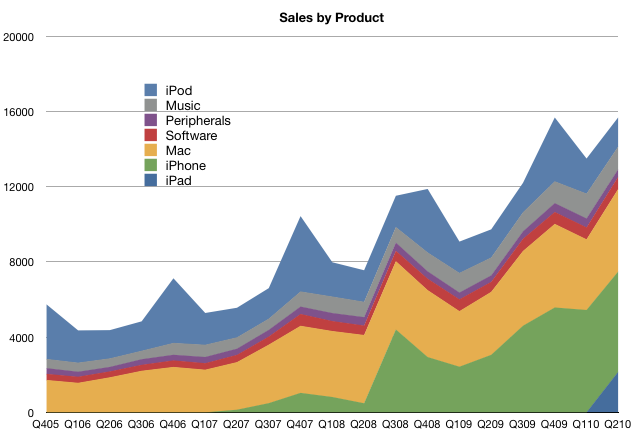
    The following chart shows the value of sales per quarter (in $million) since the beginning of 2005. What's interesting to note is that more than half of sales is contributed by products which did not exist three years ago (iPhone and iPad). Music and iPod did not exist 10 years ago.  It's entirely appropriate that Apple removed "Computer" from its name, though they still sell mostly computers of a different kind.

  7. Estimating Fourth Quarter Earnings for Apple

    Research · 4 comments

    We expect revenue to be about $18 billion compared to $12.2 billion in the September quarter last year. We expect gross margins to be about 35%...

    We are targeting EPS of about $3.44.

    via Apple Inc. AAPL Q3 2010 Earnings Call Transcript.

    That $18 billion figure is extraordinary.  Consider that last year during the same quarter, the company received $12.2 billion, then the sales growth forecast is about 50%.  Granted that even though Apple just achieved 61% sales growth last quarter, Apple management is unusually aggressive in underestimating.

    Given this, I am looking at the following forecast:

    • iPhone units: 12.2 million (65% growth)
    • Macs: 4 million (30% growth)
    • iPads: 3.3 million (flat sequentially, production constrained)
    • iPods: 9.4 million (-8% growth)
    • Music growth: 26.7%
    • Peripherals growth: 21%
    • Software growth: 8%
    • Total sales: $19.0 billion (56% y/y growth)
    • GM: 42.3%
    • EPS: $4.78 (73% y/y growth)

    If this estimate proves correct, then at the end of the quarter (Oct 1) the trailing twelve months' earnings per share will be $15.29.  That is equivalent to P/E of 16.82 on the back of four quarters of earnings growth (47%, 86%, 75% and 73% respectively).  The price/earnings excluding cash would be 13.4.

  8. 3Q review: The iPod revenues increase again

    Research

    The iPod touch increased sales 48% year-over-year.  The continuing mix shift toward iPod touch resulted in an overall iPod ASP increase of 12% to $164 (up from $143) generating total iPod revenue growth of 4%.

    Units declined 7.9%, inline with my expectations of -8%. I had forecast 9.40 and the actuals was 9.406 million. I note that most amateur analysts over-estimated iPods with my guess being the second lowest.  It's important to consider just how much the iPhone (and iPad) cannibalize the non-iOS iPods.

    I am estimating gross margin holding steady at 28%.

    Looking forward I am forecasting ASP of 170 and unit growth of -8%.

    I'll also mention here the Music business.  Revenues grew at an accelerating 26.7%. This growth is a significant rebound from the 15% to 22% growth of 2009 though lower than the 30%+ range of 2007 and 2008.

  9. 3Q review: Mac units grow 33%

    Research

    Apple Reports Third Quarter Results.

    I was surprised by the poor predictions of Mac units by the analyst community with estimates ranging from 2.86 million to 3.51.  It was fairly clear to me early in the quarter that the product would get 30%+ growth.  There was little news except overall Mac momentum to shape the forecast and it seemed logical that the growth would stay inline with the last quarter which was 32.8%. I dialed in 33% after the first month and stuck with this so my forecast came out to 3.46 million.

    In the event, 3.472 million were sold for a growth of 33.4%.  The ASP came in at $1,267, slightly down from $1,278 last quarter and $1,289 the year before. ASPs are eroding but Apple are holding the rate down with product updates. Looking forward, I'm forecast $1,300 ASP.

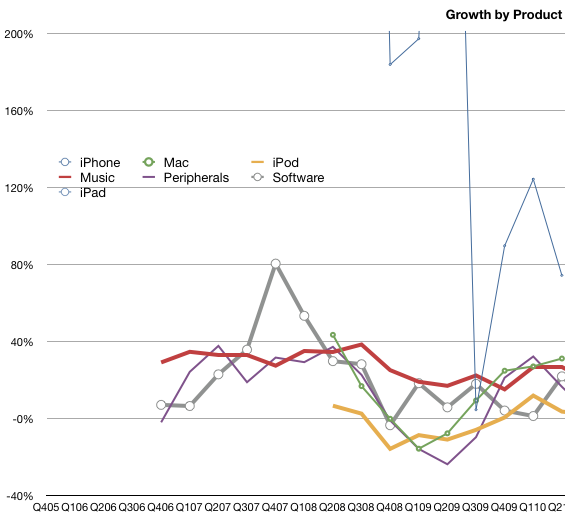
    I estimate gross margin for the Mac at 27%. This is down from 31% a year ago. Revenue growth year-on-year was 31%.  The Mac  franchise is still doing better than most PC vendors and is gaining share. The graph below shows the growth by product revenues.  The Mac is now the second fastest grower after the iPhone (the iPad is not included yet as these are y/y growth rates.)

  10. 3Q review: iPhone revenues grow 74%

    Research

    Calling the iPhone this quarter was going to be a challenge. This was a transition quarter where an old lead model would be replaced with a new one. The launch of the iPhone 4 was going to affect the volumes, but nobody could predict how. We've had a few such quarters and they were volatile. The number of sales days varied and the distribution of the old product was much different. The problem was compounded by the leak of the prototype and the uncertainties of launch day logistics. My forecast had been 8.5 million units.

    In the event, 8,398,000 iPhones were sold. This included 1.7 million iPhone 4s which means about 6.7 million 3GS phones sold. That's quite remarkable given the end-of-cycle timing.  8.7 million 3GS were sold in Q2 which means the sell-in was down only about 2 million for the transition.

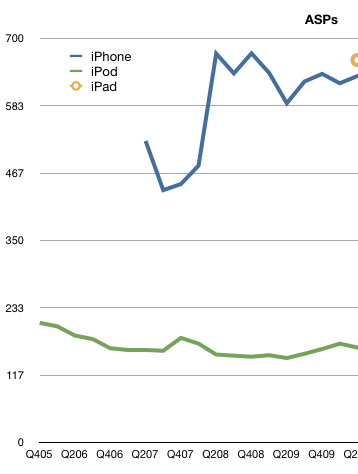
    The even more remarkable story is the average selling price. It came in at $635.15. The iPhone has ranged from $437 to $674 ASP over the last three years (see chart). This figure places it near the top of the range, a great performance for the end of a product cycle quarter.

    I estimate gross margin at 56%, a drop from the more typical 60% due to iPhone 4 launch. With revenues of $5.33 billion and cost of sales of $2.2 billion, Apple created operating profit of $3.13 billion--we'll take a look at that number relative to other vendors later.

    Growth year-on-year were 74% for revenues and 61% on units. For a transition quarter, these numbers are spectacular. For comparison, during 2009's transition quarter (Q4) revenues grew at 5% and units 7%. Furthermore, according to Apple's management, iPhone unit sales in the June quarter were running 90% above the year-ago period prior to the company draining thechannel ahead of the iPhone 4's release. In the December and March quarters, unit sales were 100% or more above prior-year results. This means that 100% growth is sustainable though going forward I'm keeping forecast at 65% growth.

    Seventy percent revenue growth cannot be seen as anything other than a sign of rude health.

  11. Double dip, with sprinkles on top

    Research · 5 comments

    Apple just had its best quarter ever with net income rising 78 percent to $3.51 per share. Revenue rose 61 percent, to $15.7 billion.

    On average, Wall Street analysts had expected Apple to report net income of $3.12 a share on revenue of $14.75 billion.

    If this is a double dip recession, then I'll take triple dip with sprinkles on top.