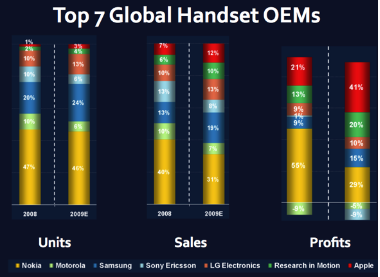
I calibrate my growth rates on the assumption that Apple will overtake the combined share of the two money-losing handset vendors.
Sony Ericsson and Motorola are the weakest competitors in terms of portfolio and competence with software. Their sales, units and profits shares for 2008/2009 are shown in the graph above (source: Morgan Stanley).
Therefore, my thesis is that Apple could beat these two weakest competitors in 3 more years.
Here is the basic top-down view:
In 2009 174 million smartphones were sold out of a total of 1.13 billion phones (IDC, Strategy Analytics). Using a 10% CAGR on this figure gives 1.65 billion phones in 2013
Apple obtained 2.1% share in 2009 and about 1.5% share in 2008. My forecast share for Apple:
2010: 3%
2011: 4.1%
2012: 5.5%
2013: 7.5%
During the last quarter, Sony Ericsson held 4.5% share and Motorola 3.7% therefore my 2013 target for Apple is a little less than the sum of what these two hold today.
This results in unit sales for Apple of 125 million units for 2013 and a compound annual growth rate of 50% a year.
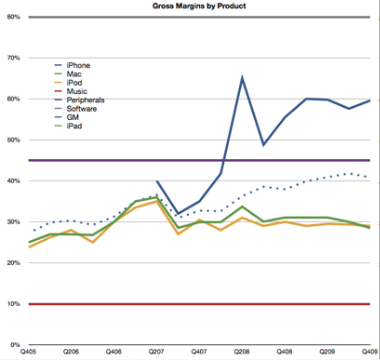
Apple’s latest re-statement of financial statements eliminated subscription accounting for the iPhone not just for the past quarter but for the entire history of the product, back to mid-2007. This allows a more precise estimate of the gross margin of the product and the results are eye-watering.
Apple does not reveal the margin for any product. They do provide an overall margin for the company (shown in the dotted line above).
The only challenge is to “back into” the GM for iPhone based on what we know of the margins for the other product lines and filling in the iPhone as the last piece of the puzzle.
To do so, we need to have some idea of what the other products’ margins are. Fortunately, this is not that hard.
We start with the easiest and work up:
The Software products business line ($2.4 billion last year) is easily the most profitable on a unit basis as software does not require much cost in manufacturing. A solid ballpark estimate is 80% GM (which is what Microsoft typically gets.)
Next, Music ($4.2 billion revenues). The estimate for music is fairly straight-forward. Apple and the industry have leaked the terms many years ago. Apple pays the labels most of the revenue of the music and keeps about 10% to operate the store. On the App Store there is a 30% margin off the selling price but that is offset by higher direct costs (shipping billions of free apps and free updates). I stick with 10% margin for the Music business line.
Third, Peripherals. The peripherals business is not particularly large for Apple, but they do a fair amount of peripherals with $1.5 billion last year. My estimate for peripherals margin is 45% based on some comparables.
Fourth, the iPod ($8.1 billion). The iPod has had a fairly well understood cost structure. The main variable is the cost of the memory, which, as a commodity, varies greatly quarter to quarter. Nevertheless, there is a strong consensus that iPod margins have kept around 29% to 30% over a few years. Teardown analysis coupled with spot pricing for memory chips gives a consistent average.
Fifth, the Mac ($14.7 billion). The Mac is a difficult product to estimate margins for due to the relatively wide variety of SKUs in the market, the complex components, various quality/warranty issues, transportation costs and the point in the life cycle of any given Mac. The best estimates however hover around the same as the iPod: 30%.
Once these values are available, and knowing the proportion of sales attributable to the iPhone vs. the other products, we can get an estimate of the gross margin.
Recent GM estimates are all shown in the graph attached. Here are a few observations:
The overall GM was tied very closely to the Mac/iPod prior to the iPhone.
Gross Margin has been increasing since the iPhone
The iPhone GM is consistently above 60% and is chiefly the reason for the increasing of the overall GM
The expanding margin for the whole of Apple is quite a story in itself (especially vis-a-vis the tragicomedy of the other PC vendors). However, what really stands out is how high the iPhone margin is.
Knowing why it stays so high in the face of an assault of “iKiller” devices is a clue to how Apple creates value.
Google sold about 80,000 Nexus One smart phones in their first month on the market, according research firm Flurry,Dow Jones Newswires reports.
By contrast, Apple sold about 600,000 iPhones when it launched the device in 2007, the story notes; the Motorola Droid sold 525,000 in the first month, according to Flurry.
Flurry estimates sales by measuring mobile applications usage and then extrapolating overall ownership.
Andy Rubin, head of Android said they hoped to sell 150k units, so this would be a very good start for the brand.
I would also like to estimate the revenue that Google probably earned from this phone so far. Assuming HTC receives a gross margin of 35% and the bill of materials is $174, then Google would have a gross income from the device of about $270/unit (based on $529 price).
Google could still have to pay for shipping, returns, warranties, etc. so their income might be closer to $220.
The income before operating expenses would therefore be $17.5 million in the first month.
I should point out that this would be the first income Android has ever received as the software is available free of charge.
Sony Ericsson shipped 14.6 million phones at an average selling price of EUR120 in the fourth quarter, down from 24.2 million units at an average selling price of EUR121 a year before. Net sales fell to EUR1.75 billion from EUR2.91 billion, in line with market expectations.
We will see next week, but by my reckoning, Apple sold more iPhones and iPod Touch units last quarter than Sony Ericsson sold of all its phones.
The ASP is also likely to higher at maybe 400 EUR blended average, for a total sales of 6 Billion EUR vs. 1.75B for SE. That's more than 3x the sales level.
Next year we might see >50% growth from Apple which would imply Apple overtaking Sony Ericsson in the phones market share race.