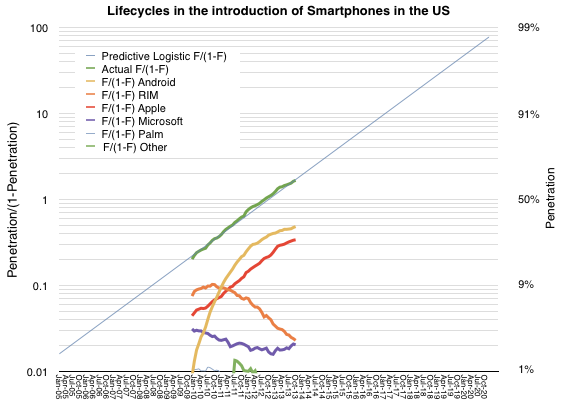
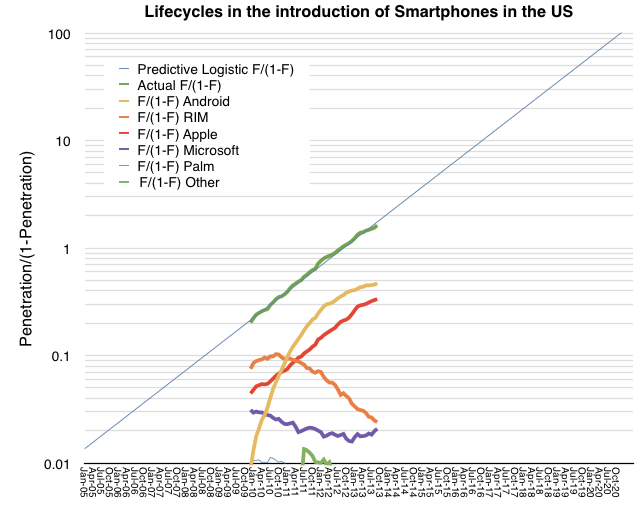
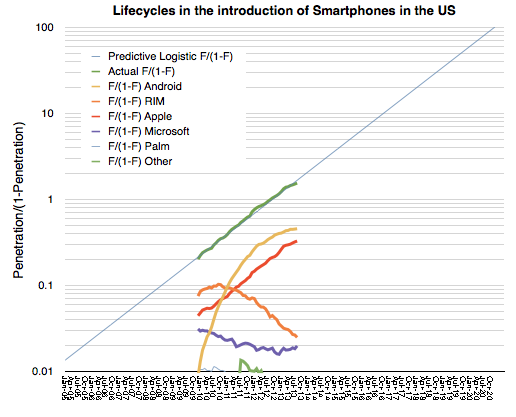
As previously noted, the US smartphone market has followed an almost perfectly logistic growth. The measured data (via comScore, in green below) follows a predictive logistic function (thin blue whose formula is discussed here).
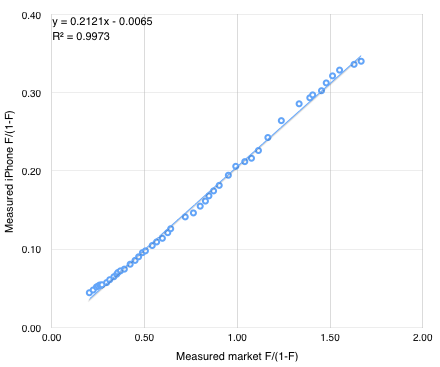
The other notable market observation is how closely the iPhone follows the same pattern as the market. The red line representing the iPhone above is almost perfectly parallel to the green and blue lines which represent the overall market. The reason for this seems to be that consumers are absorbing the product in similar way to how they are absorbing the technology. ((Note that this pattern of adoption has happened even though the product has been at least partially unavailable to the entire market until quite recently.)) The "learning model" which underpins logistic models could offer clues as to the cause. It suggests that there is a direct communication that happens between the product and the consumer.
Incidentally, the reason other platforms do not follow this pattern is that they are not communicating value with the consumer but with manufacturers or distributors of the product. These alternative communications could create faster or slower growth than the overall market as they are not subject to the same large population imitation/learning models.
If we believe that the iPhone can be modeled behaviorally then it may be possible to forecast its growth. One can simply draw a line extending the existing red segment above and read the F/(1-F) figure at any point in time. Solving for F results in a measure of penetration and hence number of users (if population is known.)
An alternative is to use the following formula derived from the linear interpolation of the two measured market shares. iPhone market share is y/(1+y) where y=0.21x and x = F/(1-F) and F is the expected market penetration of smartphones.
So if F = 91%, x = 10, y = 2.11 and therefore the iPhone market share = 68%.
We also know from the plot of the market that F = .91 is reached around February 2017. So we can suggest that at 90% penetration (approximately saturation) the iPhone will have 68% market share of users in the US. Forecasting the addressable market (US population aged older than 13) at about 266 million that implies 180 million US users of the iPhone by early 2017.
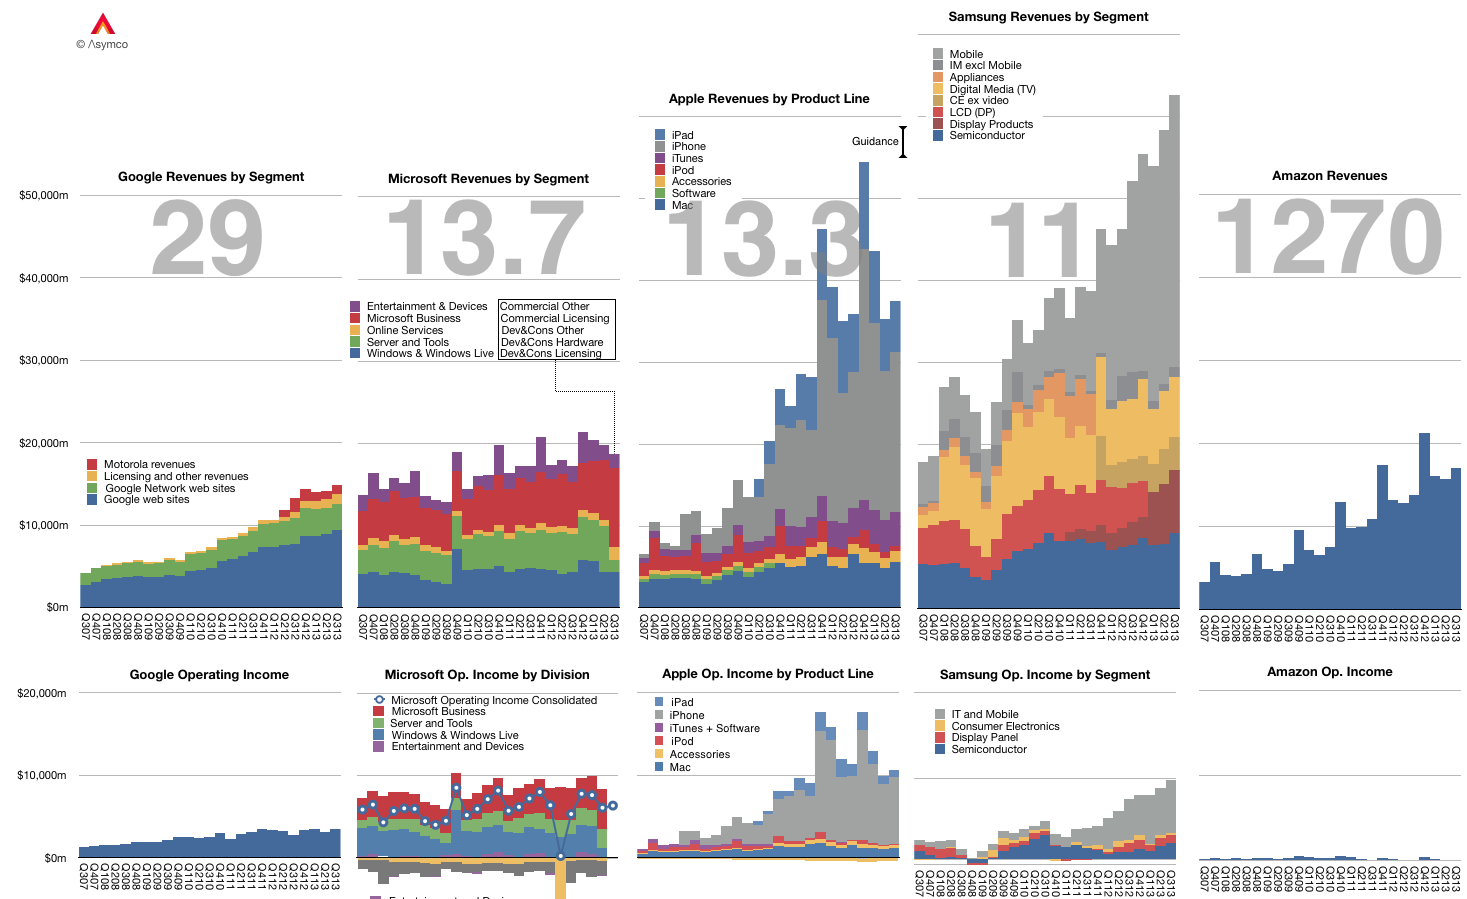
The graph below shows the Revenue and Operating Income for a select group of companies. The large numbers represent the share price to earnings (trailing twelve months) ratio (P/E or PE ratio).
Of course the P/E ratio hides a lot of subtlety. It mostly fails to account for the fact that earnings are largely a matter of opinion. A company can defer income (as Apple and Microsoft do), it can invest earnings (as Amazon does) and can otherwise avoid declaring it since it's taxable.
A better measure is the Enterprise Value to Free Cash Flow ratio (EV/FCF). It reflects a "harder" measure of performance in the form of free cash flow. It is not a matter of opinion but a fact. Enterprise Value also excludes cash which is a measure of past performance.
Nominally both P/E and EV/FCF measure the valuation of a company. They give what amounts to the number of years that current performance can be expected to last. For example a P/E or EV/FCF of 10 can be read as "If I purchase a share today, I should expect the company to pay me back in earnings in 10 years." Any earnings after 10 years are essentially "profit" for the investor.
Inverted these ratios are a measure of Yield or how much of the total investment is paid back in a given year. In the example above, the Yield would be 10% or "If I purchase a share today, the company will pay me back 10% a year in earnings."
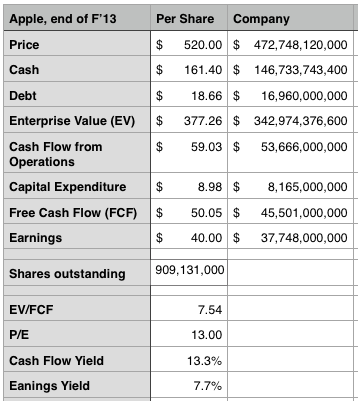
Relying on P/E is troublesome since, as mentioned above, it's deceptive. We get into difficulty when P/E and EV/FCF differ greatly. If a company has minimal cash and declares all free cash flow as earnings then the ratios are the same. However, consider how different these two ratios are for Apple:
The P/E ratio is 13 while the EV/FCF is 7.5. ((It would be very interesting to have both ratios available for all the companies in the graph above.))
This means the investment horizon is nearly half of what P/E suggests. (The cash flow yield should give pause). Put another way, the market suggests that Apple has 7 more years of current profitability and not 13. Note that the P/E ratio for the S&P 500 is above 19.
As Apple's deferrals are increasing investors should look again at what the company's worth. We had similar confusion when the company was deferring most of its iPhone revenue.
All theoretical and empirical diffusion studies agree that an innovation diffuses along a S-shaped trajectory. Indeed, the S-shaped pattern of diffusion appears to be a basic anthropologic phenomenon.
This observation dates as far back as 1895 when the French sociologist Gabriel Tarde first described the process of social change by an imitative "group-think" mechanism and a S-shaped pattern. ((Tarde was probably influenced by mathematician Pierre François Verhulst who first published the logistic function in 1845)) In 1983 Everett Rogers, developed a more complete four stage model of the innovation decision process consisting of: (1) knowledge, (2) persuasion, (3) decision and implementation, and (4) confirmation.
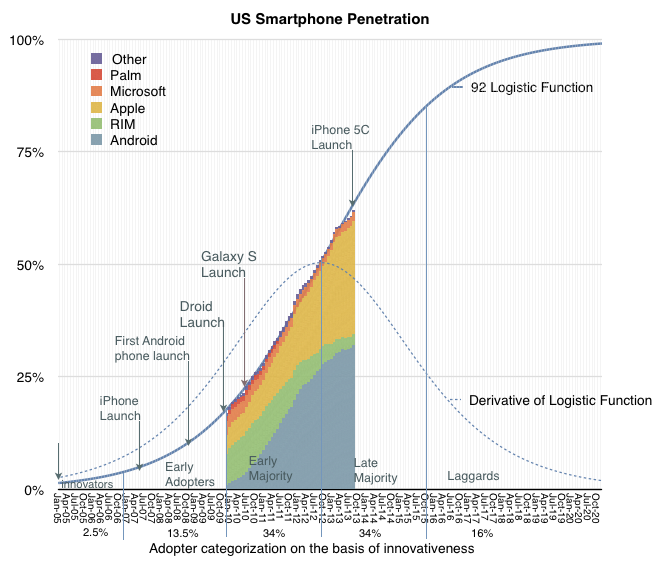
Consequently, Rogers divided the population of potential adopters according to their adoption date and categorized them in terms of their standard deviation from the mean adoption date. He presented extensive empirical evidence to suggest a symmetric bell shaped curve for the distribution of adopters over time. This curve matches in shape the first derivative of the logistic growth and substitution curve as shown below.
In the graph above I applied the Rogers adopter characterization to the data we have on the adoption of smartphones in the US. The latest data covering September is included.
The fact that smartphones in the US follow the theory is exciting, but what can we conclude about the adoption of specific platforms? There has been quite a bit of turnover in the leadership of the market in the first half of the time frame given. You can see this more clearly in the following fractional market share transformation.
Note that, with the exception of the iPhone, if each platform is studied individually, it would not follow a logistic (i.e. linear) pattern even though, as a whole, the technology does.
This then is the big puzzle: while we might be able to predict how smartphones will diffuse into society, we can't seem to predict how any single firm will fare. This means that an investor cannot make a credible "bet" on the technology ((Indeed investors often get burned when new technologies emerge. While the technology booms, individual firms supplying it often fail. See the history of transportation, communication, computing and energy.)). If they choose a single company as proxy, chances are they will lose. If they bet on a basket of companies then, again, chances are they will lose. There is usually one unforeseeably clear winner.
Before we get further into the question of picking winners or predicting the future division of share among rivals, we should understand the underlying causes for this pattern of adoption.
Rogers concluded that the learning behavior of individuals is the underlying cause of the symmetry of the diffusion process.
At the beginning, when an individual is confronted with a new (learning) situation they make many mistakes. These mistakes are gradually reduced (by learning) over time because more and more information is received and acts as a stimulus. The gain in learning per trial is proportional to the product of the amount already learned and the amount remaining to be learned before the limit of learning is reached.
Arnulf Grübler ((The Rise and Fall of Infrastructures, Physica-Verlag 1990)) explains:
This is exactly equivalent to the F(1-F) transformation of the logistic curve. It should be emphasized that these properties of the learning process were found in real learning situations and are confirmed by a large number of laboratory and field experiments. Thus each adoption of an innovation in a social system is equivalent to a learning trial by an individual. Thus, the symmetric diffusion pattern results from the way messages about an innovation are emitted and processed by social learning.
So these observers of the process assign learning behavior as the cause for adoption of a technology. Can the learning behavior be applied to individual platforms? It's tempting.
The hypothesis would go as follows: adopters are not only processing messages about the new technology but they are also trying different platforms as they enter and as they upgrade their phones. If we see platform choice as a learning process then if one platform has a natural advantage, it settles into a dominant position as users "learn" of its advantage. Conversely, if no platform has an advantage then platform "churn" repeats as rivals gain/lose positions of leverage in the market.
The pattern shown so far seems to point to Apple's iPhone having a logistic pattern indicating that it might be benefiting from a learning pattern. The alternative platforms may simply be jockeying for temporary advantage.
It's an interesting hypothesis. To be developed further we need to answer what any learnable advantage might be. I suspect it has to do with the ability to solve unmet and unarticulated needs. In other words, that the winning product solves a set of "jobs to be done" which are difficult to pin down and are perceived rather than defined.
Using logistic curves to measure diffusion of innovations is a powerful method of analysis. However there are limits to what can be learned. The methodology helps in understanding how quickly a pervasive technology is adopted. It assumes that the technology "fills all available space" within a market. It therefore also assumes that whatever problems the technology solves are universal problems.
Put another way, if a technology is not universally useful, it tends to peak before a market saturates. This "universality" condition is in evidence when observing that pervasive technologies are adopted not only by all members of one national market but also all nations and through all means of government and regulation. In other words that the jobs that the technologies are hired to do are so important that they bulldoze any and all obstacles placed in the path of adoption.
The only difference is one of timing. Some regions are quicker than others. Institutionalized obstacles essentially defer rather than deter adoption. They impede rather than block.
And I am pretty sure that smartphones solve universal needs and their adoption will be nearly 100%. They also have fairly low impedance given the speed of adoption (50% penetration in most large markets seems to come in less than 5 years.)
That's the story for the technology, but how value is captured is another story.
Who captures and how it's captured are questions of commerce not economics. They are informed by competitive advantage and business models. The puzzle seems to be that individual companies don't capture value in the patterns of Logistic curves. Or at least I don't think they do.
Consider the graph below.
It shows the transformation of a logistic curve into a linear representation. It's a log-scale graph of fractional shares of smartphones in general (Blue/green Lines) and individual platforms in the US.
The individual platforms are shown as (Platform x share of all phones/share of all others). This is a "logistic substitution trajectory". ((Fisher and Pry, 1971, proposed a similar model to study the replacement of old by new technologies. The basic assumptions of the Fisher-Pry model are: (1) The substitution process is competitive. (2) Once substitution by the new technology has progressed as far as a few percent (i.e., "lock-in"), it will proceed until a complete takeover occurs. (3) the rate of fractional substitution F1 is proportional to the remaining substitution 1- F1 possible. Source: Grübler, The Rise and Fall of Infrastructures Physica-Verlag 1990.))
The problem is that whereas the overall category (smartphones) reaches saturation, it's not at all clear that any individual platform does. At least from the data we have so far, there is far too much volatility in platforms to see a clear pattern of monopoly emerging.
I'm not sure if this is "proof" enough to convince anyone that this market supports any number of platforms, but it certainly disproves that there will be only one. ((The odd pattern here seems to be Apple's consistent (i.e. parallel) adoption. One hypothesis could be that Apple is different in solving the prevailing job to be done while rivals jockey for positional advantage.)) We're too far along for churn to convert existing users before saturation sets in.
In the Innovator's Curse I reflected on the fact that a serial innovator cannot be efficiently financed or even rewarded for having figured out how to repeatably create. If anything, a serial innovator has to suffer a discount to peers who do not habitually (or ever) innovate. The innovation process is the proverbial goose that lays the golden eggs but is destined to perish due to the lack of faith in its existence.
So how can I back this up?
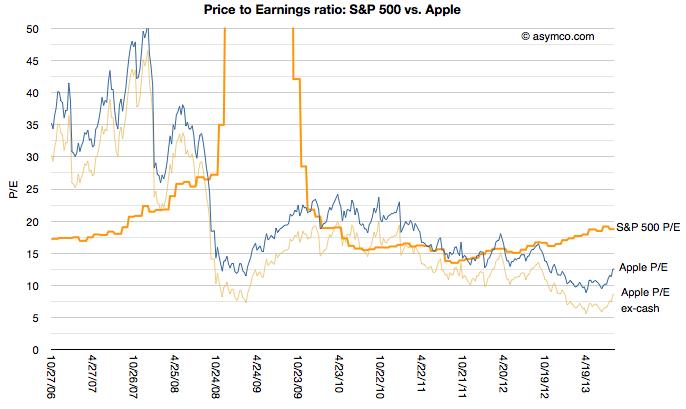
To start, this is partially evidenced in this graph of Apple's price to earnings ratio since 2006 vs. the S&P 500's. The S&P reflects the 500 largest companies in the US and is thus a proxy for the "average" company.
[I added Apple's P/E excluding cash for additional perspective.]
The graph shows that during the period of time when iPhone and iPad changed computing and telecommunications, Apple was mostly held in contempt: the profits it was generating were not considered of "sufficient quality" relative to an average company. Since markets look forward, not backward (one assumes), the vote cast is decidedly that success cannot be repeated. Put another way: you can trust that a soft drink maker like Coca Cola (P/E of 19) or a utility like ConEd (P/E of 18) will continue in the manner we've seen them perform in the last year more than Apple (P/E of 12) will.
I can offer yet another way to consider this curse. Apple's iOS business is designed to capture profits through the sale of hardware. That hardware is manufactured through a process where, while not being the manufacturer, Apple purchases tooling in a capital-intesive strategy to control the means of production. I've discussed this at length before.
But Apple's business is more complex than just enabling manufacturing. Tooling allows for production and production allows for supply but supply is nothing without demand. And demand of the product is driven by investments in software and services and design and marketing and countless details.
In other words, for Apple's modus operandi, if anything should correlate with value it's opex, not capex. It's the investment in the people Apple employs not in the tools it buys.
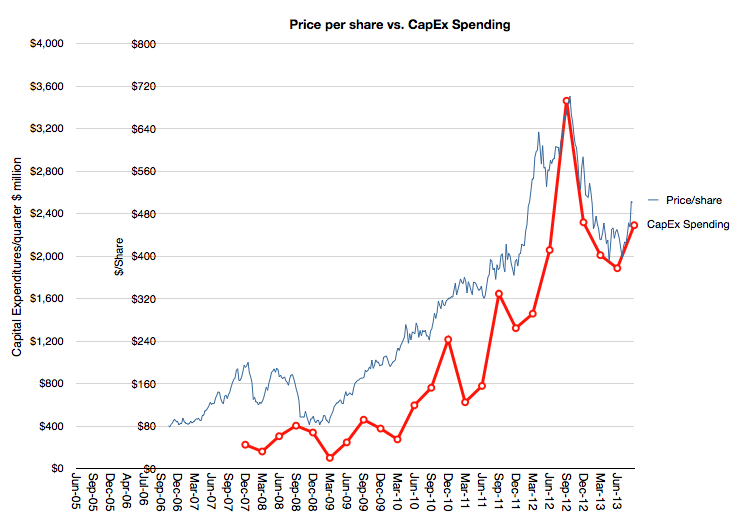
And yet consider this graph:
It shows how the market (though its pricing of Apple shares) values the company overlaid with a Apple's spending on capital equipment (PP&E capex).
The relationship is uncanny. I'm not suggesting causality—that capex (which is publicly pre-announced) determines the share price level—but I am suggesting that there is a valuing of Apple as a producer of goods (for which tooling is a handy proxy). There is no sophistication to this formula. The more iPhones are built, the more the company is valued. Obvious.[1]
But it's not obvious that prior to the iPhone there was iPod, which was a different business (and prior to it was the Mac, ditto.) The stock did not reflect the transitions nor does it assume that anything else will follow. It is, in other words, looking backward, not forward.
--
Notes:
One could suggest looking at CapEx months in advance and predict the stock price, but who would believe such an absurd idea?
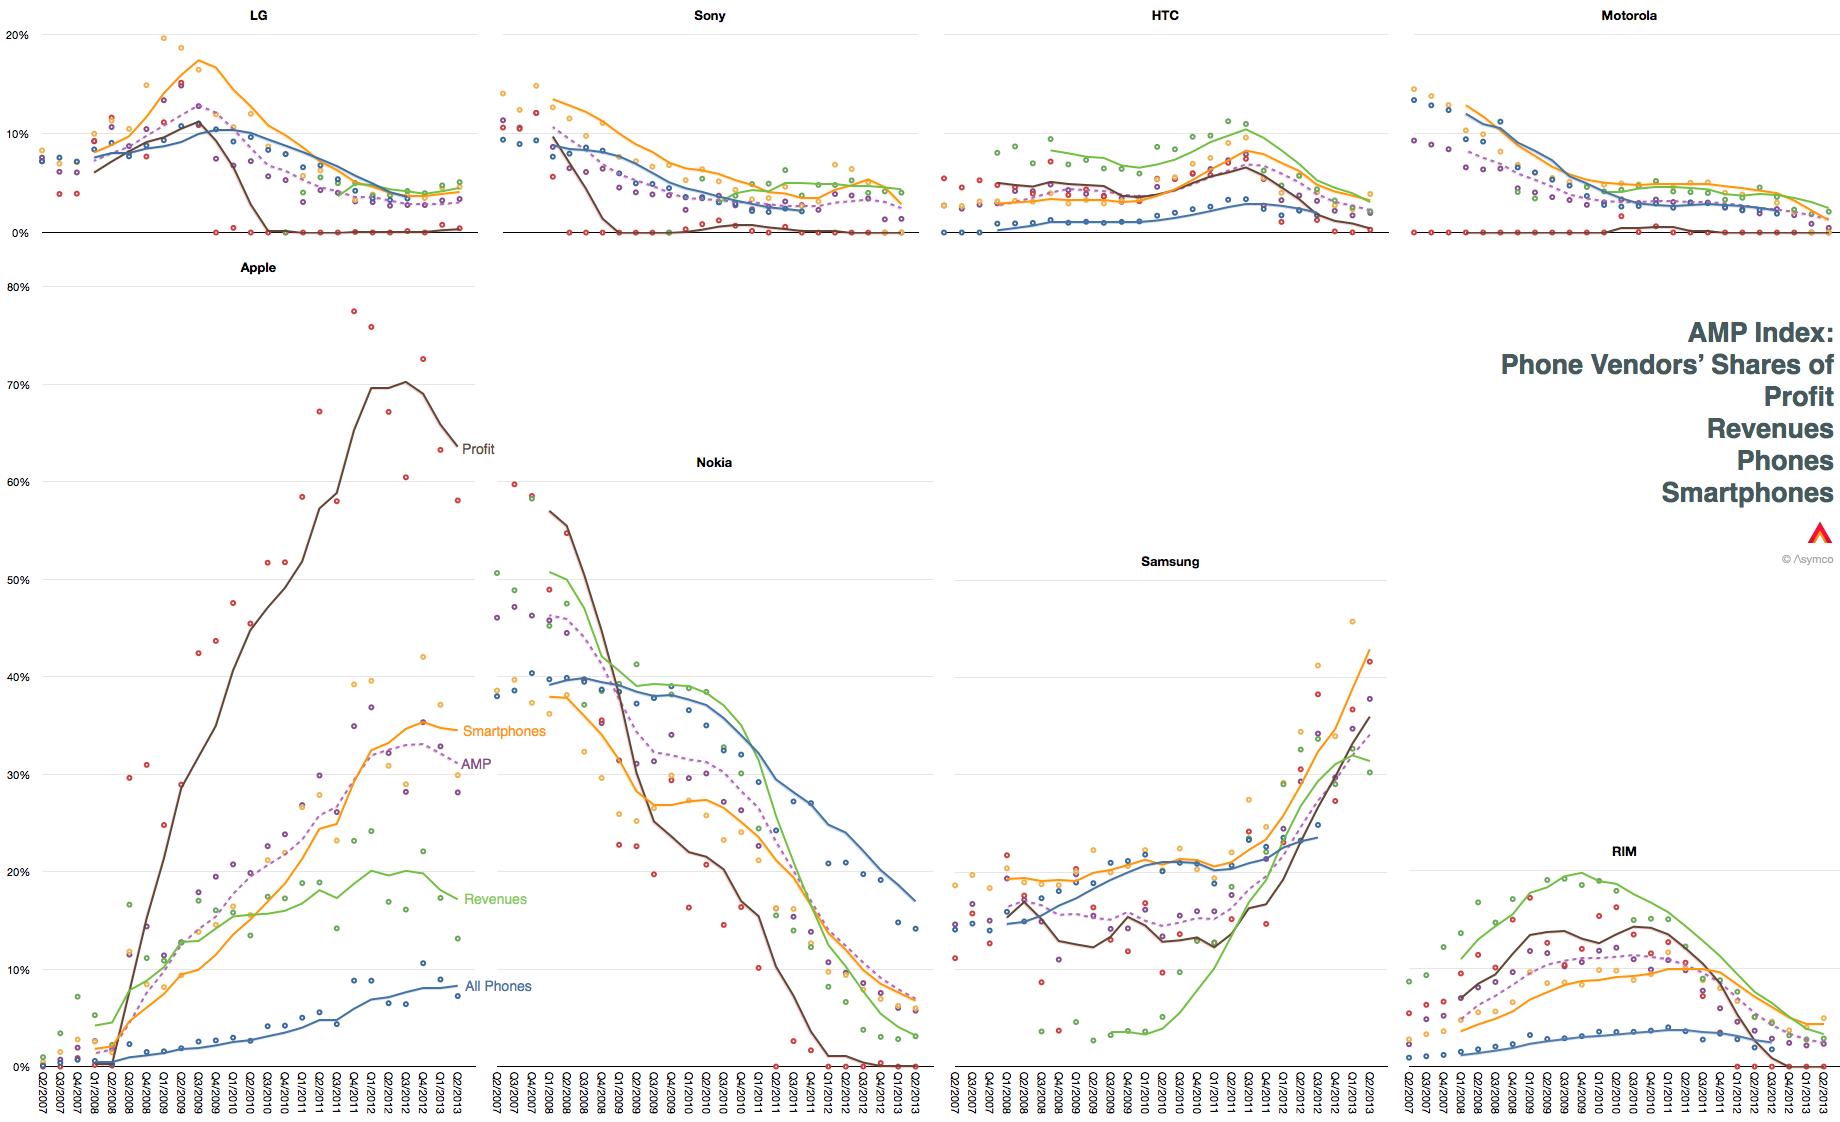
The following graphs show the most visible global phone brands and the approximate percent of value they captured since 2007.
The graphs each show trailing four quarter average of shares of units shipped, revenues, operating profits and smartphones shipped. I also averaged the four shares into a single share number called the AMP index (Asymco Mobile Performance).
Note that this data ignores those "other" vendors whose financials are not available.
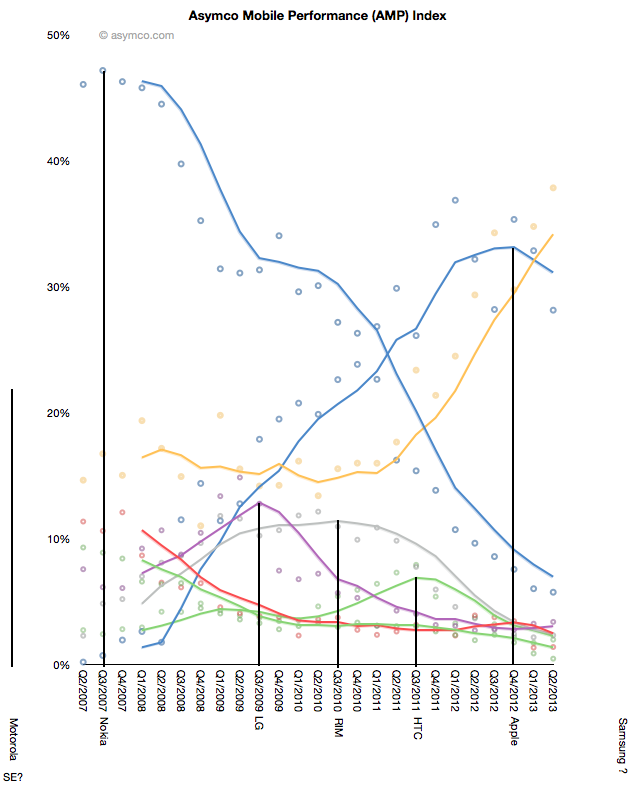
I placed all AMP indexes on the same graph and looked for some patterns. The result is shown below.
It's not much to go on, but there seems to a pattern where each vendor reaches a peak share, though that peak varies greatly in value. If the pattern holds, we could perhaps anticipate a peak for Samsung in one year or so.
I'm searching for some hypothesis of what is happening and what is causing this pattern, if it is a pattern. The instability of the market is certainly a pattern. (Many markets would show horizontal lines for many years rather than what we see here.)
But the constant turnover and the periodicity of success and failure is a characteristic of either a market where there is a hidden hand (operators? regulation? etc.) or one where disruptive change is extremely consistent and rapid.
My responses to questions from Juliette Garside of The Guardian newspaper:
Q: Will noise from Icahn distract the Cook from focussing on product?
A: Investors may think that they can influence management but they do so only when companies are in distress. It’s only then that shareholders can affect some change with their votes as they have a common purpose. The voice of investors carries little weight or distraction when a company is successful. At first glance it seems that Icahn thinks he can unlock value in Apple by getting management to accelerate share buybacks. That’s a modest goal and not one which needs to distract managers.
Q: What will do most for the share price – a buyback or a blockbuster new device?
A: Neither. What will do most for the share price is a change in the perception that Apple is not going to survive as a going concern. At this point of time, as at all other points of time in the past, no activity by Apple has been seen as sufficient for its survival. Apple has always been priced as a company that is in a perpetual state of free-fall. It’s a consequence of being dependent on breakthrough products for its survival. No matter how many breakthroughs it makes, the assumption is (and has always been) that there will never be another. When Apple was the Apple II company, its end was imminent because the Apple II had an easily foreseen demise. When Apple was a Mac company its end was imminent because the Mac was predictably going to decline. Repeat for iPod, iPhone and iPad. It’s a wonder that the company is worth anything at all.
ComScore's latest survey for US smartphone users showed that Android had 52% share of about 142 million users. That amounts to 73.84 million Android devices in use.
ComScore's previous such survey showed that Android had 52.4% of about 141 million users. This amounts to 73.88 million Android devices in use. It also means that Android usage in the US went down for the first time.
The difference is surely within a margin of error so it's not something to declare definitively, but the pattern of Android "peaking" has been evident for some time.
Even though share stopped growing about a year ago, Android continued to gain users as overall smartphone consumption increased. The last few months however have shown a slowing of new smartphone users and therefore we have this first instance of Android appearing to lose usage.
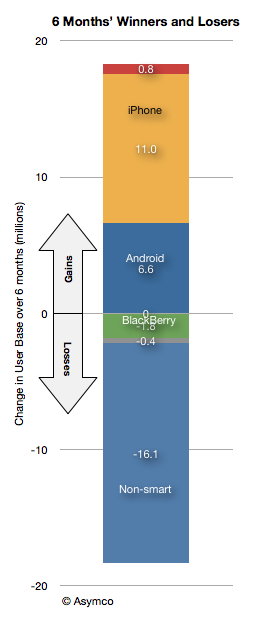
Note that this has not been the case for iPhone as usage over the last six months is up by 11 million users vs. 6.6 million for Android.
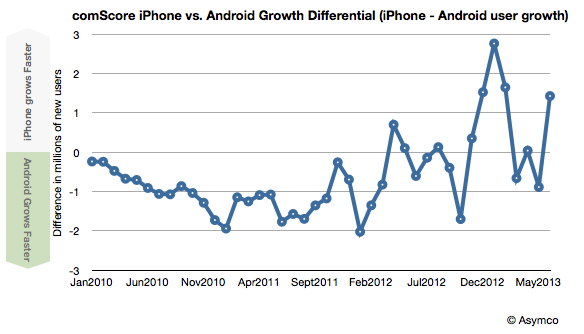
Indeed, iPhone gained more users than Android for the last 6 out of 8 months.
At the end of the first quarter 2013 there were 946,035,000 fully diluted shares of Apple stock outstanding. At the end of the second quarter there were 924,265,000. The 21,770,000 shares that disappeared were purchased by Apple and retired. Apple shares traded between $390 and $463 during the quarter so it's hard to know exactly how much Apple paid for them, but at an average of $426.5 per share Apple would have spent $9.3 billion
Management explains:
In late April we executed a very successful debt offering issuing 17 billion of debt across 3, 5, 10 and 30 year maturities. We paid $2.8 billion in dividends in the quarter and we also utilized a total of $16 billion in cash on share repurchase activity through a combination of a new accelerated share repurchase program and open market purchases. $12 billion of the $16 billion was utilized under a new ASR program initiated with two financial institutions in April.
An initial delivery of 23.5 million shares was made under this program with the final number of shares delivered in average price per share to be determined at the conclusion of the program, based on the volume weighted average purchase price of Apple’s stock over the program period, which will conclude in fiscal ‘14. In addition to the new ASR, we executed $4 billion of open market share repurchases, resulting in the retirement of 9 million additional shares.
Later, during Q&A:
Tavis McCourt - Raymond James: Thanks for taking my question. Peter, first a clarification on the share buyback and can you tell us what the ending basic share count was in the third quarter?
Peter Oppenheimer: All of that is on the income statement, so you got the ending basic and diluted, but let me give you a couple of points that I think could be helpful for you. During the June quarter, we concluded the first $2 billion ASR program that we started in December and then so we got the final shares in on those, and we did our second ASR program of $12 billion, that started at the end of April and we received 23.5 million shares initially on that. And I went through in my prepared remarks, at some point during fiscal ‘14 that program will close and we will get the final number of shares. We also bought back $4 billion of stock in the open market during the June quarter and received about 9 million shares. So, the impact of those in the June quarter lowered our diluted share count in the quarter by about 22.9 million shares. And as you look forward into the September quarter before any further buybacks or any issuance to employees we would expect to see an additional approximate 11 million share benefit from the things that occurred during the June quarter.
This is a bit convoluted, but it seems that Apple has committed to buy $16 billion worth of its shares but has not completed the retirements. They see an additional 11 million shares being retired from activities conducted in the June quarter. (Nota bene: when calculating future EPS, take these shares out of consideration.)
If we add the 11 million yet-to-be-retired to the 21.7 million already retired and assume $16 billion was paid for them then the average price paid was $488.25.
Not a bad price. Share re-purchases are valuable only if the price paid is low (a determination that is usually beyond the scope of management to make.)
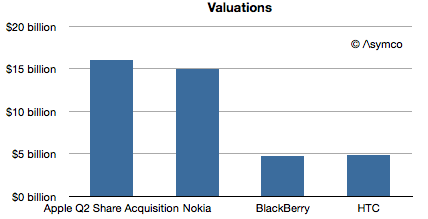
But what is even more interesting is that if we consider the $16 billion expenditure as an acquisition, then Apple has made what amounts to its biggest. It's more than some familiar companies are worth:
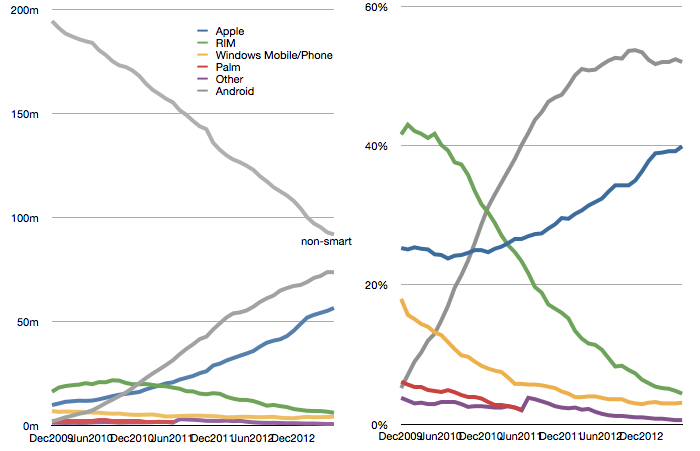
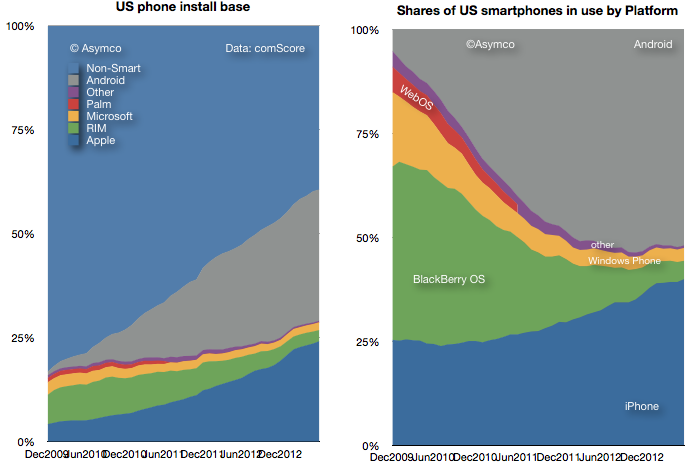
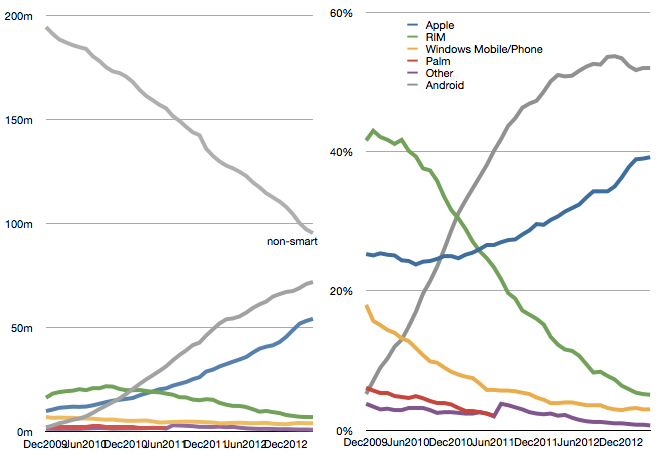
The latest comScore US smartphone install base data is in and there are few surprises. iPhone has reached a new record high penetration (39.2%) and user base (54.3 million). Android has reached a new high in user base (72 million) but share at 52% is below the peak reached in November 2012.
This pattern of gradual iPhone share gain in the US has been consistent for over two years even while Android has catapulted into an overall lead. The surprising thing is how Android seems to have peaked in share. There are still 95 million non-smartphone users and there seems to be headroom for growth even though the other platforms have been tapped out. But it does not seem that Android phones have any particular advantage over iPhone. My hypothesis remains that as price is taken out as a differentiation, the adoption of iOS is slightly higher than Android.
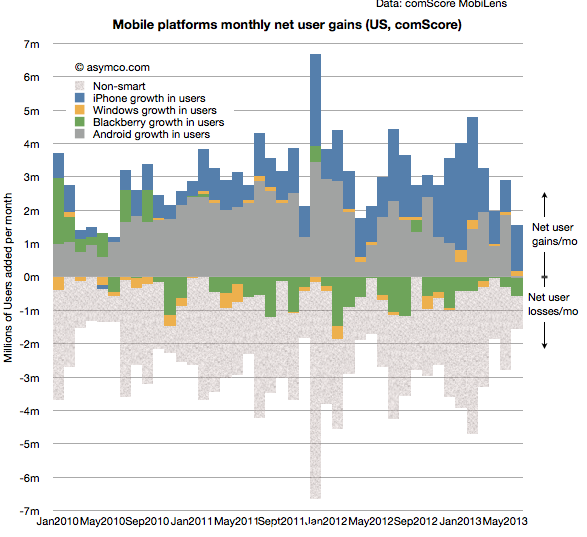
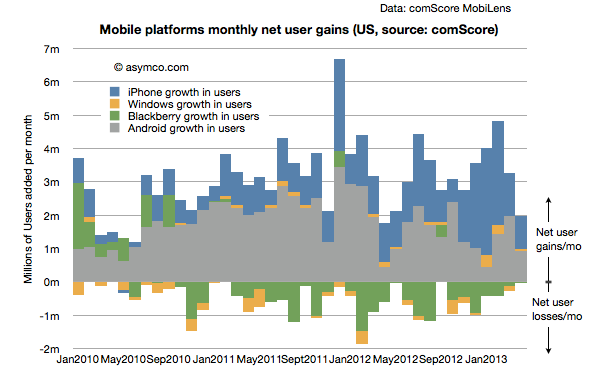
Another measure of market performance is the implied net platform user gains which is shown below:
It shows that iOS added more users in the last few months than Android.
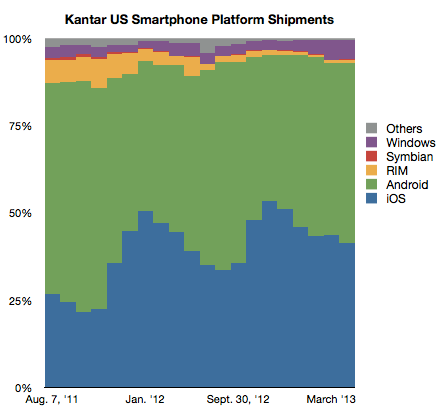
The problem is that Kantar Worldpanel measures shipments and their share data shows a seemingly different picture.
In their data Android is shown as selling more units during January through April while Apple sold more during October through December. Of course we don't have the absolute number of units so can't see the effect of higher holiday overall sales volume. Nevertheless, the balance of growth seems to be disproportionately in favor of Android relative to the data from comScore.
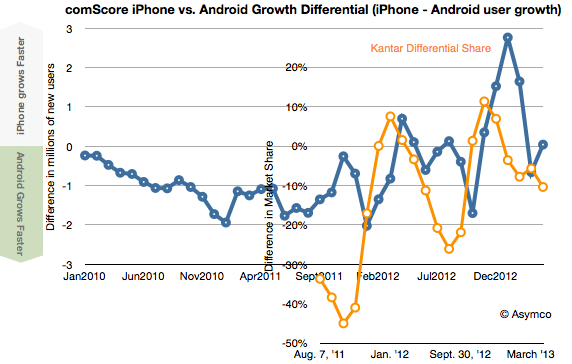
To look at the situation more closely I measured the differential in user adds for comScore and the differential in market share for Kantar's data. Then I overlaid the two differentials so that months are matching, as shown below:
There is a similarity to the frequency of oscillation with comScore data showing a delay (as would be expected since their data is sampling over a three month period). However, we are still facing a vertical offset where there is apparently more growth bias for iPhone in the comScore data.
Possible factors which might be explanatory:
Methodologies used. comScore data excludes ages below 13 and non-personal devices (business expensed phones.)
Replacement sales are invisible in comScore data since the user base does not change when phones are replaced (and old ones are discarded.)
Missing data from Kantar. Given their survey methods it's possible that their panels miss some market segments.
Last week Frank X. Shaw, VP of corporate communications at Microsoft stated:
... most of the people around me were using their iPads exactly as they would a laptop – physical keyboard attached, typing away, connected to a network of some kind, creating a document or tweet or blog or article. In that context, it’s hard to distinguish between a tablet and a notebook or laptop. The form factors are different, but let’s be clear, each is a PC.
Actually this "admission" that iPads are PCs is not something new. Steve Ballmer made the same assertion in 2010 pre-iPad (though calling them slates). Arguably, the notion that tablets are PCs has been dogma at Microsoft for over a decade and Windows running on all form factors has been a strategic guiding principle.
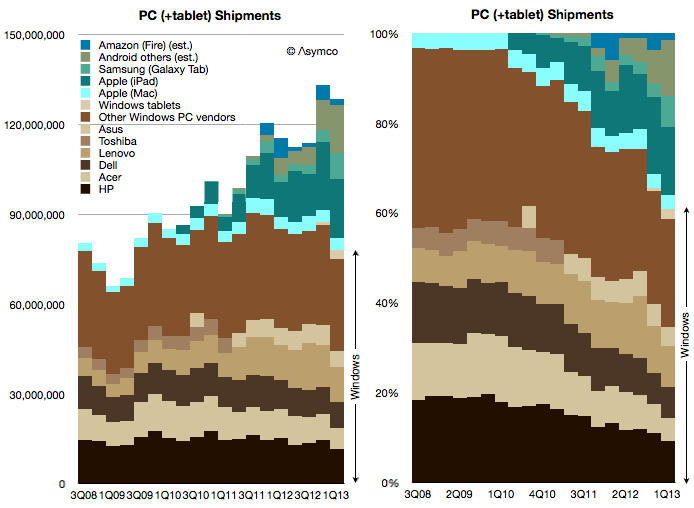
Which is why I've always added the tablet data to the PC data to create a picture of the "personal computing" market. And this is what that picture looks like today:
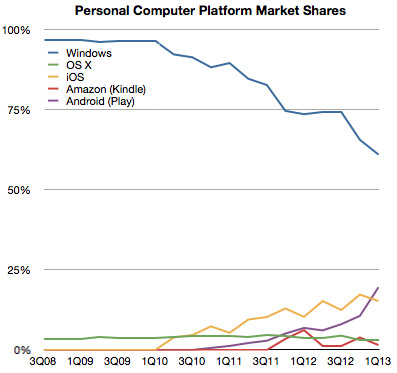
Note how the share of various platforms has evolved over this brief time span:
Seen this way, Windows has now reached 60% market share and it's likely to dip below 50% during this year. What happens beyond then is harder to imagine. If Windows tablets start growing as fast as the tablet market overall then Windows could stabilize in share. But if Android and iOS tablets follow their phone brethren in growth then it will be far harder for Microsoft to maintain share. But is that cause for concern?
Not necessarily.
The total computing market[1] is likely to expand to over 4 billion users with 1.5 devices per user in the next five years. That expansion implies that 20% share equals more than one billion devices, making such an ecosystem "good enough" for the average developer. It certainly has been good enough for Windows developers to date and they have kept hiring it throughout the new mobile app revolution.
So even if Windows dips to only 20% of the world's computing market it will still be perfectly "viable" for some time to come.
--
I define the computing market as the total number of devices which have (a) a CPU (b) a broadband connection (c) a native application execution environment which is open to third party apps. This definition implies the presence of an "ecosystem" which is bound specifically to a platform.