Asymco

Asymmetric Intelligence

share

  1. Measuring Platform Churn

    Research · 33 comments

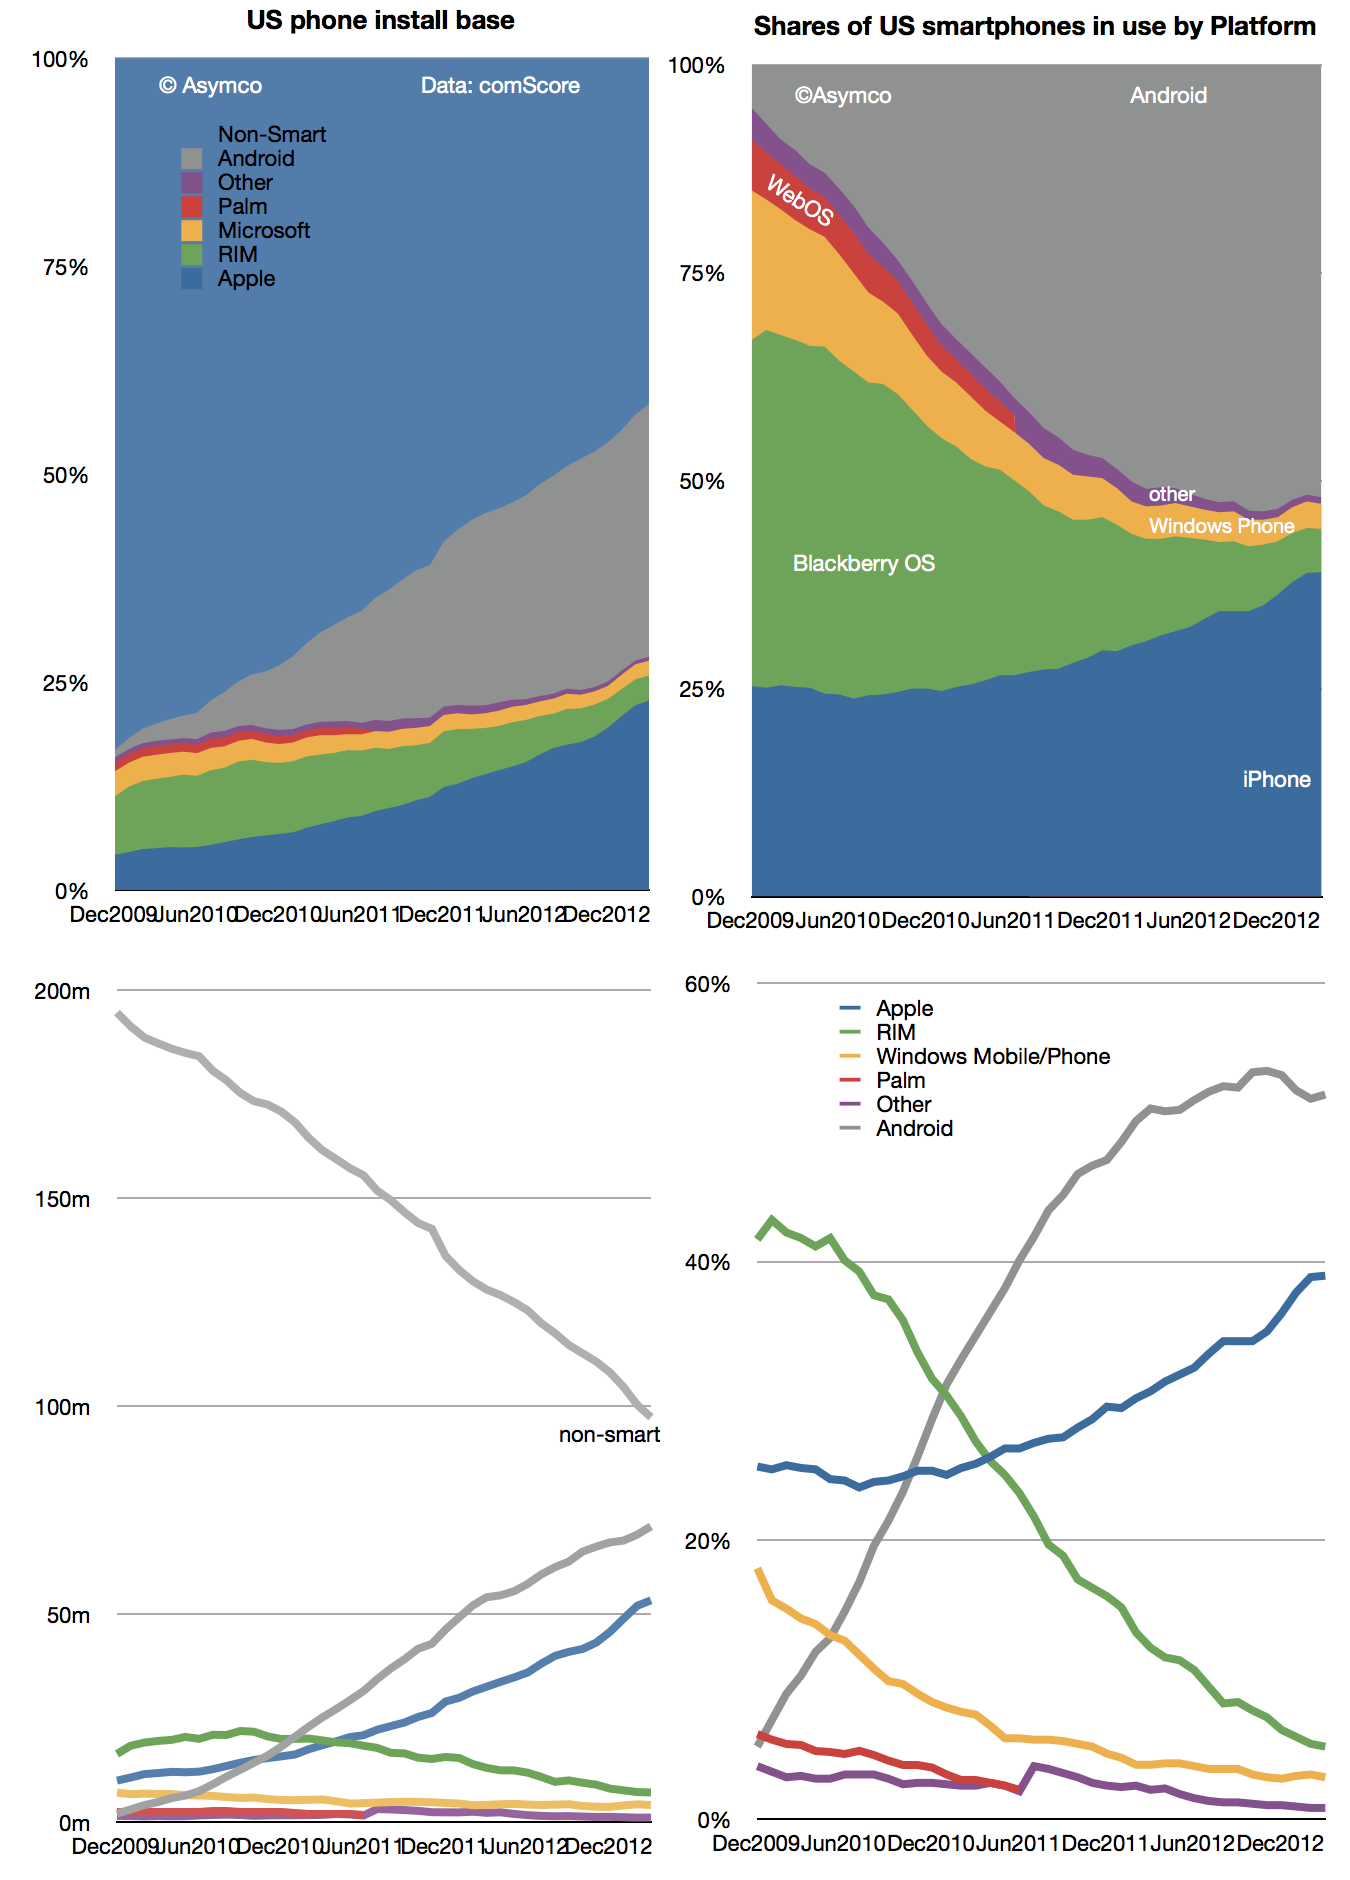
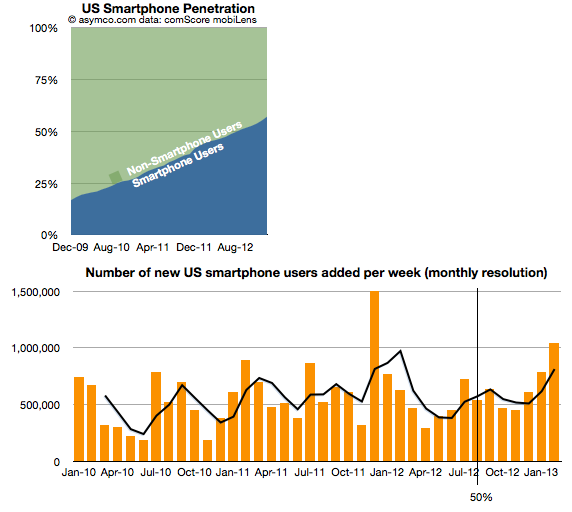
    The latest comScore data shows consistent growth in US smartphone penetration. The rate is now 58.4% of adult consumers who own phones. This is up from 20% only three years ago. The rate of growth remains a remarkable 1.2% per month. That's 700,000 new-to-smartphone users every week. The historic average over 3 years has been 1.07%/month This after having crossed over 50% on schedule in August 2012. There appears to be no slowing.

    Screen Shot 2013-05-06 at 5-6-5.42.50 AM

    The next milestone I have pencilled in is the 80% mark which I extrapolate to be achieved by October 2014. 80% could be considered "saturation" which would signify a rapid slowing of new user addition. However, that might still not happen until 100%, depending on the availability (or lack thereof) of non-smartphones to buy.

    This time frame is important because it would imply that essentially all mobile users in the US (some 234 million) would be a part of one ecosystem in about 2 more years. That's less than the life cycle of the typical mobile contract (and thus the life of one phone). Put another way, by the time a new buyer today is ready to buy the replacement to their phone the market will be saturated.

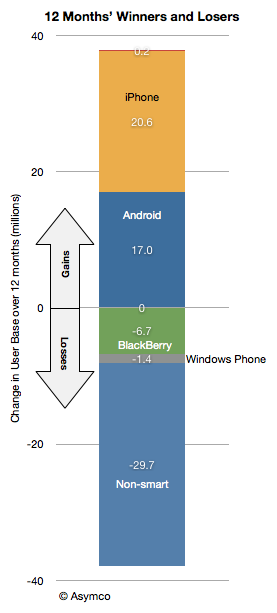
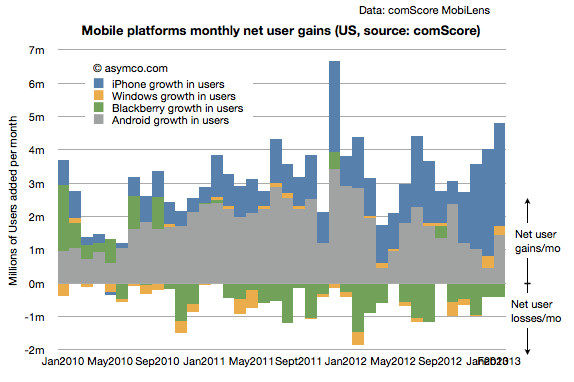
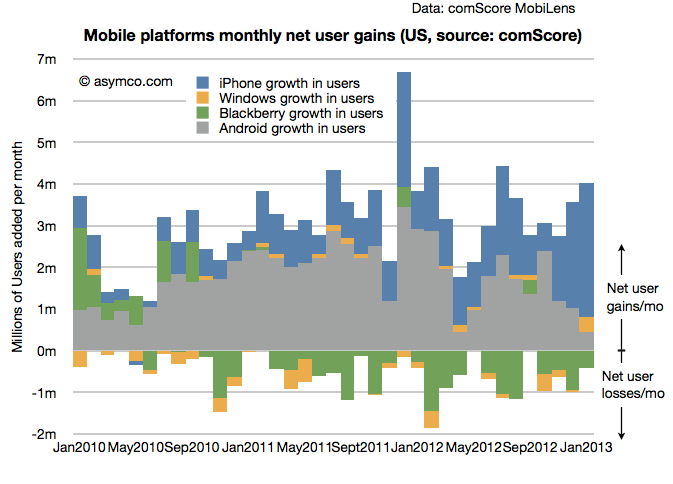
    This implies the mode of competition will be changing to smartphone replacement rather than smartphone adoption. To some degree this is already happening but as the net user gains data shows only BlackBerry and Windows platforms have had any net user declines in the last two years. "Platform churn" is still a relatively rare phenomenon.

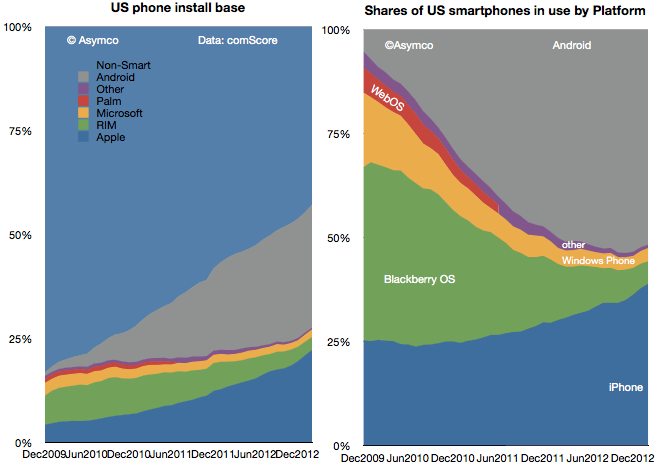
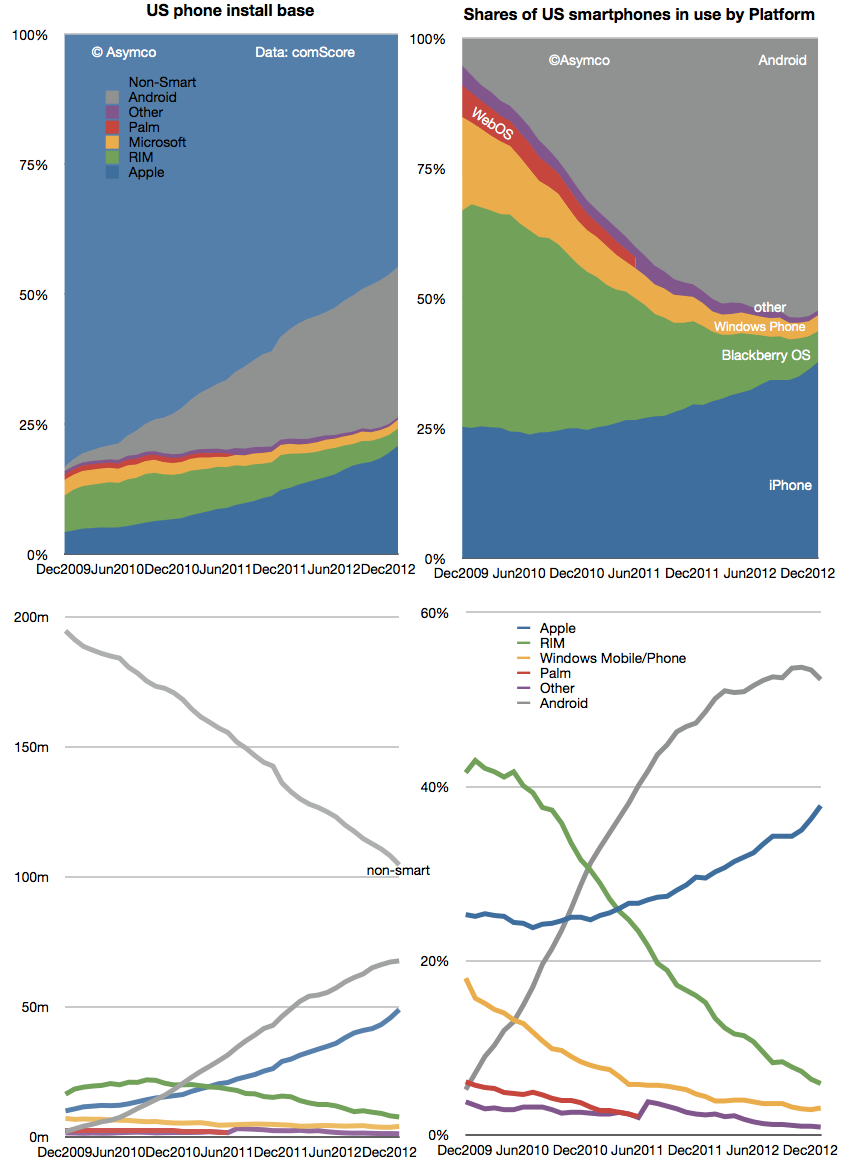
    How that will change post-saturation will be a crucial determinant to platform growth. The data today points to a higher degree of loyalty for iOS users and potential erosion in the Android user base as a result. There are ways of forecasting this on the basis of survey data as Carl Howe did. However, the data from comScore has already begun to show that Android may have peaked around 54% share. Android share is now at the same level it was in July while iPhone share has grown by more than 6 points since then.

    Screen Shot 2013-05-06 at 5-6-5.40.28 AM

    There is a pattern of higher growth into the end of the year and an iPhone plateau into the first quarter, undoubtedly due to holiday buying favoring the iPhone. I don't want to discount the possibility of some change in this pattern but so far there seems to be a plausible reason for it: with iPhone pricing and availability in the US offering no advantages to alternatives, Apple's product is the most popular. Nearly more popular even than all the other competitors combined.

  2. Surface Tension: The effect of Surface on Windows revenues

    Research · 34 comments

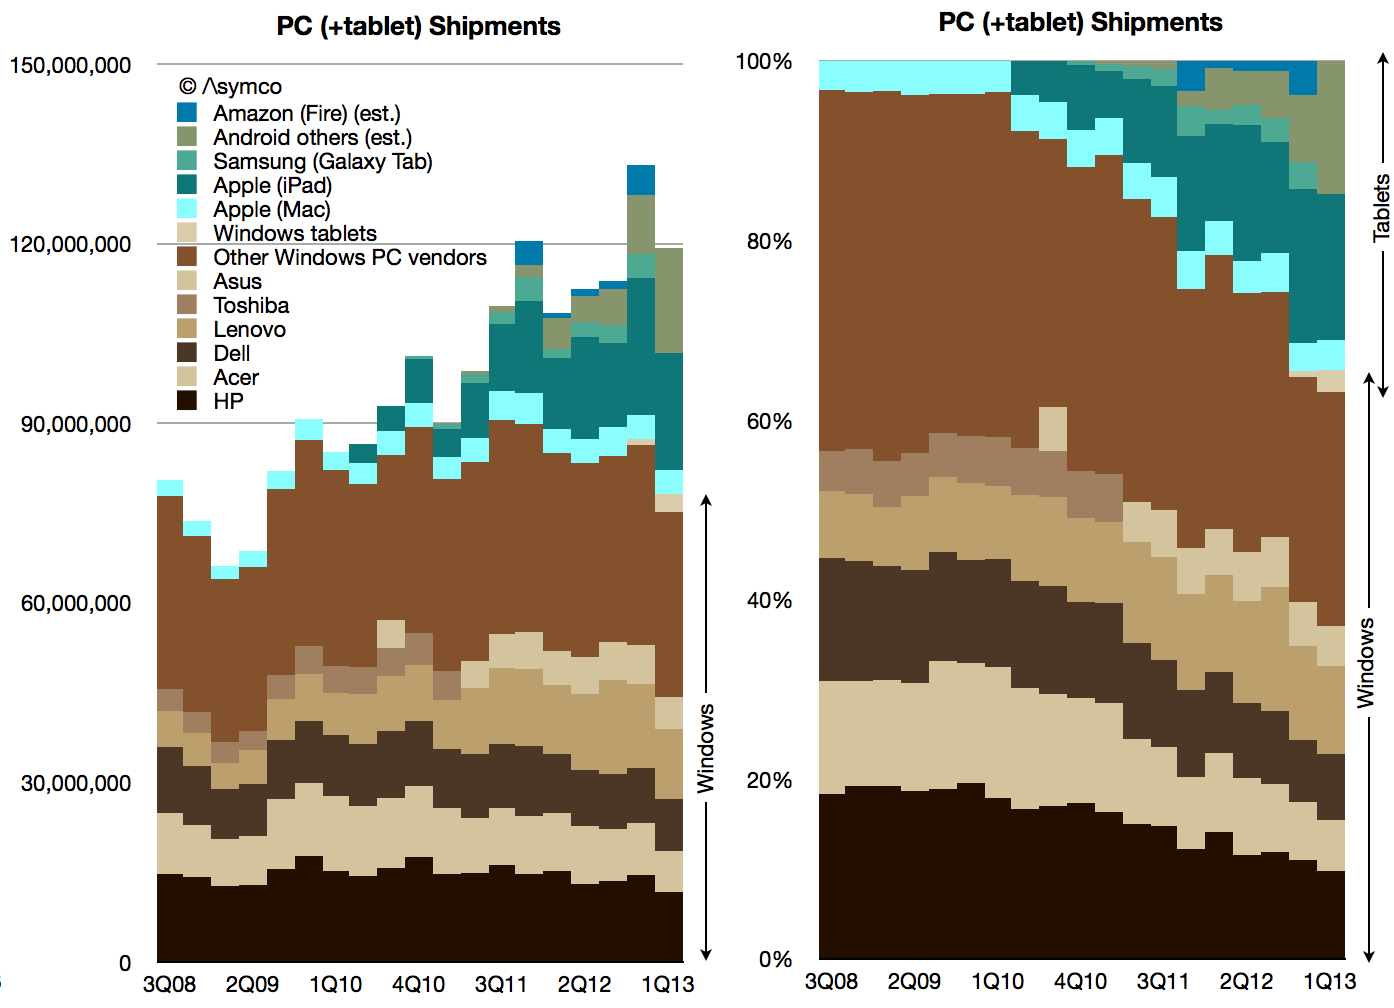
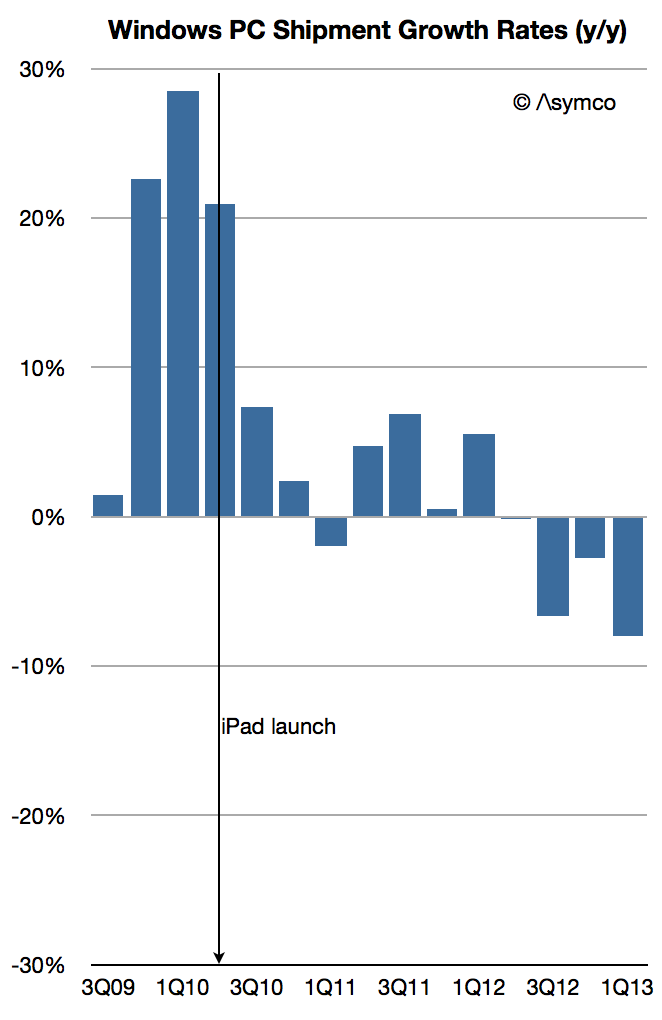
    According to Strategy Analytics 3 million Windows-based tablets shipped in Q1. That is not inconsequential. It would add 4% to the total Windows-based computers and reduce the decline in Windows PC growth to -8% (from -11%). You can see the effect of those units on share in the following graphs.

    Screen Shot 2013-05-02 at 5-2-2.06.21 AM

    Note the "boundary layer" of pale blue Macs between the brown-hued Windows and the green-hued tablets.

    Including tablets of all kinds, here is the market share growth in Windows PCs.

    Screen Shot 2013-05-02 at 5-2-2.06.30 AM

    As the post-PC disruption evolves, Microsoft has made an effort to shift its business model. I discussed this some time ago and there remain quite a few questions about the sustainability of the strategy.

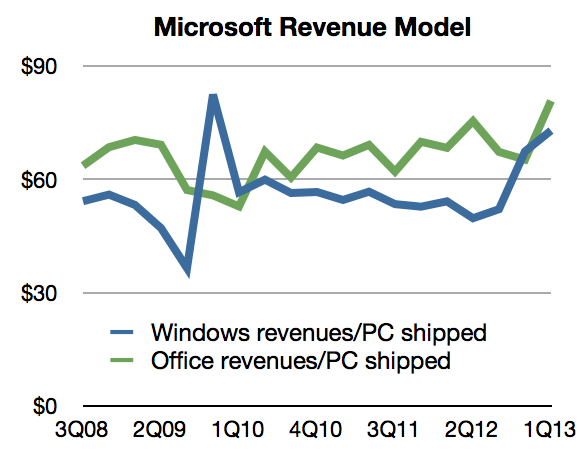
    However, there might already be evidence that it's working. The clue is in the growth in Windows revenues at a time when PC shipments (at least traditional ones) are declining rapidly. Some of that might be due to deferrals and software assurance revenues which are insensitive to shipments. However some have to be due to the Surface.

    Remember that Surface launched with an RT version priced starting at $499 (which did not sell well) but received a boost in Q1 with the Pro version priced at $899 to $999. If we assume a 80:20 mix of Pro to RT and an average price of $950 for the Pro and $550 for RT, 3 million units would generate at least $2.5 billion in gross revenues. Accounting for retail margins of 20%, Microsoft could still be recognizing $2 billion in revenues. That's a significant portion of $5.7 billion in Windows revenue.

    We can back into this figure from another direction: Prior to Surface launch, the Windows revenue per PC shipped (combining Microsoft's revenues and Gartner's estimates) was about $50. After the Surface Pro shipped the revenue climbed to $73/PC.

    Screen Shot 2013-05-02 at 5-2-2.06.38 AM

    Assuming the same pre-Surface revenue/PC and given the shipment figures for Q1 we would get about $3.7 billion for Windows. The difference to actual revenues is about $2 billion.

    So the extrapolation of Windows royalties approach yields $2 billion in Surface sales and the Price x Units estimate also yields $ 2billion. It would suggest that Surface has had a significant impact already: More than a third of Windows revenues depend on it.

    [UPDATE: I've been informed that not all the Windows tablet sales reported by Strategy Analytics are Surface products. As many as 1 million might not be. That would reduce the revenues as calculated to about $1.4 billion. In addition, not all Windows revenues are current with much of that deferred. Actual revenues were $4.6 billion. With both of these adjustments considered, the impact of Surface might be only 30%.)

  3. The job the iPhone is hired to do, part II

    Research · 52 comments

    I repeat what I’ve mentioned before: The iPhone is primarily hired as a premium network service salesman. It receives a “commission” for selling a premium service in the form of a premium price. Because it’s so good at it, the premium is quite high.

    The job the iPhone is hired to do 

    The original post on the hiring of the iPhone by operators was anchored in data about the revenue per unit (or price) that the product was able to obtain. The remarkable resilience in the exceptionally high average price showed that the iPhone was still getting a premium for moving users to higher levels of spending on network services.

    The evidence was circumstantial however: By knowing the price and knowing it was far higher than competing products and knowing that much of it was paid by the operator and not the consumer (at least not up-front) implied that it was the iPhone, and only the iPhone, that was hired as a network service sales tool.

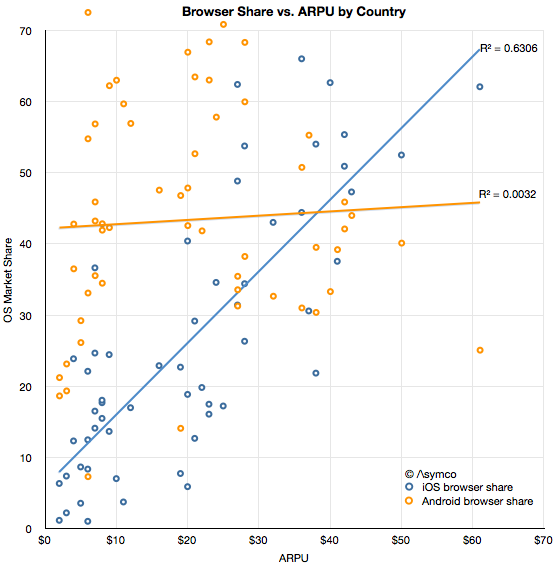
    Now we have more evidence thanks to Ben Thompson (@monkbent). I illustrate the data here as an x-y scatterplot.

    Screen Shot 2013-04-23 at 4-23-11.21.37 AM

    The data consists of ARPU (Average Revenue per User) ITU data from 2010 for 60 countries combined with browser share data on a country-level from the current period (sourced from StatCounter).

    The first observation is that there is a modest correlation between iOS usage and ARPU. It may not be particularly interesting by itself but it is interesting when compared with the lack of correlation between Android usage and ARPU.

    The presumption behind smartphone usage is that it leads to more browsing which leads to more network usage which in turn, leads to more network revenues and, finally, more network investment. If there is no additional browsing then there is a far smaller economic incentive to network operators to invest in infrastructure. It is this link between usage and revenues which I hypothesize drives operators to carry, subsidize and promote the iPhone. And the resilience of this link indicates that it still works.

    The ASP data seems to support this hypothesis and so does the ARPU data. The more iOS is in relative use, the higher the network revenue per user. Correlation is not causation, but when combined with data about Android, we can also say that the presence of the primary iOS alternative does not lead to more revenue. In other words, if a lot of iOS is present then revenues are higher and if there is little iOS present then revenues are not higher.

    I'm not suggesting that Android users use less bandwidth—the share data is after all relative—but rather that Android use itself does not seem coupled to paying more (or less) for service.

    If there is something to be concluded it's that not all usage is created equal. The data regarding how apps and ads are consumed is consistent with a qualitative difference between iOS and Android. This data is more of the same.

    It's something of a cliché to say that audiences vary in terms of quality, but that does not make it less true. Indeed, network operators depend on it being true.  And so does Apple.


  4. Interview with Chosun Daily of Korea about Apple

    Research · 65 comments

    The following interview took place by email on April 15th, 2013.

    1. What are the truth and false about the 'Apple shock' currently? In what perspective should we see this?

    First, I'd point out that during Steve Jobs' time the company suffered many such shocks. The stock fell many times far further than it just did for trivial and irrational reasons. Recently Warren Buffett himself pointed out that his own company had 50% drops in value four times in the past. Share prices are not always good indicators of potential and markets are not always efficient. I catalogued the dramatic share price declines in Apple during the last decade here.

    Second, I'd point out that the number of people watching and commenting on Apple has grown almost as fast as its sales and earnings. When Apple was small the people who studied Apple were few. (You could see this today for other, modest tech companies. There aren't 50 analysts writing reports every day and 2000 bloggers tweeting about Lenovo even though it's a successful and growing PC company.) Because of this growth, I would guess 80% of the observers have not observed Apple's prior painful episodes first hand. For them this is the first time a "dominant" Apple has slowed. The amplification of so many voices raising alarm makes it seem truer, but it isn't.

    Third, the failures being cited are not significant. In terms of increased competition, before Samsung there was Nokia and Motorola and the mobile Operators and Microsoft and Dell and many others long forgotten. They were all about to "defeat" Apple. As a quick example when Apple was "the iPod company," iTunes was considered vulnerable and fragile due to DRM concerns or the Beatles not being on it. Microsoft was launching "Plays for Sure" and Zune and Creative was suing Apple over patents. These battles are long forgotten. Before those there were concerns about the viability of the Mac that go back decades. At the time those were actually very valid concerns. At the time Apple did not have half a billion users. It depended on one product. But what saved them was a process of development of new products not the products themselves. iPod faded, Mac faded. What mattered is that they created new things to replace them.

    Finally, what is not commonly understood is that the mechanism for creating things at Apple is unchanged. Its functional organization is inherently unstable and chaotic, sometimes looking like it will derail. But that's the way it was designed to be. You just have to have faith that it's a system that works. Those who did in the past were well rewarded.

    2. What possibilities out of 1~10, do you think, Apple will suffer the same downfall as Steve jobs has left the company in the past in current?

    The threat is negligible. During the first departure of Jobs, the intention of management was to make the company into "a proper company." The plan was, essentially, to remove the chaotic model that Jobs had put in place and replace it with something more "rational" and "grown up." After he returned he set about not just returning the company to the way it was but to also codifying and identifying exactly what that was so that it did not happen again. You have to appreciate that the greatest thing Jobs ever created was not a product but Apple itself.

    Note that Apple managers stay in their roles the whole time they are there, sometimes for decades. There is no "general purpose" manager and the whole company has been organized along these functional lines. The way to think about it is that during his first departure the new management tried to undo what Jobs had built which is why it became dysfunctional: the DNA did not match the body it was operating. His return re-aligned the culture and operations to what was originally developed. As long as new management does not try to undo that, they'll be all right.

    3. Apple is now defined by some people, as 'the company who modifies well', not 'the company who innovates' well. What they made was ipad, ipod, iphone, apple tv and all the modifiers of the original products. Do you agree? If you do why?

    Innovation is not invention. Innovation is the application of invention in ways that solve new needs. I'm always amazed at how misunderstood this term is even though the definition is easy to understand:

    ("Innovation differs from invention in that innovation refers to the use of a better and, as a result, novel idea or method, whereas invention refers more directly to the creation of the idea or method itself.")

    Apple is an innovation machine. It does invent but that's not valuable in itself. Not all inventions are applied and not all innovations depend on internal inventions. Innovation is applied invention just like engineering is applied science. A better way to think about Apple is to think about Pixar. It's a blockbuster manufacturer. It makes blockbusters and nothing else. That means it does not make many of them and not always regularly and that the ideas may not be original, but the results are always very popular. Pixar is not like any other studio that makes some hits and some flops. Pixar is also a functional organization. It's not an accident that they were both built by the same person and that they are both successful after he left.

    4. Google is forecasted to release lots of products this year, but Apple isn't really looking forward to so many innovations. Inside Apple, is the innovation team really making a new innovative product? what are their longterm plans to fight with Google, or Samsung and the rest of the competitors?

    People outside of engineering organizations, especially large ones, don't appreciate the time scales involved. Products you see today were designed, planned and developed many years ago. We see plenty of evidence of this but we tend to ignore it. Consider that some prototypes end up on ebay showing they were built years before launch. It is the same with evidence presented in trials proving work on the product 4 to 5 years before it was launched. This is not the case just for Apple but all other technology companies.

    For this reason, what is happening in the market and what is happening inside the company are two completely different universes. The tendency is to assume a direct relationship between market momentum and current management decisions. These are connected but with many years in-between.

    For example, globally accurate Maps require a minimum of five years of development. Decisions on what ended up being Apple Maps had to have been made by Jobs himself. Namely, he must have decided whether to buy or build Maps. Contrast with Nokia's decision in 2007 to buy maps for a cost of $8 billion; instead Apple licensed and then decided to build later. In 2007 Jobs decided that it was more important to work on the product itself, meaning the iPhone (while Nokia didn't prioritize product innovation.) The results are visible today: Apple is behind and needs to accelerate with Maps and Nokia with its great maps must find a way of staying in business.

    Apple is not only working on the next product but probably 15 new products, of which 14 will be discarded. Again, I cite Pixar. Each movie is produced with multiple stories, multiple character decisions and different plots in parallel. Much ends up being thrown away. We don't see any of that.

    Apple is extremely "myopic" in that it is very concerned with execution and there is no visible "strategy plan".  That's by design. The product comes first and then comes the market and then comes strategy. To create great products you need to tune out almost everything else. However, they do have a "strategy" and that has to do with which problems they should attack and which they shouldn't. Usually they are successful because what they can attack nobody else can. That is due to their integrated, functional approach.

    5. Isn't Apple, relying too much on semiconductor manufacturers? Meaning, isn't Apple only try to be 'stable company' to supply their products on time? sometimes when companies have disruptive technologies, they have hard time supplying products.

    You're touching on the question of the problems of integration. Yes, there are vulnerabilities but that's the way it has to be. To mitigate this Apple is increasing its integration of the value chains. For example developing its own chip design and owning a lot of capital equipment.

    6. If you were Tim Cook, what would you do?

    I'd buy Intel and turn them into Apple's microprocessor design and manufacturing group. They won't have much to do in a few years and they'll be cheap.

    7. what are the reasons that Apple try to make a 'apple watch', 'apple bicycle'? How do you define these products, since, watchs and bicycles are a total different paradigm which is a totally different industries? Is Apple realizing that smartphone industry is hard for them to innovate?

    Computers are becoming more personal, intimate. It's a natural evolution from large to mini to micro to portable to handheld. I don't see this slowing and Apple should re-define the user experience during every such shift. Here again integration is essential.

    8. what are some of the stuff that we don't know about Tim Cook?

    I can't help you there. Only thing I can say is that people who know him have told me he's not soft and gentle as a manager. He's tough.

    9. How will Samsung and Apples patent fight come to conclusion?

    Again, I can't add much to this. Litigation is often a decision made outside of market conditions so it can be arbitrary.

    10. how does employees or executives inside apple think about their company?

    It's hard to describe this without sounding soft, but the employees at Apple tend to love the brand. You can't measure that but I can think of one proxy: the number of applicants to retail jobs are in the hundreds for each opening.

    [Update: Bono made an important observation regarding Jony Ive which was published after this interview: What the competitors don’t seem to understand is you cannot get people this smart to work this hard just for money. Jony is Obi-Wan. His team are Jedi whose nobility depends on the pursuit of greatness over profit, believing the latter will always follow the former, stubbornly passing up near-term good opportunities to pursue great ones in the distance]

  5. Reasons for iOS outperformance in the US

    Research · 147 comments

    The comScore mobiLens survey for the US ending February 2013 shows continuing rapid expansion of smartphone usage in the US. Even though the 50% penetration threshold was passed seven months earlier, the rate of new smartphone users was second highest ever recorded with over 1 million new-to-smartphones users every week during February.

    Screen Shot 2013-04-05 at 4-5-4.15.52 PM

    Overall penetration increased to 57% with nearly 2% of the population switching in one month. Using the average growth rate for the last six periods, the US could see 80% penetration in another 19 months or by Q3/Q4 2014.

    It remains to be seen if the consistency of growth which was preserved from 20% to 60% is maintained between 60% and 80%, but all indications so far are that it will be.

    The growth in smartphones has been driven by the two dominant platforms: iPhone (iOS) and Android. Together they now make up 91% of the user base with about 40% for iPhone and 51% for Android.

    Screen Shot 2013-04-05 at 4-5-4.19.14 PM

    Android alone gained 17 million users in the last 12 months while iPhone gained 21 million users.

    Screen Shot 2013-04-05 at 4-5-4.20.02 PM

    iOS user gains have out-paced Android for the last four periods which resulted in a decrease in Android share of users. A reduction in Android share was also visible in the spring of last year but the current decline is not only longer but more pronounced.

    Screen Shot 2013-04-05 at 4-5-4.22.13 PM

    The reason iOS is growing more rapidly may be due to three factors:

    1. Broader distribution with three out of four major operators carrying the phone
    2. Availability of three product variants with $0 starting prices.
    3. Increasing awareness and use of apps and content ecosystems due to network effects.

    As distribution is about to increase with T-Mobile being added to the carrier list the growth in iOS share is likely to continue even as the market expands.

  6. Where are the Android users?

    Research · 172 comments

    Google occasionally reports data regarding Android. Very occasionally. The last time we had some data was in September 2012 when we learned that activations were running at 1.3 million per day and that a total of 500 million total activations had taken place.

    As of today, being March 2013, the time between updates has reached five months. It's the longest gap so far. Benedict Evans also notes that it's been five months since the data regarding screen size stats has been updated on the Android developer site.

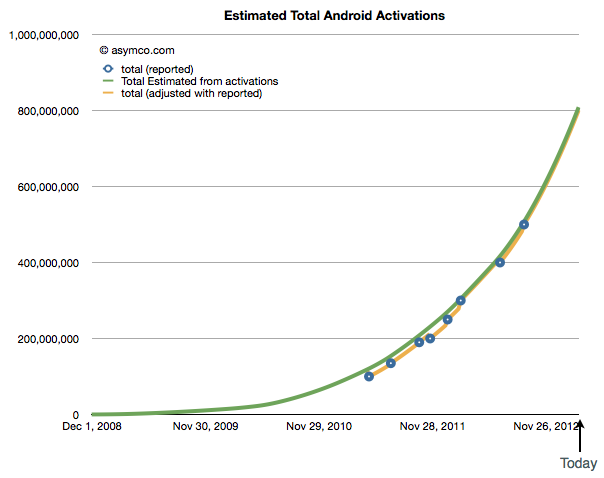
    But we have to live with what we get and, in the absence of an update, the pattern of growth in Android, if sustained, looks like this:

    Screen Shot 2013-03-10 at 3-10-11.05.14 PM

    It implies that 800 million Android activations have taken place to date and the rate is about 2 million per day. One billion activations could thus happen by June.

    There is however another set of data regarding Android which is updated more frequently. The comScore mobiLens survey covers the US and provides updates on a monthly basis. That data shows that Android users in the US reached about 68 million as of the end of January. See the updated data below:

    Screen Shot 2013-03-11 at 3-11-10.26.01 AM

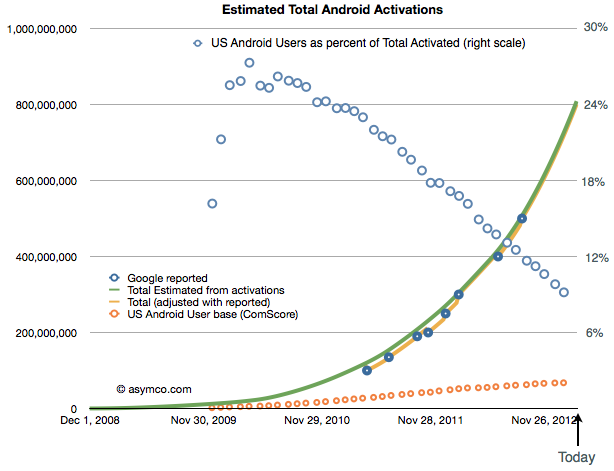
    I included the install base and share of total users as reported. Combining the comScore data with Google's activations gives the following picture of US as a percent of global Android (orange circles represent US base and blue circles the precent of total activations that the US might represent)[1].

    Screen Shot 2013-03-10 at 3-10-11.44.34 PM

    The data implies about 9% of Android usage is in the US. The more startling thing is the difference in growth: it implies that with a US growth rate of only about 13.3k/day, global growth is 150 times faster than US growth. In other words, that 0.6% of new users are in the US and that 99.4% of Android growth is outside the US.

    That's an interesting story. But it's even more interesting that this is not the case with the iPhone. The iPhone is growing considerably faster in the US than Android. One can see this more easily with a graph of the US mobile platform net user gain rate as shown below:

    Screen Shot 2013-03-11 at 3-11-10.32.23 AM


    Looking at the the same contrast between global and US, from Apple's financial reports, in the fourth quarter the global "activation rate" (i.e. sales rate) for iPhone was 525k/day (nearly one quarter of the extrapolated Android rate). The comScore data suggests the US gains are running at 106k/day. Therefore we can calculate that about 20% of iPhone growth is in the US and 80% is outside the US.

    Even accounting for some potential error in the Android estimates, the contrast is quite stunning: 1% vs. 20% share of growth suggests something is very different about the US with respect to the two platforms.

    My suspicion is that it has something to do with the fact that the US is one of the few (but largest) market where the iPhone is available as a "low end" offering. At a minimum price of $0 (with a contract) many consumers are finding the iPhone attractive relative to a $0 (with a contract) Android phone. This price parity (illusory as it may be) allows iPhone to grow even faster than Android in this particular market.

    One wonders what would happen if such price parity were present globally.

    ---

    Notes:

    1. Android activation data as reported by Google includes tablets but excludes many unofficial Android builds e.g. Amazon Kindle and many Chinese phones and tablets that don't register with Google services. comScore data includes only primary devices used by consumers and excludes corporate purchases and devices whose primary users are younger than 13 years.
  7. Measuring the iBook market

    Research · 49 comments

    In June of 2011 Apple announced that 130 million ebooks were sold through iTunes. In October of 2012 it announced that 400 million sold.

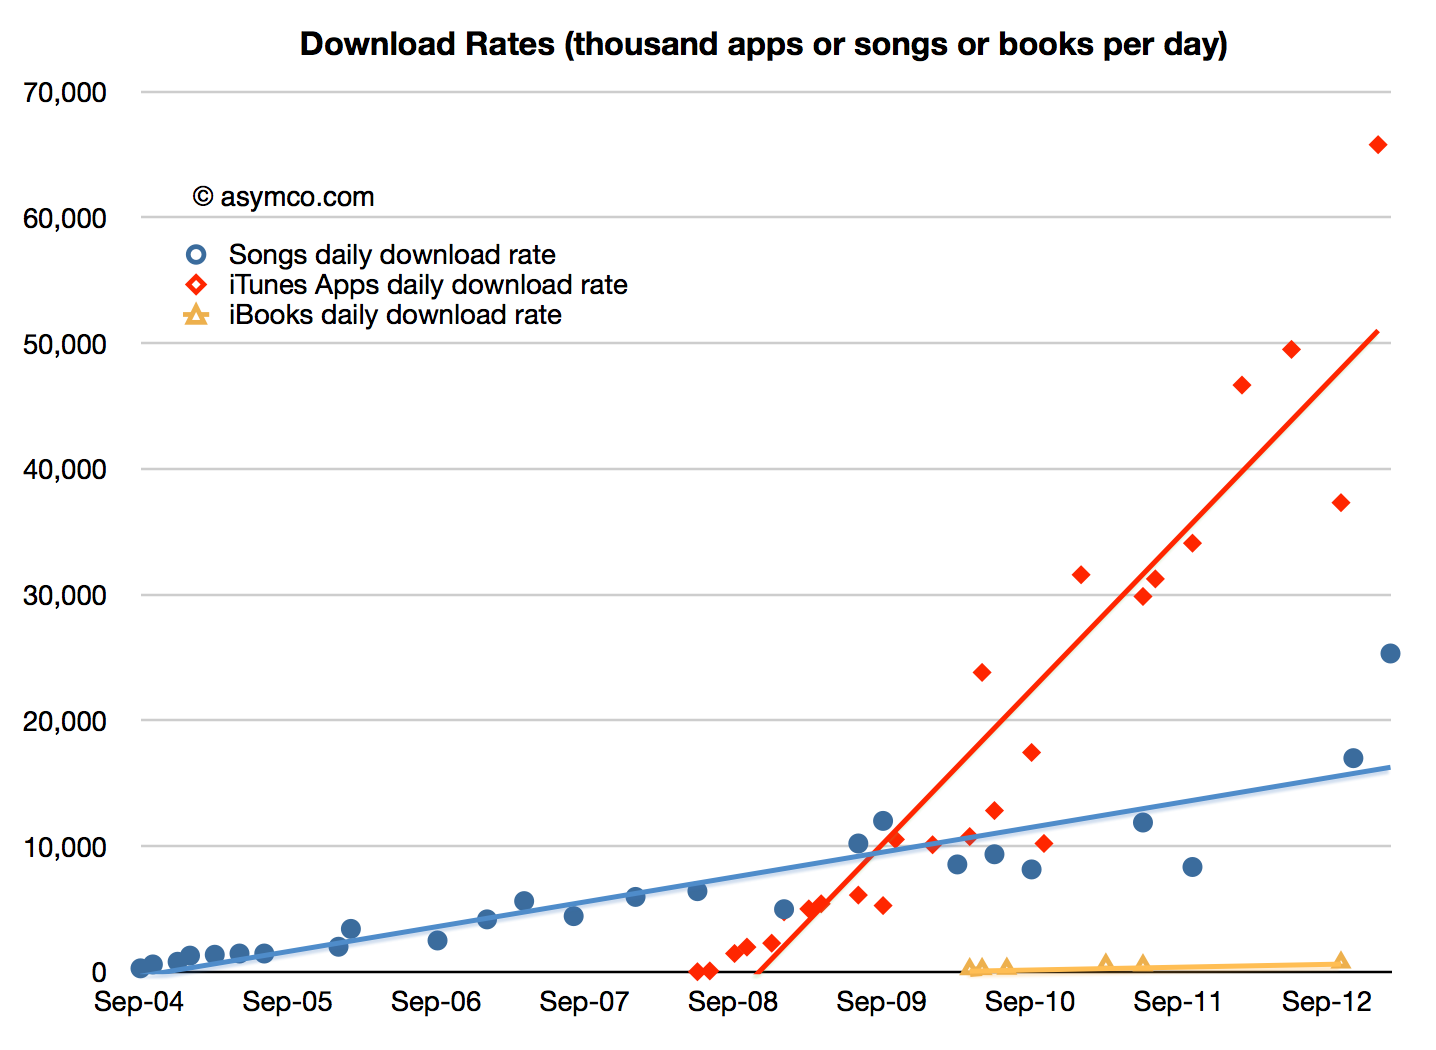
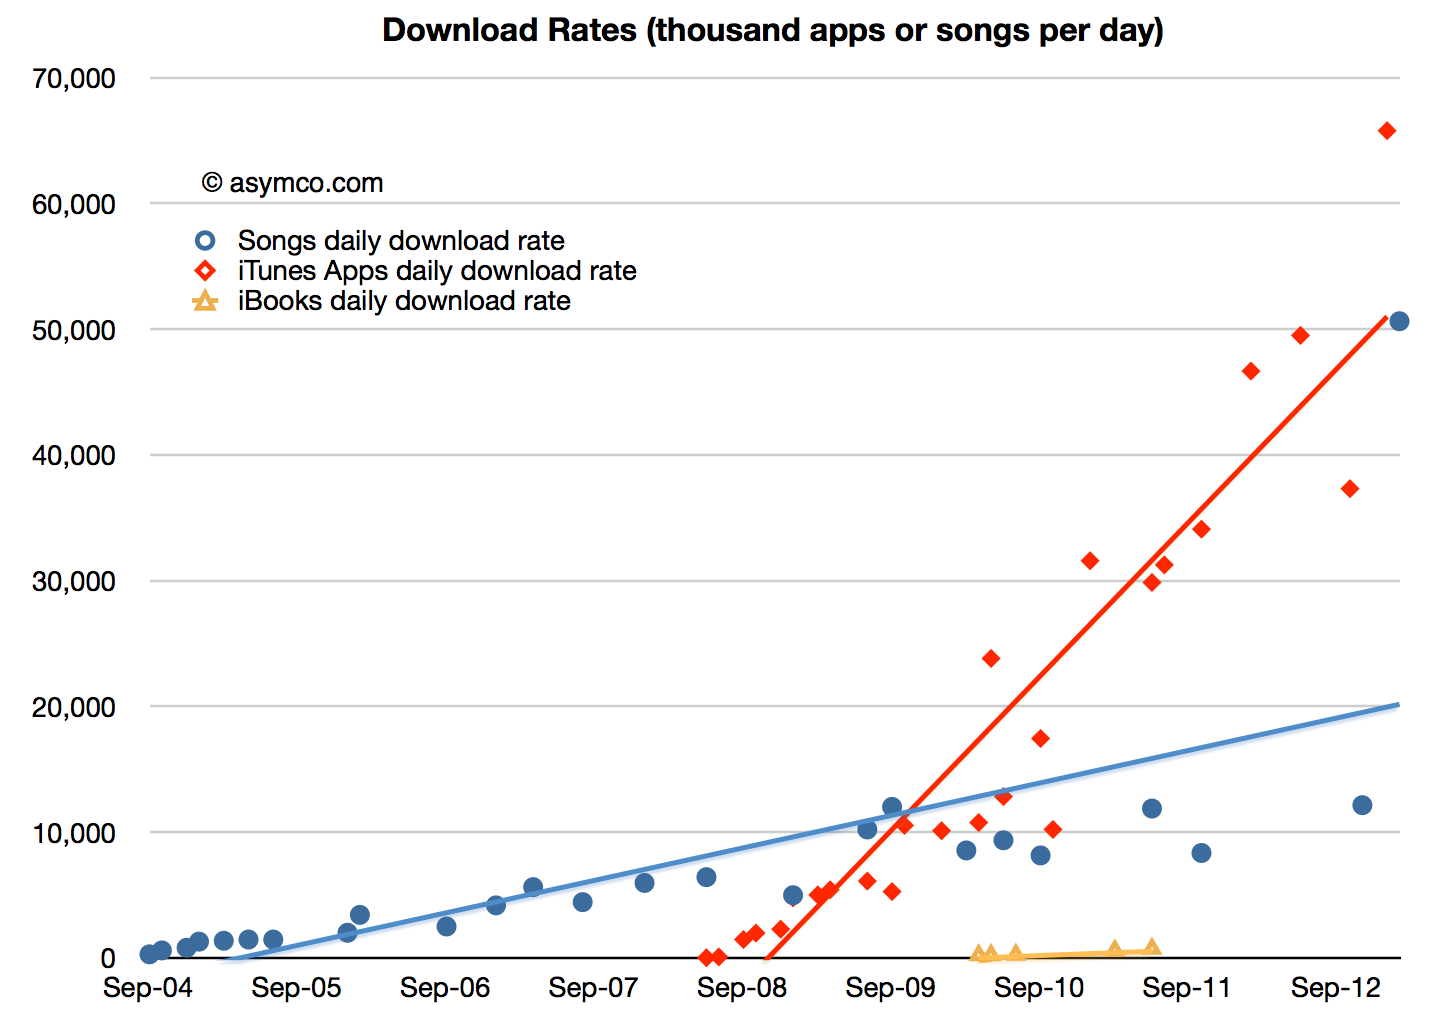
    That means 270 million ebooks were sold in 16 months. Or about 17 million units per month, on average. It also suggests 2012 ebook sales of about 200 million units.[1] The following graph shows the download rate of books relative to apps and songs:

    Screen Shot 2013-02-28 at 2-28-3.09.25 PM

    The download rate looks paltry but we need to remember that Apps have a very low average selling price (about 23 cents including in-app purchases) and that Songs are probably priced around $1.1 on average. In contrast each ebook could be generating about $10 per download.

    However that may be a bit high. We don't know the mix of lower priced and higher priced books. Many best sellers are $13 or $14 but there might be some free books in the mix as well.

    If I choose a more conservative $9 average selling price and assuming a 70% share for the publisher then Apple's iBooks generated about $1.3 billion in payments and grossed about $1.8 billion.

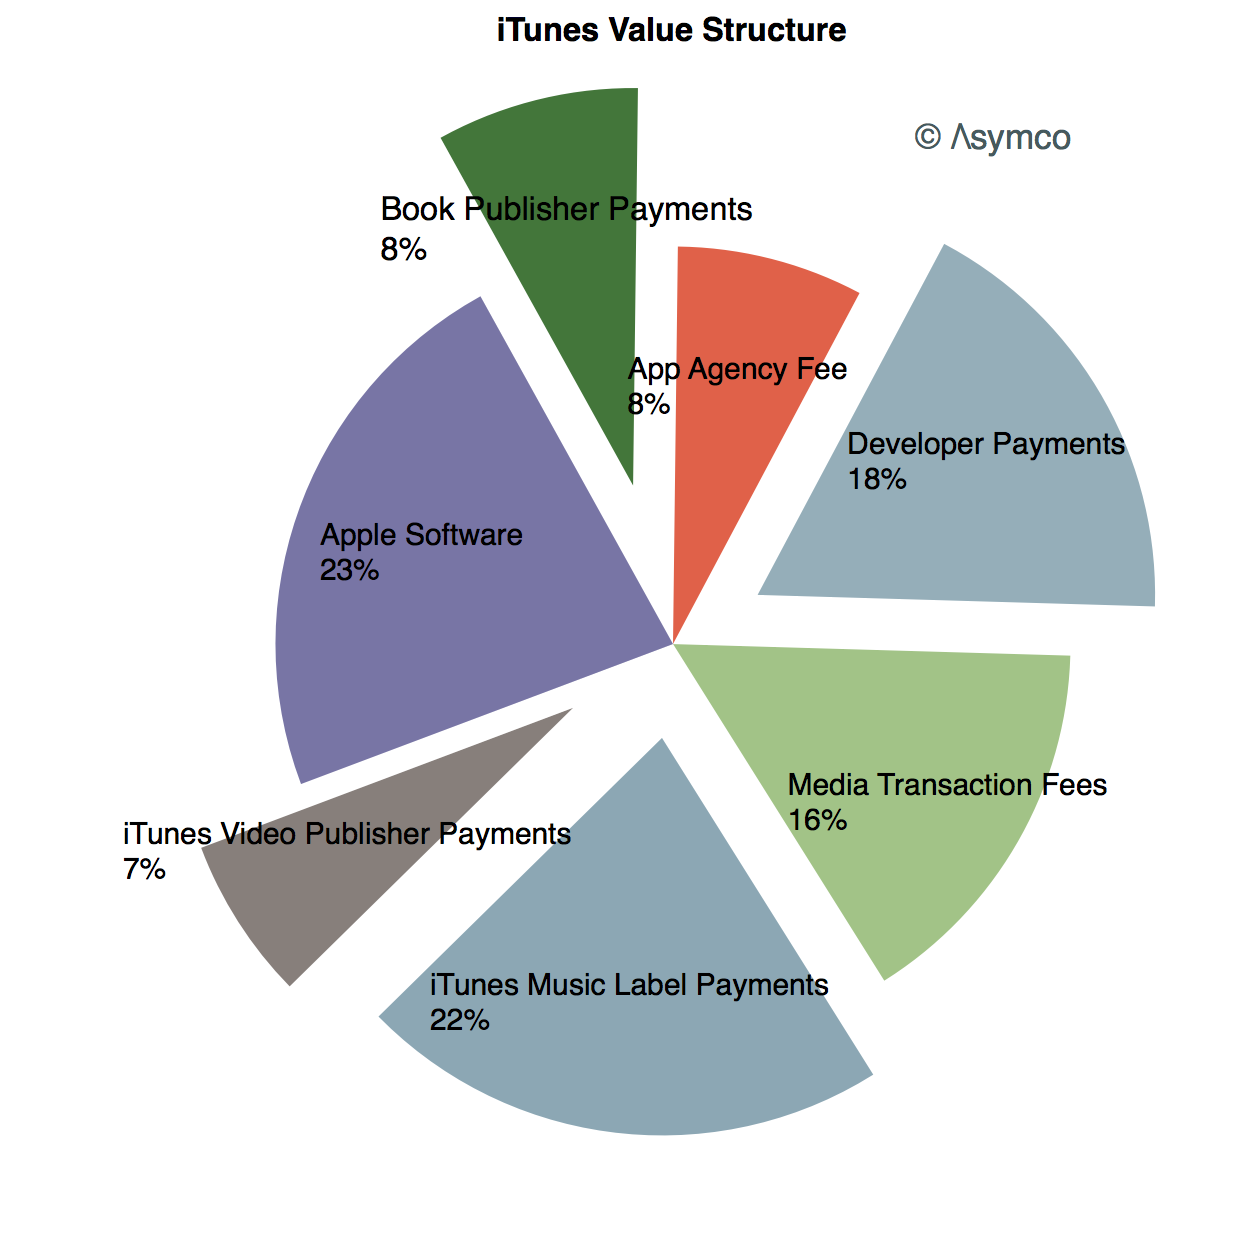
    In the past few posts I measured the iTunes App ecosystem and the Music economy. With the iBook market now measured we can derive the size of the only remaining media type: video.

    Screen Shot 2013-02-28 at 2-28-3.17.57 PM

    ---

    Notes:

    1. I've seen one estimate that world-wide ebook unit sales reached 860 million implying Apple's share was about 24%.
  8. Right on Cue

    Research · 27 comments

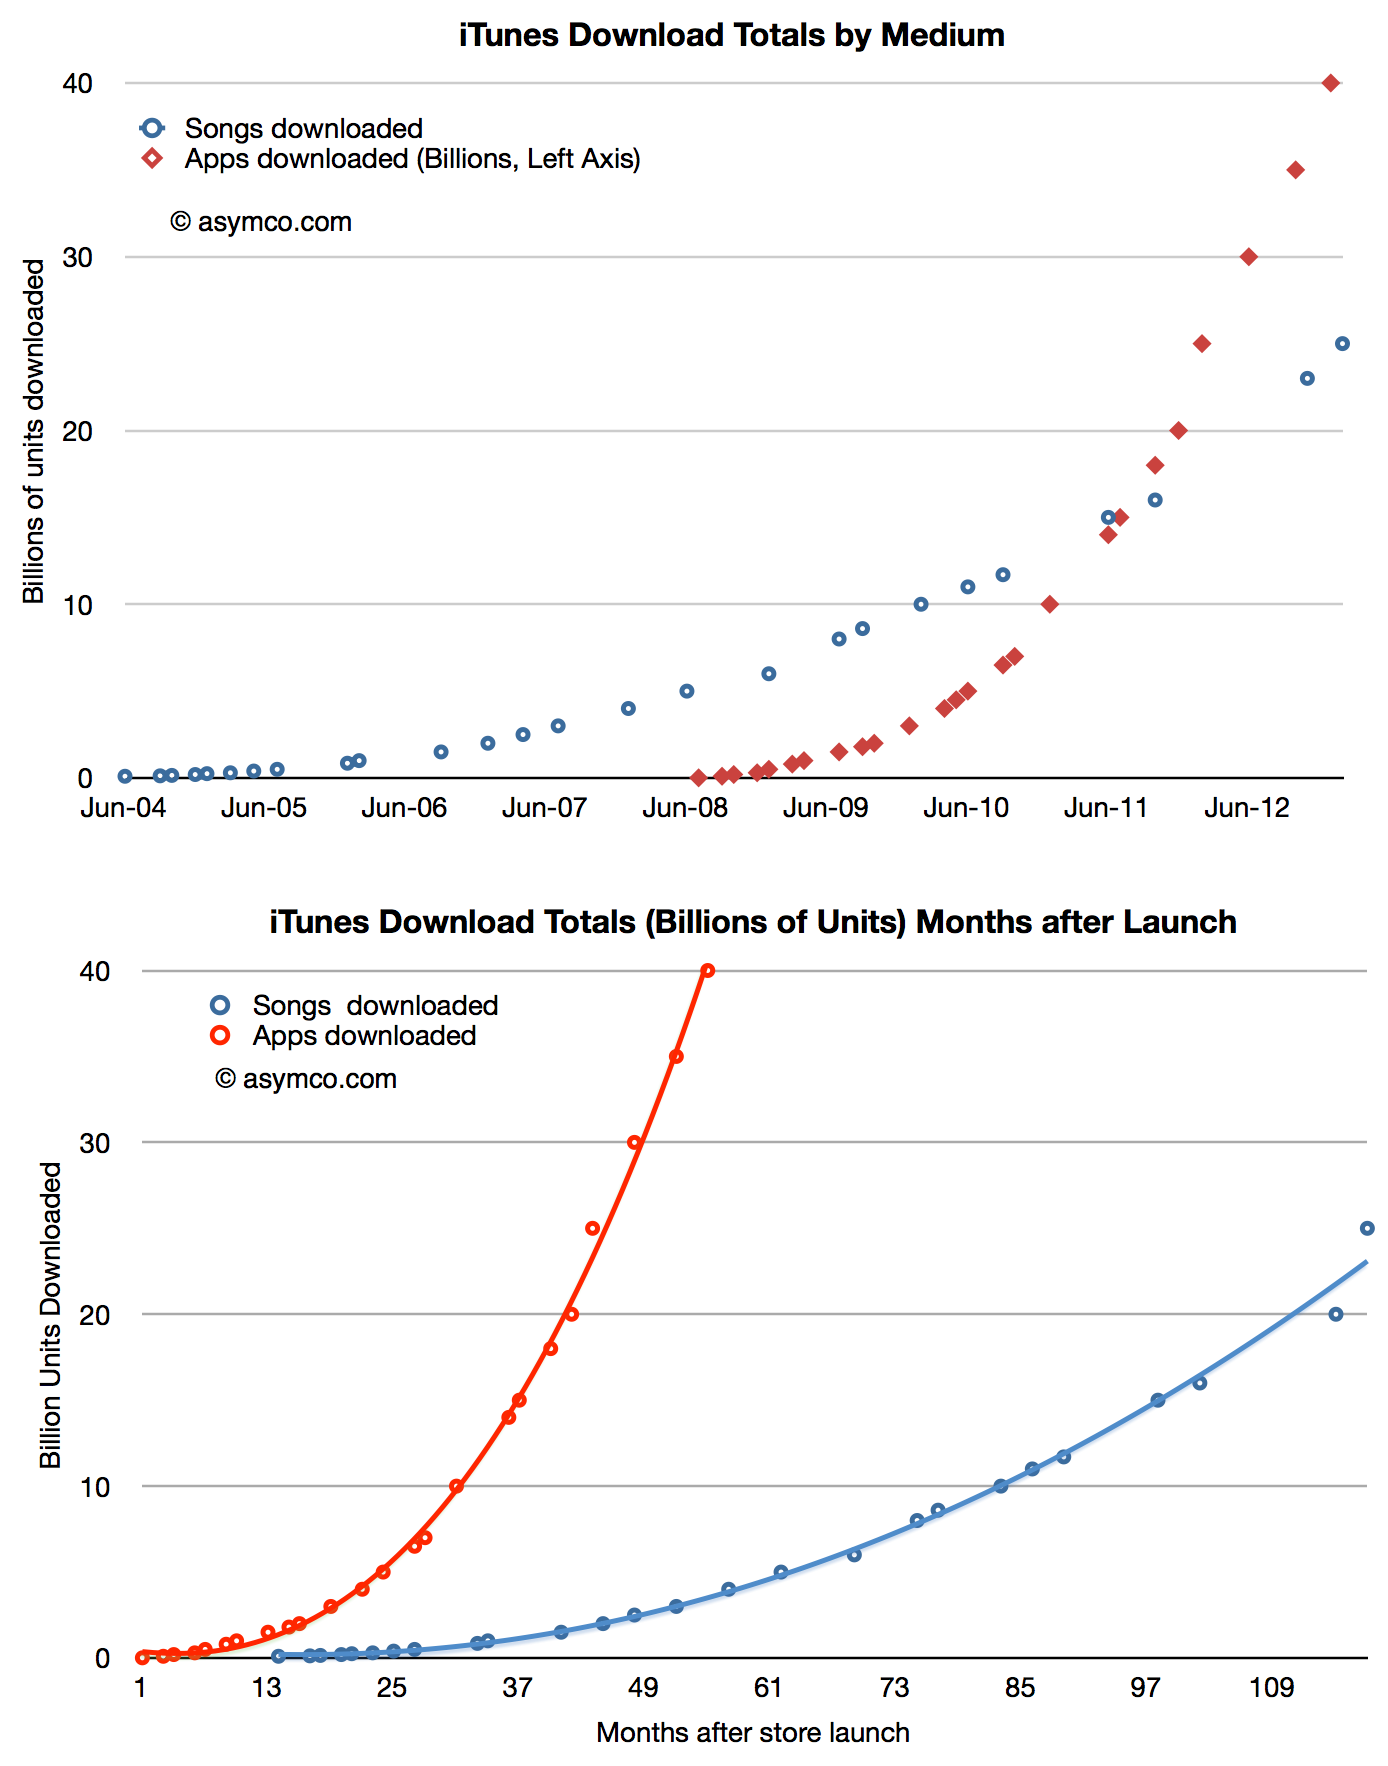
    On February 6th, 2013 Apple reported that a total of 25 billion songs had been downloaded from its iTunes music store. The previous definitive value was in October 2011 though there was mention of "more than 20 billion" in November. App download totals have recently been much more frequently updated as the following chart shows:

    Screen Shot 2013-02-12 at 2-12-2.17.06 PM

    [I estimated 21 billion for the November total.]

    The latest two data points point to a surge in iTunes song download rates. Prior to last fall the download rate seemed to be hovering around 10 million songs per day.

    Screen Shot 2013-02-12 at 2-12-2.20.10 PM

    The new data implies that the rate may be now perhaps 20 million per day however I would be cautious about this estimate given the latest point being such an outlier. One reason for the surge might be the opening of new stores in previously unserved countries. Another could be the usual post-holiday surge driven by gift cards.

    Given this data, it would be interesting to calculate the share of overall music downloads that iTunes has been able to secure.

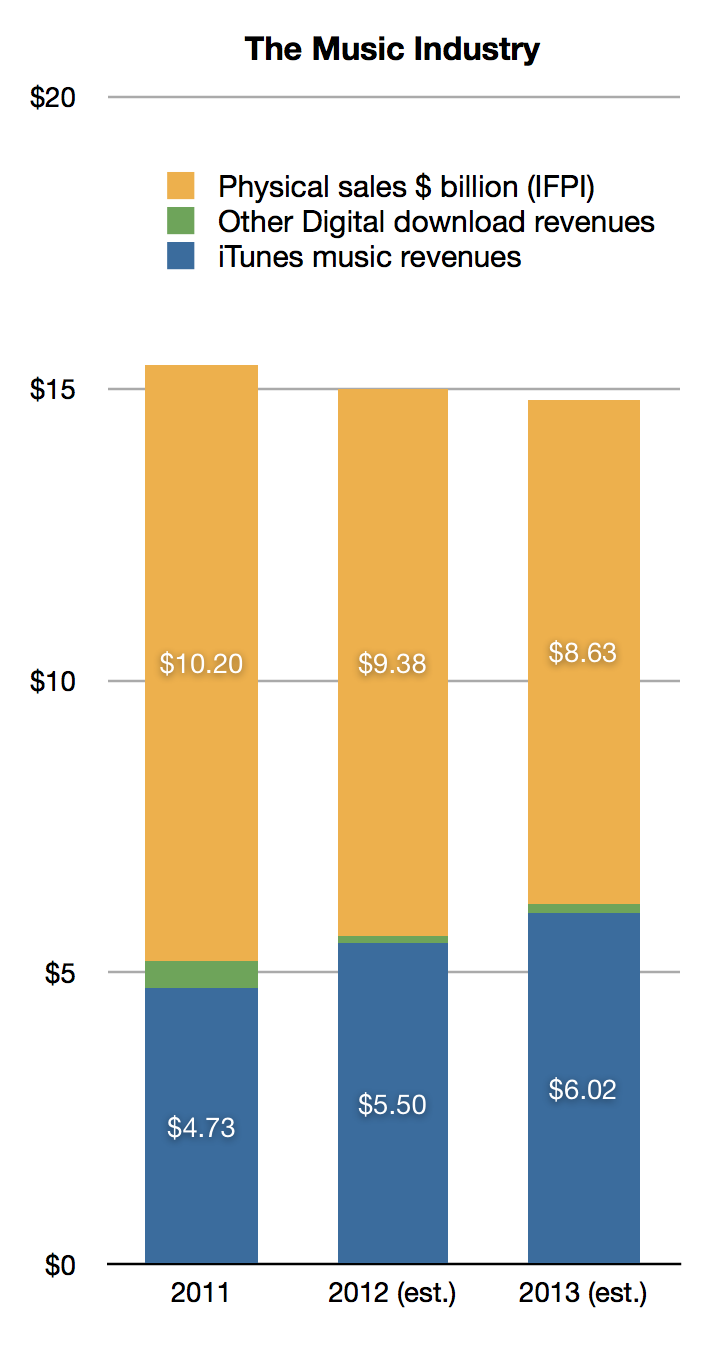
    Based on the samples offered by Apple, and the data from International Federation of the Phonographic Industry (IFPI) we can estimate that in 2011 iTunes captured 90% of digital music revenues and 31% of the total music industry. (I estimate iTunes was responsible for about 4.3 billion downloads and I applied a price per download of $1.1).

    Looking to 2012, applying a growth rate of 8% to digital sales (same as that of 2011) and an 8% decline in the physical business (vs. 8.7% decline for 2011) we get 98% iTunes share for digital and 37% share for all music. (I estimate that iTunes was responsible for about 5 billion downloads and I applied a price per download of $1.1).

    Therefore it seems reasonable to estimate that Apple will reach 97% share for iTunes music in 2013. That assumes a 10% growth in the music download business and translates into 5.5 billion downloads or about 15 million songs per day. That's well within the trajectory seen above.

    These data result in the following market overview:

    Screen Shot 2013-02-12 at 2-12-2.21.25 PM
  9. The iPhone Addressable Market

    Research · 125 comments

    The iPhone is a severely constrained product. We're used to thinking that it's production constrained—and it is, but it's also distribution constrained. It has a business model that is almost completely dependent on operator subsidy. Few end users pay the $650 average price that Apple obtains and that price point has held for a remarkably long time. This price point is largely invisible to the user.

    In this regard it's very different from all the other products Apple sells. Historically, the company has preferred having its customers to also be its users and maintained a direct relationship with them, strengthening that relationship through its own retail channel for the last decade. Pricing is used by Apple as a signal to clearly illustrate value to the user and pricing is part of the communication about the product that Apple makes very explicit. This has been true for the iPod and Mac and is still true of the iPad. But this is not so for the iPhone. The entire marketing strategy for the iPhone (and hence the entire product concept itself) is "off message".

    Why is this?

    Before we get into causes, let's try to measure the distribution channel for the iPhone. Apple occasionally reports the total number of carriers it has relationships with. The last update was in the summer when Peter Oppenheimer, Apple CFO discussed the quarter ending June:

    We added several small regional carriers during the quarter and now have iPhone distribution through over 250 carriers in over 100 countries.…

    We added China Telecom as the second [Chinese] carrier in March…

    We also don’t expect to add any significant new country or carrier additions in the September quarter…

    In addition, Apple publishes the list of operators it sells through on its web site. The last time I counted I got 227 listed operators.

    If we contrast this with the total number of global operators (excluding MVNOs) there might be a way to measure distribution penetration. I compiled a list of all such operators based on information available in Wikipedia. You can browse the list here (Google Docs [1]).

    This global list includes 802 operators. The list is not current, being mostly based on 2009 data but it's pretty close. I've read that a more recent (non-public) estimate is 816.

    By this measure we can say that Apple has distribution through about 30% of the total operators. Consider also that RIM reports that it sells BlackBerry through 565 wireless carriers in over 175 countries. By this metric alone BlackBerry has twice the addressable market of the iPhone.

    But we can do better than counting operators. We should account for the fact that some operators have more subscribers than others.

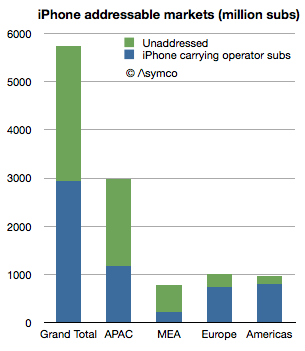
    Using the same database, I measured the subscriber count of iPhone distributing carriers vs. overall subscriber count. The ratio was about 50%.

    iPhone "addresses" about 2.8 billion connections whereas there are about 5.7 billion available connections. Note that this is not users but subscriptions—essentially SIM cards.

    The ratios vary by region:

    • Middle-east/Africa has 29%
    • Asia/Pacific is at 39%
    • Europe 73%
    • The Americas 83%


    We can take it a step further and identify which countries hold the highest opportunity for iPhone distribution. The top 5 are:

    1. India: 658 million
    2. China: 622 million
    3. Pakistan: 116 million
    4. Russia: 102 million
    5. Nigeria: 89 million

    But the opportunity is not only in emerging markets. Japan is a 69 million subs opportunity and even the US has 80 million subs without direct (i.e. subsidized) access to the iPhone.

    So we can now return to the question of why the iPhone is sold the way it is.

    First I should point out that the addressable market of Samsung or Android in general is larger than that of the iPhone. Samsung has relationships with far more operators, at least on the scale of RIM or Nokia, perhaps even more. It might be safe to assume that Android is completely unconstrained in distribution and therefore its addressable market is the entire subscriber space (meaning that Android has twice the addressable market of the iPhone.) For Apple to compete on the basis of volume or market share it would make sense to broaden this network. So what's holding it back?

    I think the answer is the other constraint mentioned: production. The company is still iterating the product on a yearly basis and needs to ramp production to reach all its carrier partners in a timely fashion. The carriers use the iPhone as differentiation and a way to uplift their core business. Therefore they want the latest version as quickly as possible. To satisfy this, Apple needs to manufacture the latest variant very quickly. But that's not easy. Peak production is one thing but getting there quickly is another. This is the problem which Apple's vast capital expenditures is trying to solve.

    So far the production capacity has been increasing at nearly 100% per annum. This is an astonishing achievement but it's still not enough. The product is supply constrained during much of the launch quarter. Therefore, to summarize, the entire business model for the iPhone revolves around this question:

    Can enough units be shipped in a sufficiently short time frame to allow a limited (but large) subset of operators to create competitive advantage which sustains a generous up-front subsidy.

    At this time the answer seems to be that the model can work for about 30% of operators serving 50% of subscribers. The crucial question for the business is how much higher can these numbers get?

    Note that this is not a debate about market share or consumer preference but about delivering a particular value proposition to network operators, (which sustains a premium price point.) The iPhone is built around this business model and to alter it would alter the very essence of what the product is. The addressable market is one piece of the product but it interconnects with the price, margin, design, production and breadth of offering. You cannot change one without changing the others. It's a product whose distribution model is part and parcel of its design.

    I believe that the particular way this product translates into a business is very rigid, which is why it has not changed much during the life of the product. This is in contrast to Apple's other products which exhibit more market flexibility. Inter-dependency is not a new concept for Apple products (e.g. iPod/iTunes, Mac/MacOS) but the iPhone shows a level of inter-dependency with distribution and production the likes of which has never been seen.

    This topic will be further discussed at Asymconf in January as the fourth quarter data will then be available and there will be an opportunity to debate it live with an august audience.

    ---

    Notes:

    1. The database is neither current nor complete. If you would like to help maintain the data based on local (public) information, please get in touch and I can grant access to edit it.
  10. On not being boring: A dramatic reading of Apple's share price

    Research · 128 comments

    Apple's renaissance began with the iPod. This was not evident right away however. The product was unveiled on October 23, 2001 at a time when Apple's share price had just fallen 70% from year-earlier levels. It was perhaps a good point from which one could expect a recovery to begin.

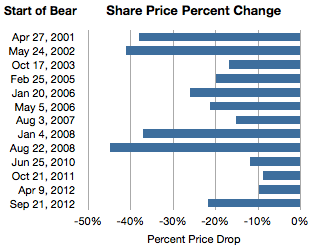
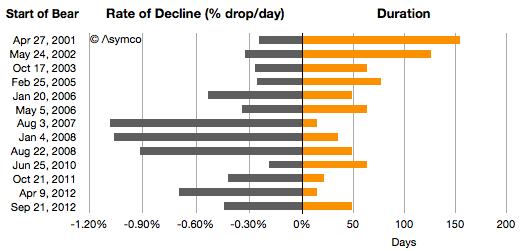
    It was not to be. One year after the iPod's launch the stock price had fallen another 20%. Indeed during 2001 the company was in the throes of a "bear market" in its shares. If we measure a time of persistent share price reduction as a bear market, then the one in 2001 was significant. For 154 days, between April 27 and September 28, 2001 the shares fell 38%. This represents the first bar in the following graph showing all the Apple bear markets since then.

    I also illustrated these bear markets in terms of their duration and the average %drop/day.

    Chronicling these periods:

    • From May 24th 2002 and September 27th, 2002 the stock fell 41%.
    • 2003 was less harsh but on the second anniversary of the iPod, for two months between October 17th 2003 and December 19, 2003 the stock fell another 17%.
    • By 2004 the iPod looked like a hit. The stock rose consistently during the year. Then, in early in 2005, from February 25th to May 13, the stock fell 20%.
    • In early 2006, January 20th to March 10th, the stock dropped 26%. The iPod was reaching incredible levels of popularity and the Mac was looking to be returning to prominence with the switch to Intel.
    • 2007 was the year the iPhone launched. Right after the launch for two weeks between August 3rd and August 17th, the stock fell 15%. That's the equivalent of 1% per day for two weeks.
    • As the iPhone was shown to be a hit (and before the credit crunch), for four weeks during January 2008 the stock fell 37%. Again, equivalent to 1% a day for 35 days.
    • Then after the iPhone 3G was launched and growth reached triple digits, Apple's shares fell for 50 days. From August 22 to October 10th they fell a total of 45%. Again, the equivalent rate was 1% every day for a month and a half.
    • In 2009 the stock recovered steadily but in 2010, again around iPhone launch season the stock fell 12% over a two month period.
    • Then in 2011 October, 9% was wiped out.
    • Then for two weeks in April 2012 10% disappeared.
    • Which brings us to September 21 to November 9th, 2012. This latest "bear market" has run up a loss of 21.7%, running for 49 days.

    Sounds dramatic. The even more dramatic twist is that in this same time frame the share price increased by 576 points or the equivalent of 6,294%. Nevertheless, there were 13 episodes when the shares dropped violently and sometimes persistently for long periods.

    Why does this happen?

    It's important to recall that at no point during Apple's ascent was there "consensus"  that Apple was being successful and certainly not sustainably so. Analysts gave it at best a growth prospect of 20%, and the risks were always obvious and prominent.  The company was always on the edge and everybody from the layperson to the experts could see that everything was wrong with Apple. Apple went from being irrelevant to being too big without passing through being boring.

    So there is a simple explanation for occasional panic: Apple is not predictable.

    But it also seems too consistent. Is the pattern of share price collapse actually rooted in some fundamentals, transient or otherwise? There is a clear failure in understanding the long term but were these downdrafts justified as the market "foresaw" or "discounted" the near future? Were these more than just crises of confidence? Was there wisdom in the drops because they were followed by earnings drops or slowing growth? In other words, if there was smoke, was there fire? Was the market being efficient?

    No.

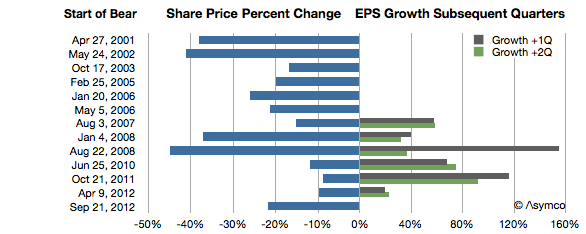
    The graph below shows the share price change in the more recent episodes above and the earnings growth during the current and following quarters.

    At least since the iPhone launched, every dramatic drop in share price was followed by a surge in earnings growth. One could even say the worse the bear, the better the growth.

    Sounds completely counter-intuitive, but there is some perverse logic in this as well. The market reflects crises (as well as over-abundance) of confidence. Unforeseen growth is what creates wealth and the crisis in confidence is a reflection of the improbability of continuing out-performance. When Apple's performance is foreseeable the stock moves slowly upward. When its performance is unforeseeable the stock moves dramatically downward.

    A pithy way of putting it is: No news is good news. Good news is bad news.

    When a product is understood the stock is mildly desirable. When a new product appears the future is hazy and the stock is undesirable. But that haziness hides potential but up and down. New products is what innovators produce. Bizarre new products is what disruptors produce.

    In other words, the paradoxical observation in the chart above of "the more drama in the market, the more success in the marketplace" makes sense when inverted.

    For disruptive companies, it should be "the more success in the marketplace, the more drama in the market."

    In that sense the current downdraft may be quite auspicious.
    ---
    Notes:

    1. Another set of similar observations were made by Eric Jackson in early October in Forbes.
  11. The late smartphone adopter paradox

    Research · 70 comments

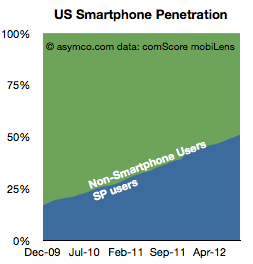
    comScore reports that US smartphone penetration has decisively crossed over 50% in August. This should not come as a surprise as the penetration rate has been very linear.

    Now that we've crossed this milestone, the thing to watch is the conversion rate from smartphone non-consumption to smartphone consumption.

    The reason is that we don't know what "saturation" means in smartphones. We can assume it's at least 80% as about 80% of new phones being purchased are smartphones. What we don't know is how much above 80% it can be. It could  be 100% if feature phones simply stop being made but we can't be sure if there will be latent demand and how long this will last (similar to the market for black-and-white TVs after Color became commonplace).

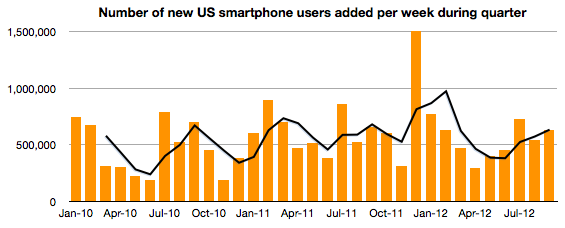
    To help keep an eye on this measure, the following graph shows the rate at which non-smart to smart conversion is happening.

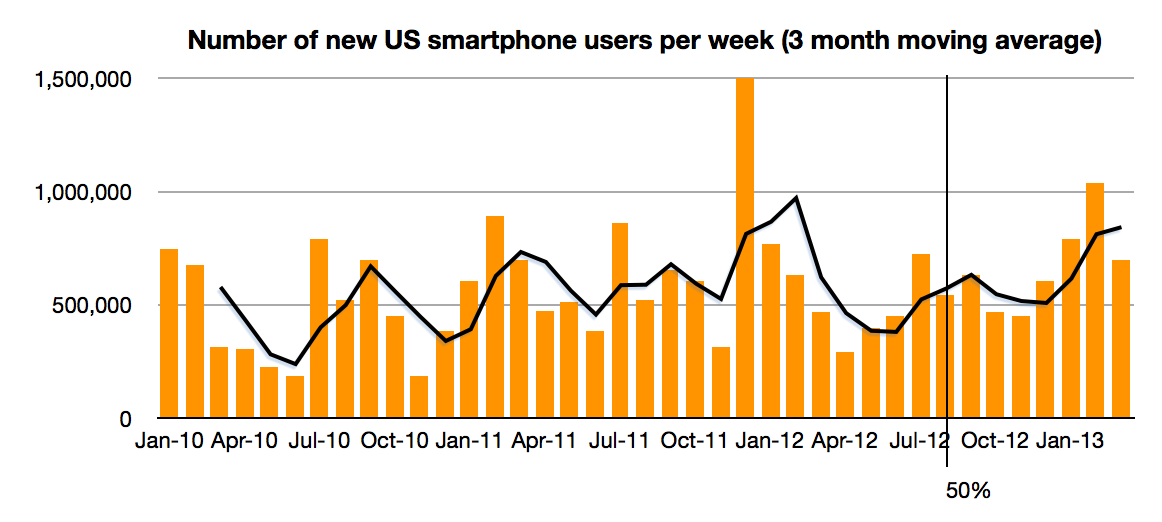
    It measures the addition of new (to smart) subs each week in a particular measurement period (three months ending the month shown on the x-axis). There is also a 3 period moving average shown as a line. Keep in mind that this shows net new users and therefore excludes smartphone switchers. It's a good measure of how rapidly non-consumers are being converted to consumers.

    The data shows that there are as many first time smartphone adoptions in late 2012 as there were in late 2010. Or, the new-to-smart users are joining ecosystems just as quickly when penetration is 50% as when it was 20%. An encouraging situation when considering the opportunity space above 50%. The "S-curve" has not reached an inflection point.

    If you're thinking about growth, so far so good. There is however one surprise in the data.

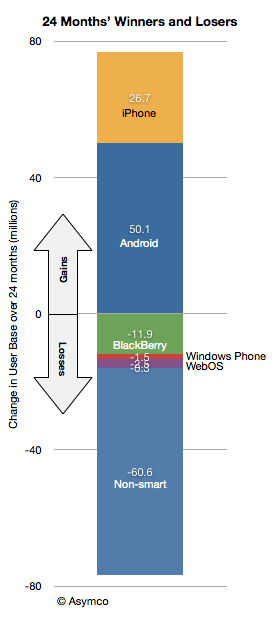
    All the growth in the last 24 months (between 2010 and present) was due to Android and iOS. Android added 50 million and iOS added 26 million in the last 24 months. The net smartphone user additions were about 60 million (RIM lost about 12 million, Windows lost 1.5 million and others lost 2.6 million). Android therefore has gained twice as many users as iOS has in this two-year period. Put another way, Android captured 70% of the growth and iOS captured 30% of the growth.

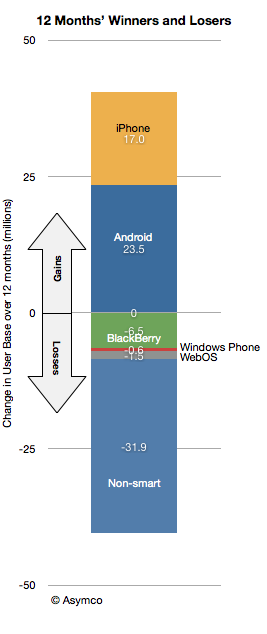
    However, if we look at the last 12 months, the split is 23.5 million for Android and 17.0 million for iOS. Android gained 58% of the growth and Apple captured 42%--a change in "spread" from 40 points to 16 in favor of Android.

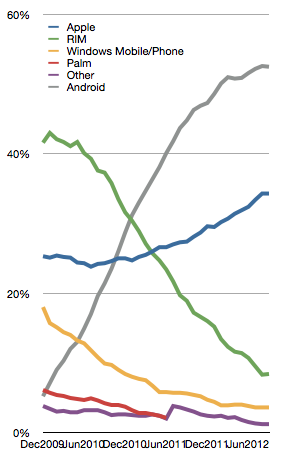
    The evidence also shows itself in the trajectory of platform market shares of installed base.

    In the last six months, Android share growth is slowing while iOS is still gaining.

    If this trend continues then the next 50% may not behave as one might expect (namely that late adopters would take the low-cost commodity offering accelerating Android adoption.) Late adopters may, in fact, be choosier than early adopters. And it's not at the cost of overall growth. Late adopters are still converting at the same rate of the early adopters.

    Therefore, paradoxically, the late market shows that the prospect for iOS growth seems strong. Furthermore, as we do reach saturation, perhaps in another three years, the secular growth may end in the US but the loyalty of iOS usage may give iOS another advantage in a market where growth is determined by "platform churn"

    The US is the crucible of the phone market in many ways so what happens in the US may be a harbinger for what happens world-wide.