Asymco

Asymmetric Intelligence

share

  1. Nokia's price for exclusivity

    Research · 47 comments

    Days after Nokia announced the end of life for the Symbian platform I wrote a post titled Who will buy the next 150 million Symbian smartphones? The reference was to claim by management that before there would be a complete transition to Windows Phone, 150 million legacy Symbian phones would be sold, keeping the company financially stable before the new ecosystem took root.

    I reproduce the original forecast I made below with the addition of what actually happened.
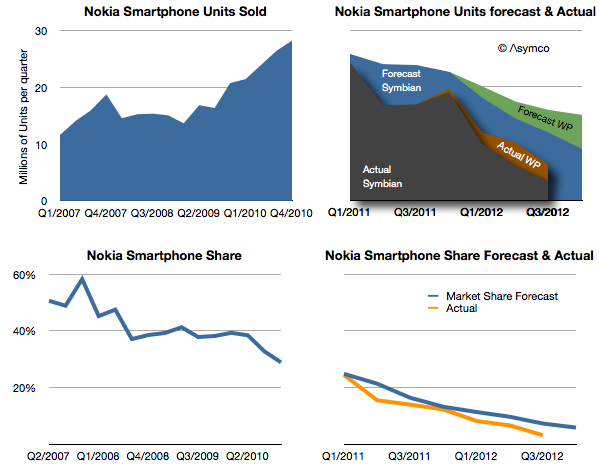
    [Note that the Actual stack area chart is independent of the forecast area chart as indicated by shading.]

    My forecast in early 2011 was based on the 150 million Symbian phones being sold over a two year transition period. The implication with the forecast for Windows Phone was that this would still lead to a difficult contraction of volumes.

    As it turns out, only 96 million Symbian devices have been sold in the 7 quarters since the platform was deprecated. It's unlikely that there will be ever by 150 million units sold as last quarter only 3.4 million shipped. In any case, management has already retracted that claim.

    What about the Windows Phone forecast? It turns out that by this point in time (Q3 2012) I had expected Lumia shipments to total 9 million. Actual shipments reached about 9.5 million, so not bad. However, the market grew faster than I had expected and overall Nokia smartphone market share turned out to be slightly lower (6.3% in Q2 vs. 10% estimated.)

    The just ended quarter shares are not yet available but it's quite possible that overall Nokia smartphones could be well below 5%, and may slip to 3% during the transition period.

    My warning in February 2012 was that 150 million Symbian units would not ship since I expected there would be a stigma associated with the products among distributors, even if consumers were fine with them (which they weren't).

    The public execution of Symbian (and any other alternative being developed inside Nokia) will probably be a classic case study in disruption management. To wit: even if a platform needs to be led out to pasture, there are ways of managing decline other than suicide. Nokia's failure is not so much having chosen the wrong alternative to Symbian, but having chosen exclusively.

    However, there's a twist. The company did not accept exclusivity of one supplier without a concession: In exchange for exclusivity, Nokia negotiated $250 million every quarter in the form of "platform support payments" from Microsoft. Nokia has to date received over $1 billion in such payments. (For the last quarter that amounts to $86 for each Lumia phone shipped.)

    The tragedy comes from this $1 billion/yr not being enough. The foregone revenues from Symbian (assuming they had been able to maintain the decline to the level of 150 million units that they had originally forecast) would be about $9 billion. This means that had Nokia not knifed Symbian and had sold the shortfall units at an average price of $200 they would have received an additional $9 billion in sales. Furthermore, assuming a margin of 33% for those units, Nokia received from Microsoft one third from of what she gave up for exclusivity.

    In other words, the net cost of the Microsoft exclusive relationship is at least $2 billion in operating profit.

    This turns out to be the difference between being profitable and being distressed.

    We will never know if this scenario would have ever happened, but the forecast management made 21 months ago suggests that at least they thought this was what they were going to get out of the bargain.

    This reminds me of another article posted around the same time.
  2. What is Apple's Realized P/E ratio?

    Research · 78 comments

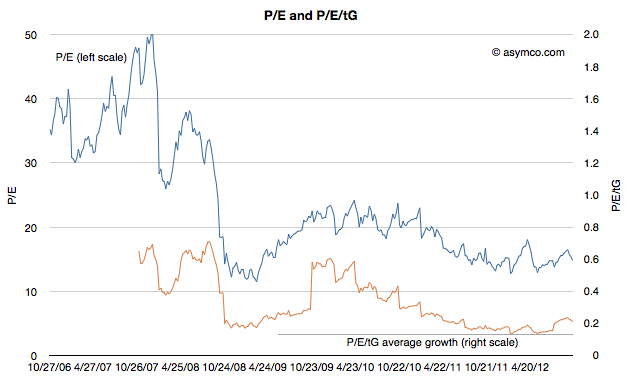
    The Price/Earnings ratio is a very simple measure of the "value" a company has. The Price is the current share price and the Earnings is usually the sum of the last 12 months' earnings per share. In other words it measures how many of the last year's earnings are built into the share price. Put yet another way it's the answer to the question "If earnings don't change, how many years will I have to wait before I'm paid back for my share purchase with retained earnings."

    So a company with a P/E of 10 implies that if nothing changes, in 10 years a share owner would "earn" back the price they paid for the share. Any earnings after 10 years would be "profit" for the share owner. You can imagine it even more simply as buying not shares but an actual small business of your own. You pay up front for it and then wait until it pays you back. After getting paid back for the initial purchase you then make money that you can set aside.

    Obviously this figure of P/E is very sensitive to growth in earnings. Consider paying $100 for a share of a company having just earned $10/share last year. It would have a P/E of 10. If earnings stayed at $10/yr for 10 years, you'd "get your money back" in 10 years. However if earnings grow at 20% then next year the earnings would be $12 then 14.4 then 17.3 then 20.7 etc. Adding these up means you'd get your $100 back in five years, not 10.

    So with a company growing at 20% the "realized P/E" is 5. You realized the price of $100 in five years' worth of earnings. In the scenario above you paid expecting to wait 10 years but you got paid in five. If that's your retirement plan then you can retire five years early. Not bad.

    Let's then look at what Apple gave investors as "realized P/E."

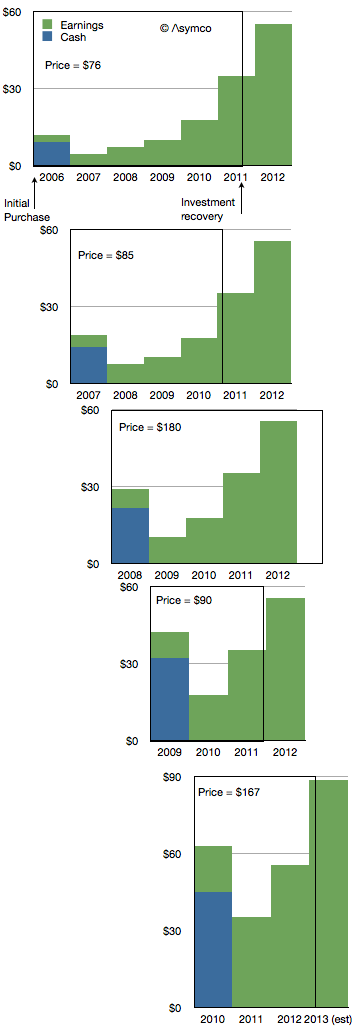
    If you bought shares in the first Friday of 2006 you would have paid $76.3/share. At the time the company had $9.36 in cash so you actually paid $66.94 for any future earnings. The P/E ratio at the time was around 35.

    The company went on to earn $2.78 in 2006. Another $4.63 in 2007,  $7.47 in 2008 and 10.24 in 2009 and 17.91 in 2010. Then in 2011 it earned $35.11.

    If you add these values up you realize that Apple reached your price about two thirds of the way into 2011. So the company earned your purchase price in 5.7 years. That becomes the realized P/E if you bought in early 2006. The following diagram shows the time period as a box encompassing the earnings (and cash) for a share purchase in early 2006.

    I repeated this for purchase in early 2007. The result is a Realized P/E of 4.9. I did it for 2008 as well[1] and got 5.4 then 2009 yielded an astonishing 2.9. 2010 was not much different with 3.2.

    Investing in Apple between 2006 to 2010 meant obtaining a payback period of less than 4.5 years, on average. In other words, regardless of what the trailing or forward P/Es getting quoted at the time (trailing is illustrated below), buyers actually paid for only about 4.5 years of earnings. In other words they actually bought Apple for a P/E of about 4.5.

    Using our small business analogy, buying Apple in the past few years has meant getting paid back in less than five years. That makes it a very low risk opportunity.

    I could try to repeat the process for years 2010 onward but it would require making forecasts beyond 2013, something I leave as an exercise to the reader.

    ---

    Notes:

    1. I had to make assumptions about full year 2012 and 2013 earnings. I used $55.4 earnings for full calendar year 2012 and 60% growth for 2013.
  3. Using Capital Expenditures to predict Apple's share price

    Research · 96 comments

    It takes money to make money. That's a cliché. But it's also true. The interesting question is how much can be gained from how little.

    In previous articles I explained how Apple's expenditures of capital for equipment used in manufacturing affects their output of products. The relationship between capital in and product out should stand to reason.

    The more surprising aspect of that analysis is that we get to know in advance how much Apple spends (since they tell us their budget a year before it's spent.) and therefore it becomes possible to get a rough idea of how much they will produce. And since demand has generally been higher than supply we can get an estimate of how much Apple will sell.

    The only missing piece to this logic chain is to estimate how much will shareholders benefit from the capital expenditure. I'll try to establish the relationship through a build-out of graphs.

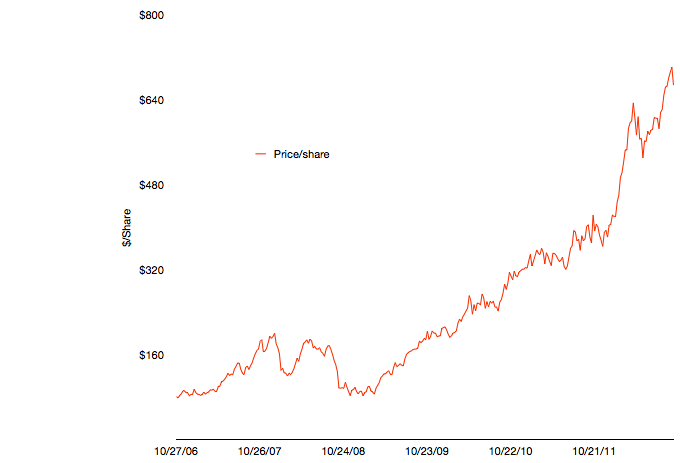
    The first graph shows Apple's share price at weekly resolution.

    The time frame stretches back six fiscal years. The time span includes some dramatic periods including the financial crisis and the launch of the iPhone and iPad.

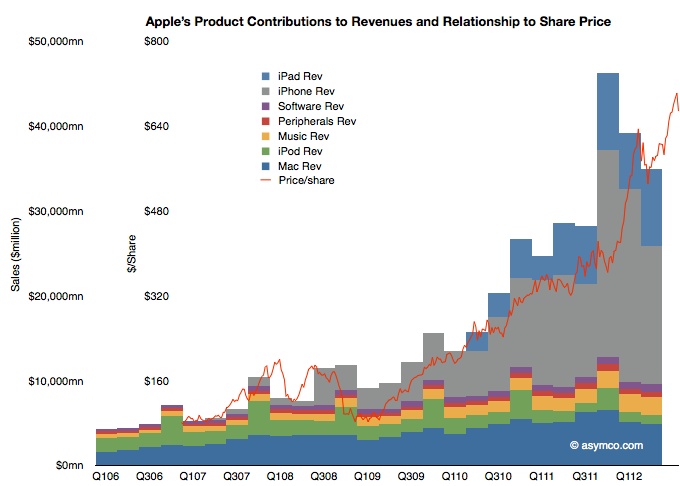
    To illustrate the effect of the iPhone and iPad on this share price appreciation, I've overlaid a quarterly resolution graph showing revenues over the same time period with each product line shown separately.


    Note that I've indexed the vertical scale to match approximately the highest peaks of both graphs. The two axes scales are shown separately on the left.

    The relationship between growing sales and growing share price is plain to see. Note that the iPhone and iPad account for the vast bulk of  sales growth and hence they are mostly responsible for the share price appreciation. Again, this should not be surprising. The scale gives an approximation of the relationship where $50 billion in quarterly revenue roughly yields a share price in the $700 to $800 range.

    As I've shown in the last post on forecasting production using CapEx (focus on the last chart) iOS device shipments (mostly iPhone and iPad) correlate with capital expenditures in the previous quarter. Using the historic relationship, the next two quarters could see a significant increase in iOS unit production. The sum of the low end of the range implies about 163 million units.

    If the relationship is therefore CapEx -> Production and Production -> Share price appreciation, then the transitive implication is that CapEx -> Share price appreciation.

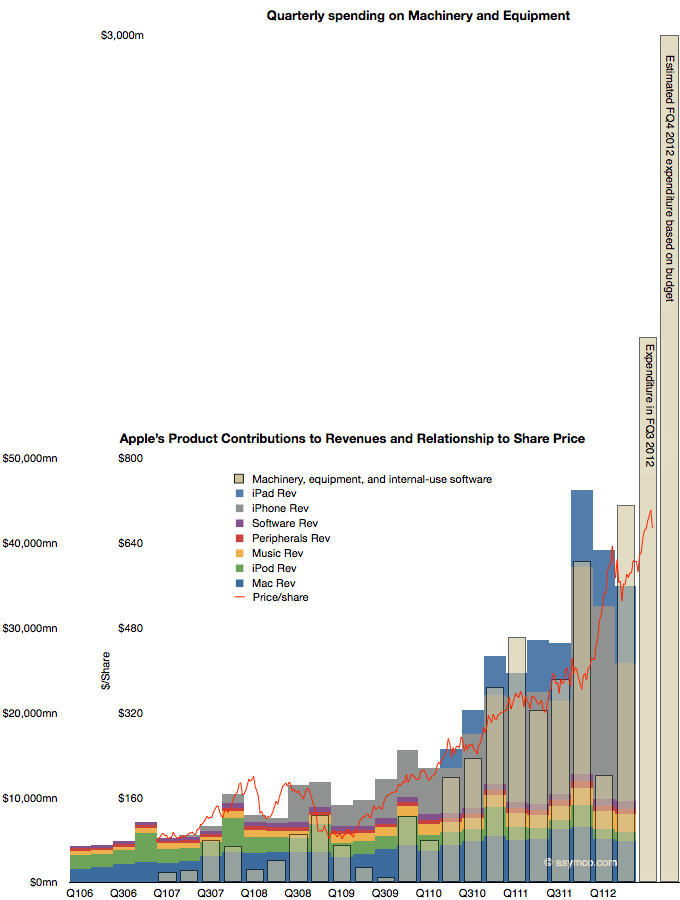
    That relationship would be illustrated as follows:

    The CapEx data shows the offset to the right due to the relationship with production being time shifted by one quarter. Recall that expenditures are booked ahead of output and therefore we have this apparent view into the future.

    The fourth fiscal quarter's spending has just ended and the output will be produced during October-December period.

    The obvious question is whether production will increase in response to spending (as it has in the past), or, put another way, will the stacked bar areas follow the beige bars and, furthermore, will share prices follow production (as they have in the past) and thus the red line will follow the beige bar.

    It takes money to make money. The relationship seems to be that $1.5 billion of CapEx per quarter yields a share price of $800. With spending reaching $3 billion per quarter will the share price reflect a similar ratio?

  4. The Crucible of the Phone Market

    Research · 36 comments

    [The following was originally published on LinkedIn.]

    The US is in the forefront of smartphone usage. This has not always been the case. Five years ago only 3 percent of US phone users were using a smartphone, lower than the global average. At the time Palm and BlackBerry were the prominent devices in the US while in Europe Nokia's push with Symbian and Microsoft's licensing of Windows Mobile led to a smartphone adoption rate of about 7%.

    All that changed with the iPhone. After 2007 the US began to rapidly catch up and eventually overtook all other regions in terms of smartphone adoption. The latest data from comScore Mobilens shows that the US is now effectively 50% penetrated. The following chart shows just how quickly this happened.

    Image (media01.linkedin.com)

    In December 2009 only 17% of Americans used a smartphone as their primary phone. As of August the total reached 49.8%. By today the US is effectively a majority smartphone usage country and it looks like there is no slowing. We might very well see the US reach saturation with 80% smartphone usage in another two years.

    Of course, the US is not the first country to reach this threshold. Some northern European countries were there earlier, but North America is the first major region to get there. That means over 115 million smartphone users in one market. As a result, the US has become the crucible of the whole smartphone market. It's where platforms are most concentrated in use and therefore the most sensitive to the effects of that usage. That leads to more innovation, more discovery of new use cases and more ecosystem growth. Quite simply, it's where competition is most heated.

    This prominent position implies that the US could now be seen as a leading indicator of global trends. It might allow a keen observer to predict what will happen from US data. So what does the mobile platform rivalry look like in the US?  We are fortunate because the data is finely grained in the US. We have montly updates from comScore and we get specific platform penetration data. The following graph shows the shares of the major platforms since late 2009.

    Image (media01.linkedin.com)

    It becomes immediately evident that BlackBerry has lost a huge part of its user base to Android and iOS. In 2.5 years share when from about 42% to 8%. In raw numbers that's 11 million users that switched to another smartphone.

    Looking closer you can also see a consistent growth in share for the iPhone since mid 2010 with a slightly higher rate of increase of share than Android in the last few months. The problem is that this pattern of rapid decline in RIM and moderating growth in Android is not necessarily mirrored globally.

    RIM just reported an increase in total users during the last quarter (from 78 to 80 million subscribers.) Google also recently reported 500 million Android activations globally with no apparently letup in growth.

    So there seems to once again be a disparity between the US and global platforms. Do we take the US market to be anomalous or is it a pre-cursor to global trends?

    Certainly the US market is in many ways unique with a very low rate of pre-paid usage and a relatively high ARPU and average device pricing due to subsidies. However, the global trend has been to increasingly mirror the US not vice-versa. The iPhone has radiated out of the US in terms of usage and so has Android. Attempts by other platforms to make inroads in the US have been unsuccessful. Symbian failed to gain a foothold and it seems Windows Phone is stumbling as well. Both of these platforms have had more success outside the US. The US operator subsidy model has also been "exported" more than pre-paid has been "imported". By 2007 Europe was moving away from subsidies as prices of feature phones were coming down and 3G was still in its infancy. That was reversed as the large screen smartphones became the device of choice. In addition to device and operator trends, most apps originate in the US and the major social media platforms are all American-based. In other words, the modes of usage are being conceived in the US.

    On the other hand, the US is still a tiny percent of total consumption. It represents only about 6% of all phone users. Chances are that prices for devices in the US (especially the iPhone) can't be sustained for 5 billion consumers. Then there are "cultural" considerations where regions cling to their own usage habits and perceptions of value.

    So it's still an open question of whether the US is the leading indicator for how platforms might change globally but I would watch this data very carefully. When it comes to mobile platforms, it might be that if it plays in the US it will play globally.

  5. Estimates for Apple's fourth fiscal 2012 quarter [Updated]

    Research · 74 comments

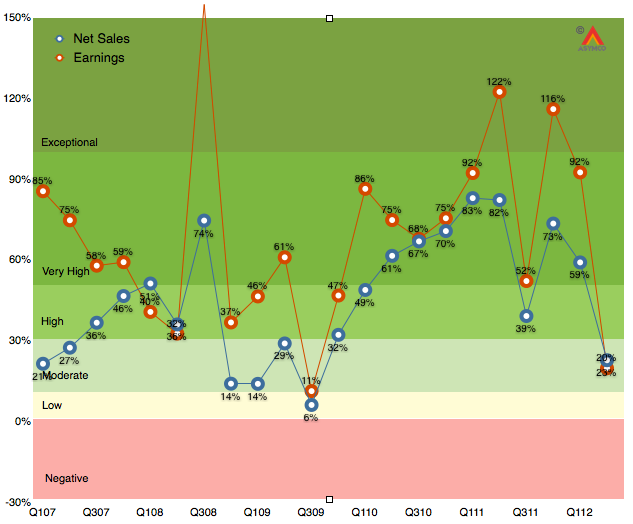
    As the chart below shows, the last quarter (second calendar 2012, third fiscal 2012) was disappointingly moderate with 20% earnings growth and 23% net sales growth.

    It was the first quarter since the iPhone launched that earnings growth has fallen into moderate (below 30%) territory. Much of that disappointment (to me) was the relatively low performance of the iPad following a launch quarter. The iPhone was weak as well, though that was expected.  As I said last quarter, the iPhone is still the most important component but the iPad is becoming increasingly decisive in overall performance. In fact, I’m projecting that the iPad will have the same revenues as the iPhone had one year earlier.

    The iPhone is going to be extremely difficult to project. On one hand we have the launch of the i5 which will account for about 10 million units in the quarter, on the other, chances are that sales were very weak prior to the launch as purchases were being deferred even more than during the last quarter.

    So with these very meager clues, here are my estimates for the quarter (with y/y growth in parentheses):

    • iPhone units: 27.8 million (62%)
    • Macs: 5.6 million (15%)
    • iPads: 18.8 million (69%)
    • iPods: 5.6 million (-15%)
    • Music (incl. app) rev. growth: 40%
    • Peripherals rev. growth: 10%
    • Software rev. growth: 15%
    • Total revenues: $39.5 billion (40%)
    • GM: 42%
    • EPS: $9.75 (38%)

    This earnings value would imply a trailing twelve months’ EPS of about $45.2. At the current price of $697/share the P/E would be 15.4. Cash and equivalents will probably increase to $125 billion or $131/share. Excluding cash, the P/E would be 12.5.

    [Update. The EPS figure above includes a tax rate estimate of 30%. Company guidance was 25.5%. Using the company's guidance yields an EPS of 10.43. TTM EPS becomes $45.9/share and at $697 the PE is 15.2. At time of this update the share price has fallen to $665 and thus the pro-forma trailing P/E ratio is 14.5).]

  6. An interview with Matteo Fumagalli

    Research · 12 comments

    Matteo Fumagalli is a student of economics at University of Insubria, Italy. He is writing a thesis for a bachelor's degree analyzing the smartphone industry.

    He asked me to answer the following questions:

    -First question is about you. Why did you found Asymco?

    I founded the company to develop software, mainly apps. I began writing the blog as a way to drive traffic to the site. I would have preferred to build a blog only but did not think it was possible to earn any money doing that so I treated it as a hobby. Even after the site became more visible I changed from development to consulting and did not expect that writing in itself could be self-sustaining. It took about two years before I felt comfortable with the idea that I could do writing and speaking exclusively. I am still exploring additional business models however.

    -You worked 8 years as analyst and business development manager at Nokia and you anticipated their current crisis with your first post on Asymco. Do you think Nokia will have the chance to recuperate, and eventually what will be the role of Windows Phone?

    Nokia may recover or remain independent, at least. But it will be far smaller. The idea of a return to dominance or 40% share seems very unlikely. As I pointed out in the first post, the organization cannot cope with the new marketplace. Large organizations require extreme stress and damage to change. It's a phenomenon at all levels of society that success results in rigidity. From the individual to the nation to the civilization, success makes change very, very difficult.

    Windows Phone is an attempt to create a third ecosystem. I am concerned that the logic of having a third alternative is not solving a consumer need but an operator need. In other words, consumers are not asking for a third option and when they are presented with a third option they are not excited by it. The consumer does not think in terms of increasing their options. They decide once every two years which phone to buy and that is the end of their thinking on the subject. By focusing on the operator's needs the platform is fundamentally mis-positioned.

    What Windows Phone needs to be positioned as is either as fundamentally different, solving a different job for the consumer. Or fundamentally better along a new dimension like price or convenience. These are some of the claims it makes but they are very weak claims right now.

    -What about RIM, other company which is going through difficult times? What do you think about their decision not to move to Android and stake everything on their closed OS?

    The decision to remain with their own platform may sound risky but it's a simple decision about retaining their business model. RIM is not a general-purpose manufacturer. They have always made an incremental margin on services, messaging and email. For them to use a third party OS would force them to build within the constraints of that OS or platform. That would result in a difficult competitive environment and not one where the company could sustain margins vs. larger competitors. In other words, the company faced two risky alternatives. They chose the risk they were more familiar with or the one that they already had an operating company organized for.

    -Recently Apple lost market share in Europe and China favoring Android. What will be the impact of iPhone5 on this situation? As expert of Apple strategy, do you think Apple has done something wrong in these last months?

    Apple lost market share when considering the smartphone market. I agree with management (and I've argued this before they did) that the market for the iPhone is all phones, not just smartphones. In that context, Apple is increasing its share consistently. Since Apple has only one product in the market (with some residual older versions as well), it's very seasonal. It would be natural to see variance in share through the year. What should be watched is a four period average performance. Overall, Apple is growing its iPhone business faster than the overall phone market so it follows that its share is increasing. I see a long-term potential for the iPhone having 20% share of all phones. That would give it an installed base of over 1 billion users.

    -Smartphone penetration is reaching 60% and we probably talk about saturation in next 2 years. What will be for you the future role of tablets and phablets, they will be threaths of substitution for smartphone or maybe an opportunity to offer complementary products?

    The evidence so far is that buyers don't mind having more than one device. It makes sense if each device is hired for a different job and it cannot be general purpose enough. We've seen this phenomenon with mobile phones where penetration in many markets is above 100%. That implies that even a basic feature like a phone number cannot serve all the needs on one person. To me it seems likely that one person will have more than one device and more than one form factor.

    -What do you think about legal battle between Apple and Samsung? There will be consequences also for Google and Android?

    I defer to my blog post Deus Ex Machina. Legal battles are not strategy.

    -What will be the role of the possible entry of Amazon in the smartphone industry? It's too late for them?

    Amazon is a retailer. I find it hard seeing a retailer becoming a platform provider. Not only is retail a difficult to expand business model internationally, but it's hard to imagine partners being comfortable building an ecosystem on top of retail. Retail is not sufficiently flexible as a business model.

  7. Positioning Lumia

    Research · 17 comments

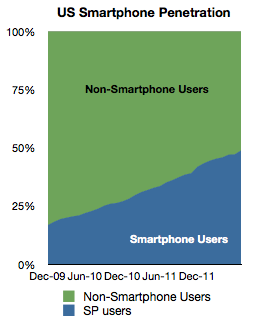
    The US has reached 50% smartphone penetration.

    comScore data shows July penetration at 48.8% and a monthly growth in penetration of nearly 2 percentage points. Given the rate of growth, it's nearly certain that we've crossed 50% in August.

    The historic growth is shown below:

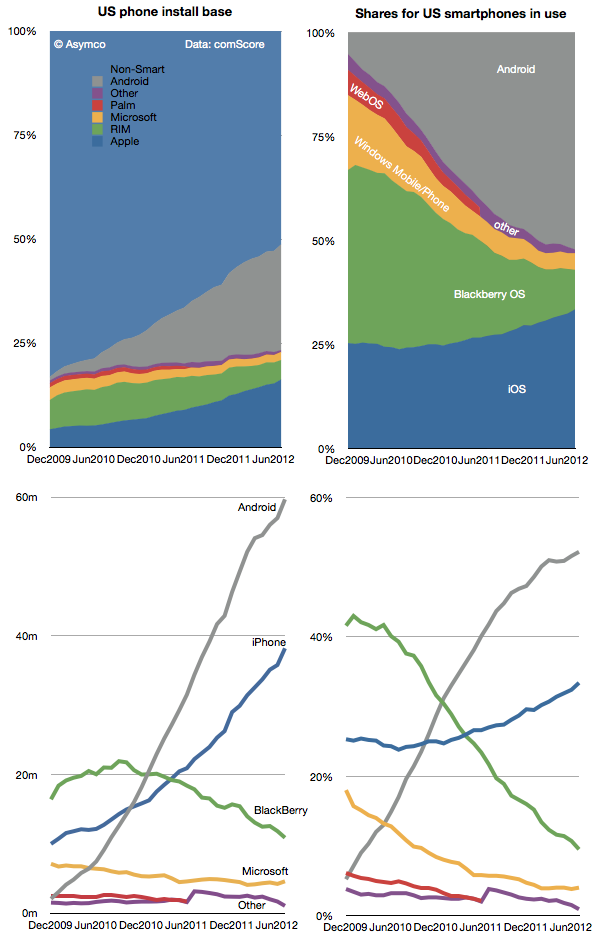
    The platforms making up the smartphone market in the US have seen unequal shares of this new population of users. The following diagrams show how the install bases have changed in absolute and share terms.


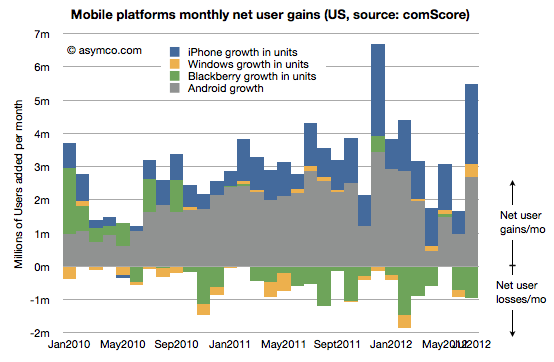
    To round out the analysis, here is the net user gains for the platforms showing the net addition or loss of users since early 2010.

    What I look for in this data are signs of slowing adoption (so far there aren't many), subtle shifts in platform performance (as seen in RIM's move from consistent net gains to consistent net losses) and signs of churn or the transfer of users from one platform to another (rather than from non-consumers to consumers.)

    The story in the latest data seems to be that Windows Phone has turned in a first significant gain in users (378k new users). Its share seems to have stabilized at around 4%. This is in contrast to BlackBerry whose hemorrhage continues (a net of 7 million users defected from the platform in the last 12 months.)

    On this occasion of reaching what I've called the tipping point, it's worth reflecting on just how far we've come. In December 2009 the total number of smartphone users in the US was 39 million whereas now it's about 115 million. That's a total of 75 million new users in a bit more than two and a half years, quite a story there.

    And yet, half of the phone users still remain to be converted. It's possible that the growth in adoption will remain steady but it's also possible that it might slow down and follow the "S-curve" adoption rate that new consumer products typically follow, perhaps reaching saturation at some point below 100%.

    If growth slows immediately then there will be more churn between platforms. If rapid growth can be maintained then there will be more competition with non-consumption rather than between rivals for some time still.

    The changing character of competition will need to be reflected in product strategies. Non-consumption is typically an easier competitor to beat with features. Switching users from a comparable product is harder and may require pricing pressure. To solve this in a time of transition, new products will have to split into a set offered to new users and another set offered to switch users.

    You can see the pressure of this on the Windows Phone platform most of all. As a late comer, does the Lumia range from Nokia fit the bill as targeting non-consumers or switchers?

    In other words, has the brand been positioned as a "better" smartphone or as a "good enough" smartphone? It matters because the "good enough" position has been held by Android overall while the "better" position has been held by iPhone. However, not exclusively. We've seen "better" positioning from Samsung's Galaxy S and Verizon's Droid brand and "good enough" positioning from the older variants of iPhones.

    So it's quite difficult to see where Lumia fits in the US. There is no obvious opening. The next 75 million first time US smartphone users may be attractive to Microsoft and Nokia but it's not clear why, having waited so long, those buyers will be persuaded by the new brand. Perhaps subsidies will help. As indicated with the first US Lumia launch, the product was priced at a discount to the prevailing price point for a premium smartphone. Perhaps that's the "good enough at a good price" strategy.

    If so, it has not been a home run. Perhaps there is still time for this strategy to play out in 2013 but what if Lumia is not actually being marketed this way?

    At launch Nokia has tried to promote the brand as something "better". Better camera, better charging, better maps, better screen, etc. They have promoted on Twitter with the #switchtolumia hashtag. Microsoft has had the "Smoked by Windows Phone" campaign targeting specifically existing smartphones.

    I don't want to suggest that one positioning is more appropriate or more likely to succeed than another. That's a tough call. Either could be the right choice. What I would suggest however is that there needs to be clarity of thought and communication on the matter.

    Perhaps the launch of the new Lumias (920, 820) is part of a clear positioning toward the high end. But the absence of pricing and distribution and how the operators will be engaged leaves the question open. The strongest criticism of the effort so far is this lack of clarity about how the product is intended to be perceived by the buyer.

    A lack of clarity in positioning is symptomatic of a lack of clarity, or maturity in strategy.

  8. An interview about Microsoft's Surface

    Research · 15 comments

    This interview was conducted with Bruno Ferrari Editor of Exame magazine in Brazil.

    First, do you have forecasts for tablet market share including Microsoft for next years? (Apple, Android, Amazon etc)?

    I have some guesses but I don't think it's something that is defensible. Too many things can change. Fundamentally I believe Microsoft sees the tablet as a PC and intends to migrate a substantial portion of would-be PC customers to tablet forms. If they are successful then they preserve the existing PC user base and allow it to grow a bit.

    In contrast Apple sees the iPad as a new type of device that is used for things not directly related to PC style computing. In that sense the iPad competes with PC non-consumption. It means people may own both a PC and an iPad and some will own only an iPad. The iPad will expand the market while taking share from the PC. Windows tablets will try to hold the Windows share steady.

     How do you analyze Microsoft’s strategy with Microsoft Surface? Don’t you think they’re admitting themselves that Apple was right since the beginning?

    We don't know the strategy yet. Without pricing and an idea of how the other OEMs will respond, I have more questions than answers. The fact that they are doing their own PC hardware does indicate that they see the industry architecture changing and that a large number of vendors offering hardware "choice" is not really the basis of competition in PCs. In other words, buyers are not willing to pay a premium for Windows because the hardware it's available on is offered in a wide range of options.

    Do you think MS growth at tablet market will surpass the lost at PC (desktop and notebook) market in the next years?

    This is a crucial question. It's possible that Windows 8 on tablets will create new markets, like the iPad has done and it could take the leading role in expanding computing in a post-PC era. However, to do this, Windows 8 and its successors need to be optimized to solve the new jobs people may have for mobile devices. They have to do this even though they need to sustain the old use cases and business models. To succeed Microsoft needs to "fork" the business model and create new ways of profiting from hardware and software. The rumors that Windows 8 RT devices will be sold at a loss is perhaps a hint that this is the plan.

    Did you see the rumor of a 199 dollars Surface? If it’s true, do you think is a good strategy?

    It all depends on what will be the alternate source of revenue. I assume there will be some sort of subscription service, taking a page from the telecom industry. Perhaps a mixture of Windows Live services (media, documents in the cloud and software updates). We have to see whether subscription computing makes sense for consumers.

    How do you see the problem that MS is creating with its OEM by turning itself on a tablet maker?

    There is a problem, of course. However here again the question is whether they are moving to an "ecosystem subscription" model and whether they want to offer revenue share to OEMs. If they offer something then Microsoft plays the role of the operator and device makers are paid some up-front subsidy in exchange for keeping their systems locked into the network.

     One more questions: did you already estimate the shipments of Samsung Galaxy Tab since its launch?

    Sorry, I don't have the Galaxy Tab estimate. However, here is what I found:

    A week after its release, Samsung announced that they had sold 600,000 units. On the 4 December, it was reported that the 1 million mark was reached, two months after launch. However, an executive at Lenovo claimed that Samsung had only sold 20,000 out of the 1 million Galaxy Tabs that were shipped. In January 2011 Samsung announced they had shipped 2 million units to stores. In August 2012, actual sales figures were released in the patent infringement court case against Apple showing that a total of 725,000 Galaxy Tabs were sold through Q2 of 2012.

    Source: Wikipedia.

    Note that the figure of 725k is US only.

  9. It’s costly and has unpredictable consequences

    Research · 26 comments

    ``It’s costly and has unpredictable consequences. That makes it a very bad business model. I suppose both companies have agendas that are not visible in court and perhaps Apple is signaling to other parties, and perhaps Samsung is using it to raise its profile. It still seems that unintended consequences may arise and the result could be very bad for everybody,’’ said Horace Dediu, founder of equity-research firm Asymco, in an e-mail interview with The Korea Times.

    The above was a quote from the article  Samsung can’t afford to lose Apple fight by Yoo-chul Kim from The Korea Times. Yoo-chul contacted me via email with a series of questions. I want to share all his questions and my answers as well:

    Samsung wides market gap with Apple, according to research firms. You think the gap will further be widen and please tell me why

    As Samsung converts its phone portfolio to be all smartphones, it is very likely to reach much higher smartphone volumes. One year ago Samsung sold about 56 million feature phones. Last quarter it sold about 43 million. The smartphone portion increased from 20 million to 50 million. At the same time, Apple has maintained a growth in its smartphone business of about 100% on a yearly basis. I expect that to continue into 2013 as well. Therefore it's possible that Samsung could sell 290 million smartphones in the next 12 months and Apple could sell about 200 million in the same time frame.

    However, it's important to understand that the companies compete on different bases. What I mean is that what generates a profit (i.e. payment by the consumer above what a product costs) is different for each company. Apple is a platform company that sells access to the iOS ecosystem across many other device types. Samsung sells consumer electronics with limited "network effects" but desirable features. In this view, the gap in device sales is "asymmetric" and not reflective of the actual competition which is between Google's Android and Apple's iOS as forms of access.

    Samsung's rapid rises mainly due to the company's heady dependence
    on Google Android. If Google applies better software for Motorola,
    then you think Samsung will face difficulties?

    Think of Google as a supplier to Samsung. No manufacturer wants to have a situation where they are dependent on only one supplier, especially when there are huge substitution costs for another supplier. And even more especially if that supplier owns one of your competitors. However, it's unlikely that Motorola will become a strong competitor to Samsung. I also don't expect Google will damage their OEM "customers" by favoring Motorola. Motorola can't become big enough quickly enough to be a threat to Samsung. What is more likely to be a problem for Samsung is ZTE and Huawei. They are on the same trajectory that Samsung was on 10 years ago. For Samsung to beat them in the future it will need to develop products that nobody can copy.

    How about software? Samsung is good to roll out price competitive
    models, however, software is always problem. Any advice for this
    issue?

    Software is hard and expertise can't be quickly acquired. It takes time. Only advice [I have] is that efforts must be patient and there need to be many experiments like Bada and Tizen. Google started with Android in 2005 and Apple started with iOS in 2003 or 2004.

    How about the patent dispute with Apple and Samsung. The patent war
    is helping Samsung see a rise in its brand awareness and that also
    worked for Samsung to grab more shares in smartphones?

    It's very difficult to measure the impact of litigation, both in the positive and negative. It's costly and has unpredictable consequences. That makes it a very bad "business model". I suppose both companies have agendas that are not visible in court and, perhaps, Apple is signaling to other parties and perhaps Samsung is using it to raise its profile. It still seems that unintended consequences may arise and the result could be very bad for everybody.

    Samsung wants to become a market creator not just a fast follower.
    For me, it's quite negative for Samsung to create a wholly-new
    eco-systems because Samsung's edges are coming from manufacturing, not creative thinking. What do you think? If Samsung wants to be a
    creator, what conditions should Samsung need and what things should
    the company do?

    Unfortunately, manufacturing excellence is not enough to remain successful long term. US companies were successful, then the Japanese, Taiwanese, Hong Kong, and now Chinese. Companies either adapt or become irrelevant. Building ecosystems is the new basis of competition but it's not the only option. Unfortunately we don't know what will be necessary to build the next basis. What matters is experimentation and the building of new businesses. I can't offer specific recommendations as there is no recipe book for how to create new markets.

    For your views, who is much better so far since the trial has begun
    in the US. Samsung or Apple?

    I cannot comment on this. Performance in court can only be judged by those present and I'm sure everybody present disagrees.

    You think Apple is enjoying its so-called a homeground advantage
    for the trial and is there any possibility that the issue to go for
    the highest court in the US. My Samsung contacts say that's the
    possibility, though.

    Again, I don't have an opinion on legal matters. Broadly speaking, IP litigation is similar to playing the lottery.

    Need your perspectives about Google's support for Samsung. Google
    confirms its supports for Samsung for an united front against Apple
    because the fight between Samsung and Apple is a kind of version that
    represents Google and Apple fight.
    Any comments about that?

    I believe Google does support Samsung. I question however how this relationship will develop over time. I attached below commentary from a researcher at Deutsche Bank on Android in China. I think it has some clues about how Google treats its partners.

    What are pre-conditions before Samsung making an action to sign a
    peace treaty with Apple?

    It depends on the motives behind Apple's actions. I think they want to see a "no copying" rule. They don't mind competition and Android could be a help in the long run by moving users from feature phones to basic smartphones which could later be upgraded to Apple phones. But what I think they want is to signal to others that direct copying is unacceptable. Essentially, the work of their designers is very important to them and copying destroys [the designers'] incentives to do breakthrough products.

    ---

    See also: Who Cares If Samsung Copied Apple? by James Allworth - Harvard Business Review

  10. American exceptionalism

    Research · 45 comments

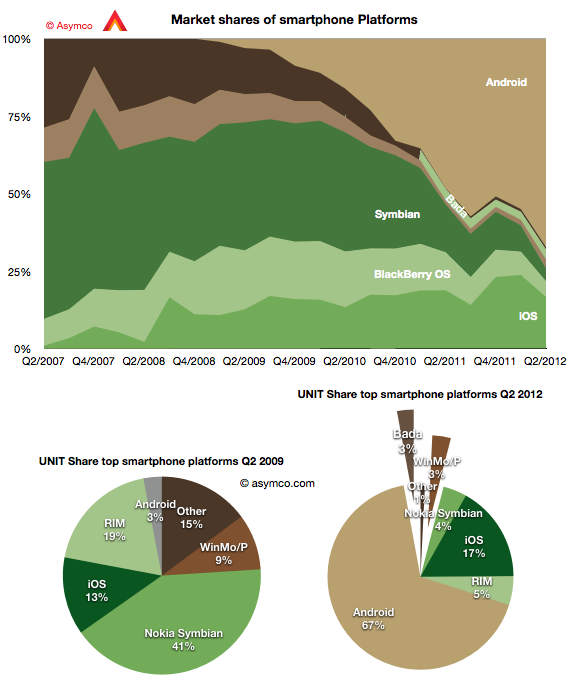
    The second quarter showed continuing growth for Android with 19 points of share growth from a year ago. Only Windows Phone showed a gain y/y in share up 1.6 points to about 3%. In the same time, Bada lost half a point, iOS lost 2.1 points, RIM lost 7.2, Symbian 11.4.

    The result is shown in the graph below:

    I also show a "before-and-after" pair of pie charts which show the difference in smartphone platform market share from the same quarter three years ago. Android went from 3% share to 67% while Symbian went from 41% to 4% and RIM went from 19% to 5%. iOS increased its share from 13% to 17%.

    If this trend continues Android could reach 50% of all phones sold in a few years. That's a run rate of 200 million per quarter. And it's likely that 100 million of those will be shipped by Chinese vendors.

    However, looking at the global picture can also miss some important trends in local markets. Had one looked at the global smartphone business in 2005, the conclusion would have been that Symbian would be the dominant platform in perpetuity.

    What affected the global market was a change in the US: the launch of iOS and thereafter of Android. The US, a smartphone backwater until then, became the most vibrant market and today it's the most penetrated and has the highest ratio of smart to non-smart of any of the major regions.

    The curious thing about this vast market is that it's still not truly open. There are technology and political reasons why some platforms are permitted to sell in one region or not. The iPhone is not available on either the largest Chinese operator or on the largest Japanese one. It's largely absent from India because of distribution (i.e. subsidy) and much of South America. Even in the US, the iPhone is still, after five years, not available on one of the top four operators and has only reached another less than a year ago.

    What intrigues me is what would the market look like if distribution were not an issue. What if there was equal choice to all buyers. We can't test this question directly but we can ask. But there is some pattern we can look at in the US data. Thanks to recent revelations at the Samsung vs. Apple trial we can see the effect of increasing distribution in the US.

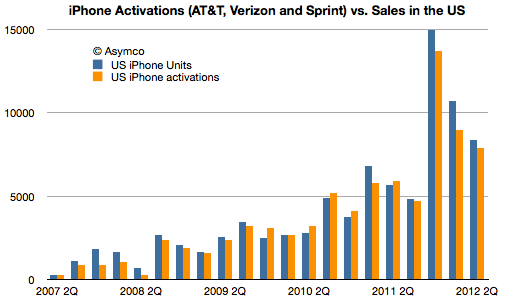
    The data on smartphone market share by carrier can be blended with data from carriers about iPhone activations (which are a proxy for sales, see note below) to give a more precise figure of market share in markets where iPhone participates.

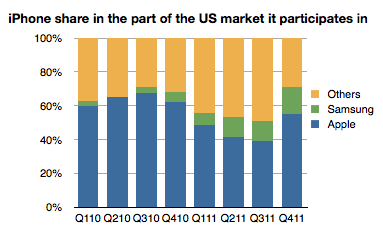
    For example, when the iPhone was only available on AT&T, one could measure iPhone market share vs. the global smartphone market, or the US smartphone market or within AT&T alone. Some assumed that the AT&T share would be reduced once the product would become available on Verizon or other US carriers. However there was no appreciable drop. Share in Q4 2010 was 63% at AT&T and it was 63% a year later after the iPhone was available for four quarters at Verizon.

    So the share of iPhone within those operators which carry it tells a story independent of distribution.

    The following graph shows the share of the iPhone vs. Samsung in the market defined by its availability. (I.e. the volumes of smartphones sold by AT&T throughout the time period, Verizon Q1 2011 to end and Sprint in Q4 '11).

    The share of iPhone thus defined shows a slight decline but it's an overall number that is remarkably resilient as distribution increases and is remarkably high overall. Note that globally, the iPhone gets only about 17% share of smartphones--a value that has not varied greatly since mid 2009.

    So at least in the US, on carriers where it's available, the iPhone is holding on to a significant share. In a global market it's expanding distribution but not yet covering the world. As a consequence it's keeping up with overall market growth and staying between 17% and 20% share.

    The big question is what will happen if and when its availability matches that of Android in terms of points of sale. Or even that of BlackBerry or Symbian. Is America a different market from the rest of the world? It was different in being isolated while Symbian roamed globally. It was different in being a launch platform for BlackBerry and then iOS and then Android. But now that iPhone is beginning to be widely available there, will it be exceptional in how it rewards Apple?

    ---

    Note:

    1. Activations data can be seen next to Apple's testimony of US sales in the following graph. Note that more phones were sold by Apple than were activated in total of the life of the product. 86 million sold and 80 million activated. This implies that an analysis based on activations undercounts the iPhone. 
  11. How many Lumia phones were sold in the US?

    Research · 159 comments

    Nielsen and comScore survey US consumers through different methodologies, however they both try to paint a picture of the smartphone patterns of ownership and consumption.

    I regularly report on comScore's data as it's published on a monthly basis. Nielsen offers updates on a quarterly basis but there is more detail.

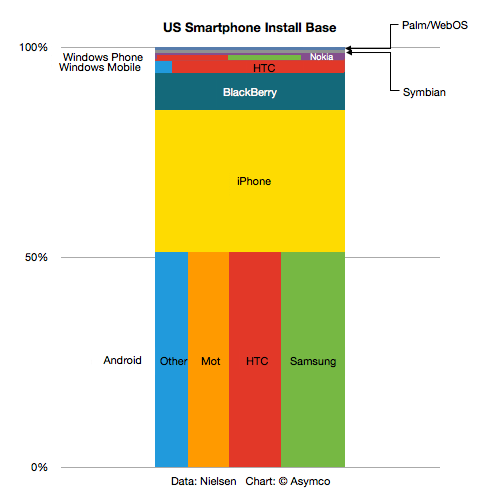
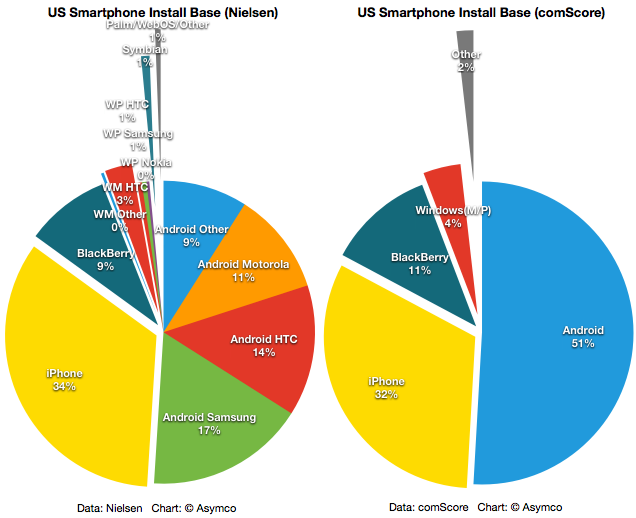
    The latest report (for Q2) shows smartphone shares by both platform and vendor. The following graph is a treemap built with the Nielsen data:


    The same data is also plotted below as a pie chart:

    I also added the latest comScore mobiLens data in the pie chart to the right.

    Note that both surveys agree in the main on the largest platforms. The difference seems to be within a reasonable margin of error. The details available in the Nielsen data are perhaps also interesting. The various Android OEM shares as well as the division between Windows Mobile base and Windows Phone (7) base could provide some insight. Nielsen's total Windows base adds up to 4.5% while comScore reckons on 4%. Within that total, Nielsen breaks out 3.2% for Windows Mobile and 1.3% for Windows Phone. Within the Windows Phone total, HTC and Samsung are shown as having 0.5% and Nokia 0.3%.

    If we then use comScore's figure for total smartphone users (110 million) then the data would suggest that there are 330k Lumias in use in the US. This would have been accummulated over a sales period of about four months.