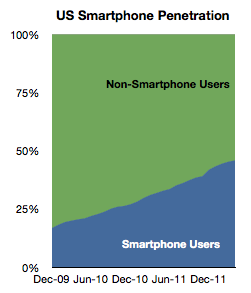
According to comScore, as of end of May, the ratio of consumer phone users in the US (aged more than 13) who use smartphones as their primary phone has reached 47%.
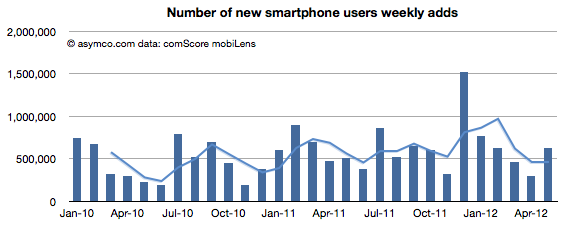
The question is whether this is reaching saturation. My guess has been that saturation will be at levels well above 80%. The data shows that during May the rate of smartphone adoption (first time users) was 630k/week. This number is a good recovery to above the historic mean indicative that saturation is not yet in effect.
50% penetration will happen this summer. A year ago the predicted "tipping point" date was also the same: August 2012.
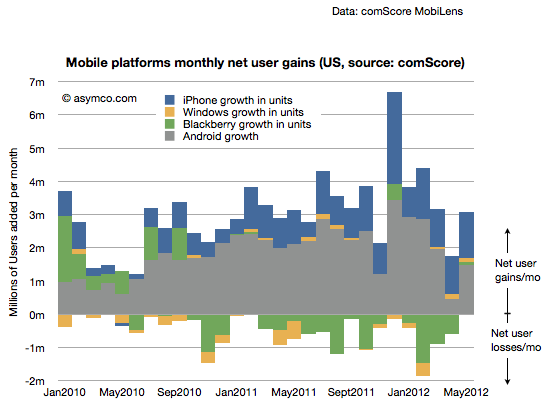
The platform shares data is also returning to a historic consistency. A month ago I asked if there was "trouble with the robot" because Android net adds dropped to a level unseen for two years and the decline in net adds had been going on for four months.
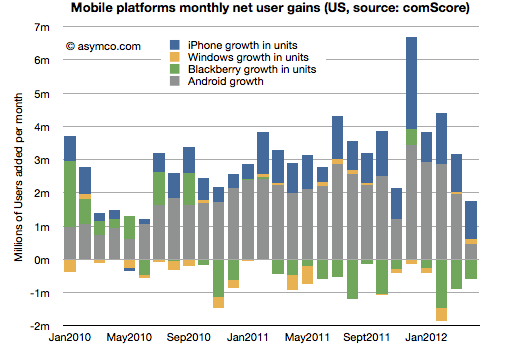
This last report shows a recovery in Android net adds to about 1.5 million new users.
[Note here too that there is no sign of saturation: The net user gains are far above net user losses. Even BlackBerry showed a gain. In a market where there is saturation, net gains and losses among platforms would balance each other out.]
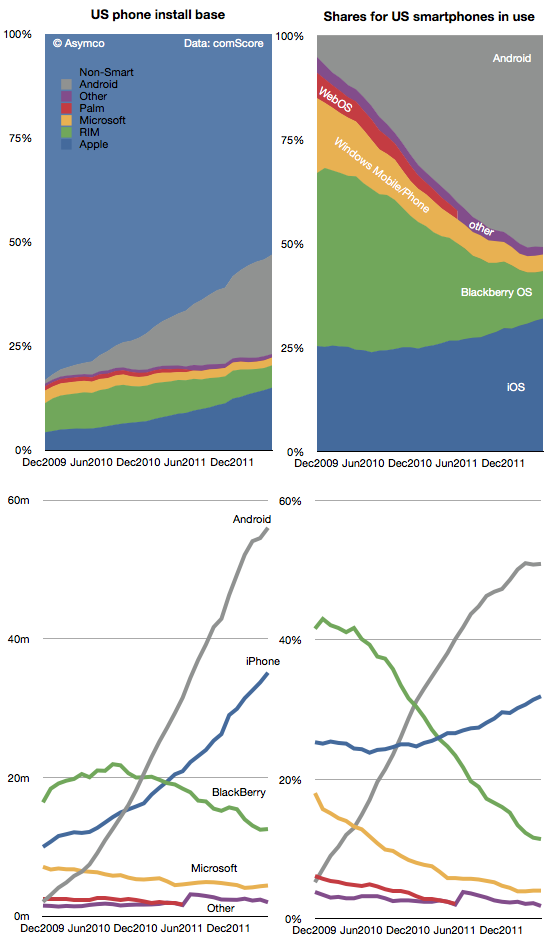
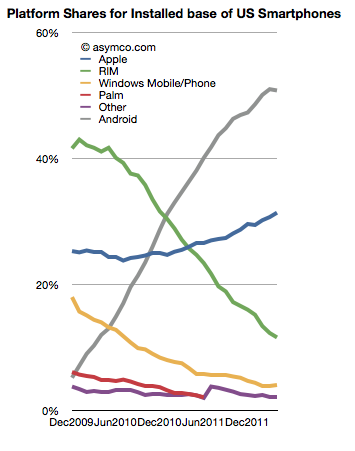
In terms of share, Android shows two months of no growth. The following charts show the history of platforms in terms of share and actual units in area and line charts.
I'd say the jury is still out on whether Android has "peaked" in the US. Globally, the rate of additions seems to still be increasing but in the US we might be seeing the effect of upgrades as many first time Android buyers are reaching the end of their contracts. iPhone and Android "purchase rates" are already at parity but the install base might take some time to converge.
With half the population still not using smartphones, there is still headroom for the platforms, but the inter-platform dynamics are becoming very interesting.
There is no shortage of information about what happens to companies in distress. The cause of distress varies widely and is often not well understood but the actions and symptoms of distress are very consistent. We can look at examples in each industry, even in each product category for a rich set of distressed company data.
For over a year I've been chronicling the decline of incumbents in the mobile phone industry. However, decline cannot continue indefinitely. At some point a company "exits" the industry. Either through a sale or divestiture or, rarely bankruptcy. The list of exits is already long. The length and the correlation between exit and the lack of recovery implies that Nokia will also exit.
But how, exactly?
Will Nokia be acquired? If so, then by whom? What other options exist? How can we analyze this?
The easiest way to guess is to look at what happened to other companies in similar circumstances. The clearest and easiest comparison to apply is Motorola. Motorola was at one time the largest phone vendor and it went through a violent decline. Like Nokia, it was diversified into networks and a few other businesses. Unlike Motorola it's not an American company. This matters because American companies are more comfortable targets for corporate raiders. The legal and boardroom mechanics are not "better" or "easier" in the US than in Europe but they are more familiar to those who might engage in it.
So one avenue that Motorola traveled on was the intervention of activist investors who forced management change, affected strategy and pushed some tactical initiatives. This external pressure was successful in the case of Motorola. The company was split up, it was re-purposed and re-focused and, with a bit of good luck, was acquired.
The process however still took two years. In that time the company languished but stayed alive. Its headcount was reduced by nearly two thirds. It was in a precarious situation throughout. Its story is not over but ownership did change hands and those who took a risk with it while in distress managed to get a reward.
This example (and Sony's acquisition of Sony Ericsson and HP's acquisition of Palm) cannot apply to Nokia. An activist investor is unlikely and the company has not yet made itself attractive to a buyer. So what would Nokia need to do to be acquired?
The first step toward an acquisition will be divestiture of its Nokia Siemens venture. The second will be a spinoff or sale of its non-smart phone division. The third might be the allocation of its IP across these separate entities or in a separate holding.
As the company is broken up, value can be released. Investors will be able to value it better and make appropriate assessments of risk. Only at this point would an acquirer perhaps buy the "rump" Nokia smartphones group.
However, even this scenario is not without huge risks. By the time the split is completed, the operating companies could have deteriorated to such a degree that they are no longer viable. Timing is critical.
So if the smartphone group is isolated and made available, who could buy it? Microsoft is always cited as the primary buyer. I've been skeptical of this as Microsoft has found it difficult to make hardware work. It acquired Danger leading to Kin which failed. It has struggled with Xbox for a decade and has yet to recover all its costs for the effort. It has failed embarassingly with Zune. It also has shown no particular success with its original Surface table computer.
But management has re-committed itself to a new hardware effort with the new Surface. This renewed potential opens up the possibility of entering into the integration of a phone again into their business, and Nokia would be remarkably well positioned to help.
At this time, the possibility still seems remote. The company has dismissed speculation of building phones again and again. Unlike PCs, the phone platform is not yet mature and volumes and distribution are very different.
However, there is one other option.
Microsoft has historically "rescued" technology companies in distress with cash infusions for minority equity stakes. It injected some cash into Apple, Barnes & Noble and even Facebook. It did so not because they wanted to own these companies but because they wanted them to survive or thrive. The move acts as a signal to the industry, partners and developers. So what I see more likely than an acquisition is Microsoft capitalizing a spun-off Nokia Smartphones company in exchange for a small equity stake.
The valuation of this stake will be huge as I expect billions of dollars for single digit share ownership. However, Microsoft would not be doing it to get a return from those shares. It would probably later sell them at a loss. But it would be buying a strategic option whose value may be far greater.
The latest data from comScore showed a few surprises:
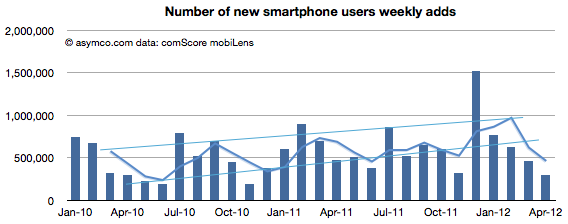
New smartphone users dropped to a very low level, below the trend line.
Slightly less than 300k new smartphone users abandoned their feature phones every week during the month. Compared with the 1.5 million per week in November, it's quite a slowdown.
Penetration growth slowed as a result as well. Only 1.3 points of share were gained by smartphones.
It's still likely that the penetration will reach 50% by the end of summer this year (as was predicted in 2010).
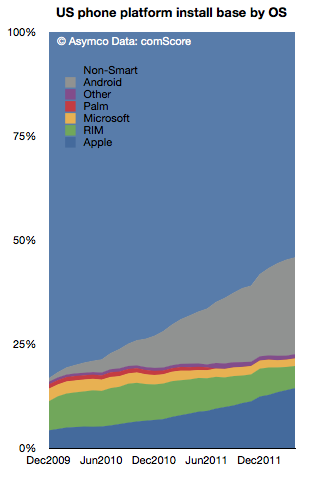
When looking at the picture above broken out by platforms, we see signs that the slowing in smartphone growth seems to be attributable to a slowing in Android adoption:
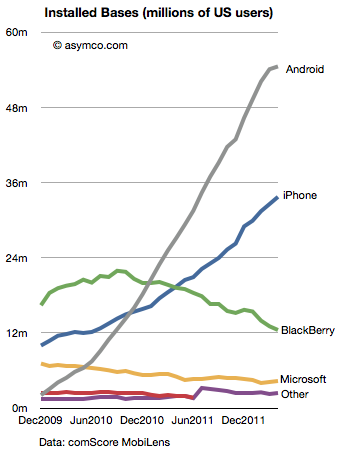
Here are the installed bases in users over time of the different platforms:
The share of users of the platforms is shown below, first as a stacked area:
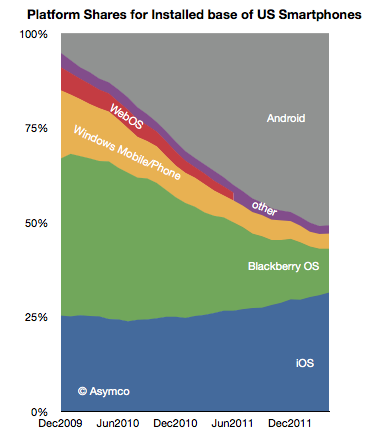
And also as a line chart:
This last chart shows the first time when Android share dipped sequentially. It should be watched closely as an indicator of a change in market dynamics. As we reach saturation, the basis of competition will change.
Finally, the last chart shows net user gains for the platforms.
Here again we see the lowest user growth for Android since 2009 (and hence since it reached mainstream distribution.)
It's perhaps too early to suggest that we're seeing a slowdown in the US for Android. Perhaps there will be a return to growth in the fall. The concern has to be that rather than seeing the net adds growing--as they have for two years with only two contiguous months of decline--Android net adds have been falling for four months.
A glance at Nokia and RIM's market values today shows that they are both valued below book. With respect to RIM,
The company's share price has collapsed in the past year, and it is now only valued at about $5.4 billion, down from $84 billion at its peak in 2008. Excluding its cash and the estimated value of its patents, RIM's device business and its 78 million subscribers around the world are in aggregate worth less than $1 billion to investors.
MKM: We are downgrading Nokia to Sell from Neutral following our U.S. retail Lumia model checks. We assume no value for the handset business and no value for the roughly four billion euros [about $5 billion] in net cash.
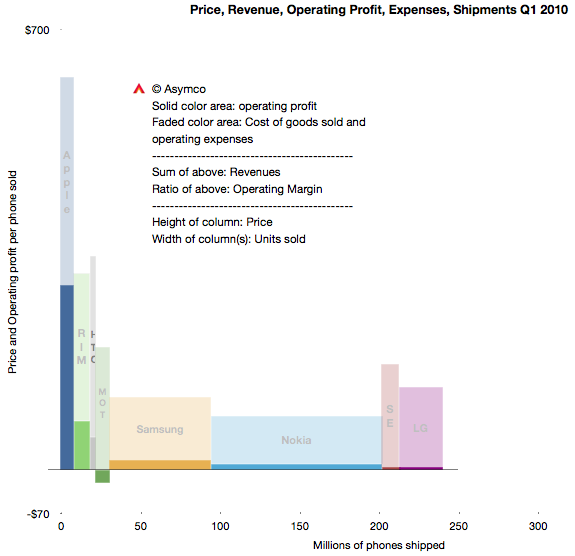
Three years ago the situation was dramatically different. RIM's share price was six times higher and Nokia's about four times higher. Here's what the market looked like in Q1 2010:
This summary view shows individual competitors in the phone market as well as their combined total volumes. The profitability/volumes/pricing can be visualized as well as margins and revenues.
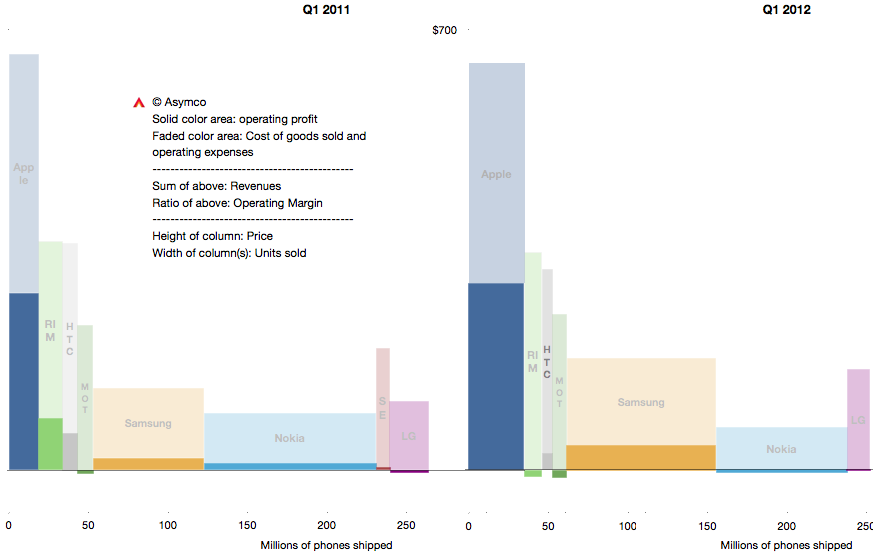
The same visual summary is presented for the first quarters of 2011 and 2012 below:
The change may be subtle to the untrained eye, but it can be summarized as contraction for most vendors and expansion for Apple and Samsung. RIM and Nokia not only contracted in terms of revenues and volumes but also, crucially, lose money.
I've written about this before (many times.) But it's important to repeat again that this is a very short time span. Only three years separate the top chart from the bottom right. The "shape" of the market participants has not changed much but a tipping point has been crossed. This is the point where some participants are disrupted enough that they cannot recover.
Did it happen in 2010, 2011 or 2012? We're only looking at data which results from hundreds of decisions and thousands of actions. It's improbable that there was a single moment when the shift occurred or a single decision that caused it. But it's equally improbable that the disrupted could have countered any of the actions that got them to this point.
The cause (and remedy) for disruption is never found in a single act. It's a process and a way of operating and thinking. Is management to blame? That's always the answer. But how did management go from being smart to foolish so quickly and why did all managers in a firm, even an industry, conspire to become foolish at the same time?
If you study the decisions on a day-to-day basis, management consistently applies all the lessons they learned that led to success in the past. But these lessons lead to decisions that end up with exactly the worst result possible.
The crux of this dilemma is that doing the "right thing" leads to the wrong result. In a comment I questioned the possibility of management in a public company solving the dilemma.
Some have argued that public companies with professional managers entrusted with fiduciary responsibility are inherently incapable of solving the innovator's dilemma and are thus doomed to be disrupted. I'm starting to believe the argument. Whenever you as a manager try to work out the solution to the dilemma, you encounter a value destroying obstacle that cannot be surmounted while maintaining your position in the company. [As you attempt to solve it, you lose your position] Your successor won't make the same mistake and [thus] the whole enterprise collapses.
There are counter-examples however. The reason Apple should be studied is that it gives hope that they have cracked this problem.
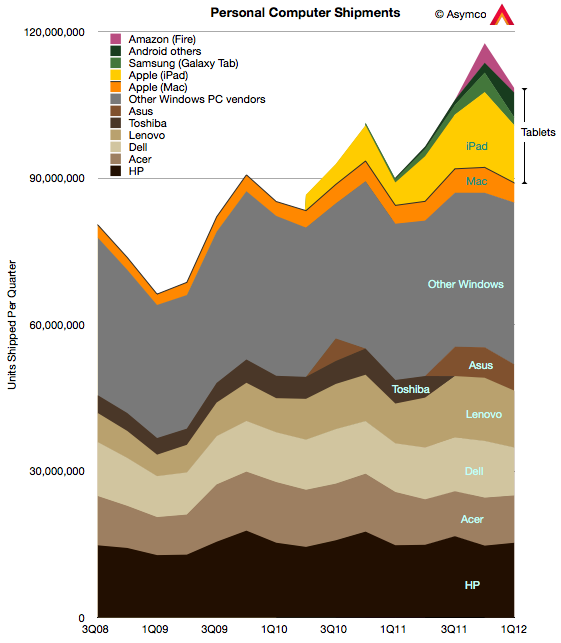
In terms of units Windows-based computers made up 78% of all PCs sold in Q1. That was an increase from the 74% in the previous quarter but a decline from 90% a year ago. OS X based computers were about 3.7%, a decline in share both q/q and y/y, something the company attributed to a transition quarter.
The following chart shows the composition of vendor volumes with tablet and traditional form factor computers included:
iOS computers (i.e iPad) were 11% of the market, declining from 13% last quarter but increasing from Q1 '11's 4.2% share. Apple reported that the iPad was not at supply/demand balance and thus could have sold more units.
Amazon's shipments went down significantly though sell-through was perhaps twice sell-in due to inventory build-up during the previous quarter. Overall, about 5 million Amazon Fire tablets were sold since the product's launch.
The third significant tablet vendor was Samsung, which sold about 1.6 million tablets, down sequentially but up y/y. Other Android tablets may have shipped another 5 million units.
Overall, Apple remained the top vendor with 14.6% share, followed by HP with 14.1% and Lenovo in third at 10.7%. Dell just barely managed to beat Acer with 9% vs. 8.9%.
The impact of the tablet (aka iPad) market is being described in the response to a significant earnings miss by Dell:
Sterne Agee, which admits it probably shouldn't have upgraded DELL from underperform last week, says it's notable that the PC maker acknowledged competition from Apple and Google for the first time as part of Tuesday's dour F1Q report and forecast. Meanwhile, Mizuho calls DELL a "show-me-story for now" in cutting it to neutral and cutting its price target 25% to $15. And ISI snarks "everything is bigger in Texas--including the misses." It adds while the company "is making the right business-model changes...results will remain 'chained' for years (not quarters) to commodity desktops/notebooks, which comprise over half of sales."
- Dow Jones Newswires (Kevin Kingsbury)
And so, two years later, the impact of the iPad is becoming abundantly clear, even to the incumbents. The resistance and denial was profound. Even on this blog, the agitation and anxiety when the subject of the iPad as disruptor came up was palpable.
Perhaps that is the greatest testament to the disruptive potential of a product.
My thanks to Bruno Ferrari of Exame magazine Brazil for asking the following questions. My answers were written two weeks ago on April 2nd.
Based on financial data of the first fiscal quarter, it is possible to confirm that 2012 will be the best year in Apple's history?
Actually, it's possible to confirm without looking at first quarter data. Every business line Apple has except the iPod is growing and is likely to keep growing during this year. That means that sales will increase over 2011, which was Apple's biggest year. You can see historic sales growth data here:
What are your predictions for the second fiscal quarter?
The iPhone number seems to be higher than consensus. It's aggressive but I'm basing my opinion on the launch of the iPhone 4S in China and the Chinese New Year and new carrier agreement there. Also the iPad will do quite well.
Do you think Apple will hold the iPhone 5 launch to September in order to open 2013 with an extraordinary result?
The next iPhone will launch between June and September. It might be earlier due to the 4S being the "wide end of the egg". Think of the iPhone as an egg rolling down the hill. There is a sharp end and a wide end and the speed of rolling depends on which end is down.
Besides the iPhone 5, which products that Apple could announce in 2012 you think may help them to maintain this extraordinary growth?
I think the iPhone is becoming more predictable. What I'm more curious about is what they will do with the iPod. Apple takes its brands seriously. I am watching the iMac, MacBook and iPod for clues of a re-fresh or replacement as they have aged.
Do you think we will see the “iTv”? Do you think it could be “the next iPad” of technology market?
Apple TV is in waiting mode. It's like an airplane circling, waiting to land. Something will happen but not sure when. Fundamentally, the opportunities are still there but the entertainment industry is very complex. The more complicated it is the more necessary for an entrant is to create a parallel version of it. That takes time.
The building blocks are all there however. See additional thoughts here.
If we analyze the growth of Apple in recent years, it is supported by the launch of new products, especially the iPhone and the iPad. Do you think Apple can lower your rate of growth in coming years since we don’t see in its roadmap new innovative products like a new smartphone or a new iPad?
New products created new growth but iterations of those products also created and will continue to create growth. Of all of Apple's products only one product is not growing today, the iPod. And that is after 10 years in the market and with a "dominant" market share. In addition, Apple has a lot of room to expand internationally and into enterprise and professional sectors.
I do agree that 100% growth is hard to maintain without new products. I believe there might be a few products still waiting for launch. TV is one area (along with game-based entertainment). New user interfaces might be enabling new categories of products. Intelligent assistance and companionship are open problems that software can solve but which have not been productized.
When do you think we’ll stop to see Job’s legacy in Apple new products. And what then?
Jobs' legacy is not in specific products but in how products are built. He also taught the importance of putting products first and markets second (this is, at its base, an artistic principle, not a commercial one). I think that legacy can last forever, if managed properly.
How do you analyze the dividends pay and the buyback made this month?
I wrote some thoughts about it here. I believe the impact will be mostly psychological for investors.
And finally, I was reading at Asymco some analysis of Apple’s share price. Do you think $600 is enough? Do you think in a 1 trillion dollars company in 2014 as some analysts are saying?
The share price depends on the psychology of people. I like to say that Apple is the same exact company today as the one that was priced at $78/share three years ago. When I look out the window of my office I see the same view year-to-year. When I look on my computer screen at Apple's financials I also see the same view year-to-year. I don't know how people can see Apple differently one year to the next. To me it's like looking out the window and seeing mountains instead of the sea.
But this is how markets behave. I can't say what the price will be. It may be $1000 or it may be zero. But the company will not change in either case. It won't change because it does not need to change.
Chris Brennan asked a few important questions regarding potential saturation of the iPhone market.
Is the iPhone anywhere near saturation? Can Apple continue to shift iPhones in ever increasing numbers or is a sales plateau realistically on the horizon?
The market for mobile phones is approximately 5.5 billion connections, perhaps 5 billion users. The iPhone has approximately 300 million installed base. I consider a base of 1 billion users to be a minimum for continuing participation in this market long term. Licensed platforms will reach this in no more than two years. I don't know what Apple's ambitions are but if they don't triple their base I don't see a strong future for the company in mobile phones. In order to triple the base the company will need to sell substantially more than an additional 700 million iPhones. The retirement rate can be as high as 50% of installed base. Apple will need to sell at least 1 billion iPhones in the next few years. Seen another way, Apple has a market share of about 9% on a quarterly basis. This needs a lot of improvement. Chinese vendors are not standing still.
Can the Mac also continue to outperform the rest of the PC market for long?
The PC market is in decline. It will continue to decline as its disruption continues. The PC market will still exist 10 years from now but, similar to the mainframe market, it will be hard to notice. Apple is doing a fine job carving out a large portion of that market for itself but overall it's an increasing portion of a decreasing pie. It would be better to track the share of profits captured or even share of value rather than units. The reason units were important 20 years ago was because platform dynamics determined whether a marginal platform could survive. Would a 5% share be enough to attract developers? That is no longer an interesting discussion. Applications for PCs are not an area of investment for any significant pool of capital. Development has moved almost entirely into mobile or web. Therefore, as the PC is now a commodity product, the best performers are those who can capture a larger margin. Those margins should be subsequently be invested in new platforms. PC vendors who neither capture margin, nor invest in new platforms are strategically insolvent.
Finally, this exponential growth of Apple products has to end some time soon doesn't it? How many high-income buyers for expensive products can there be left for Apple to target?
Trying to calculate the limits to growth is futile. There are limits but they are not calculable and inaccurate estimates don't offer any useful information.
In 1939 a total of 921 military aircraft were built in the United States. Five years later, in 1944, annual production was 96,318. A question could have been asked by an aviation analyst in 1939 about whether the American aircraft industry could grow. Aircraft, especially multi-engined ones used by the military were _extremely_ expensive. The reason an industry grew exponentially making extraordinarily expensive products was not because of organic demand but because the primary buyers engaged in a cataclysmic global war. In other words, there was a will to buy and hence there came a way to build. Therefore the answer to the question of sustainable growth comes not from an analysis of demand but from an analysis of the consequences of not growing. Not growing would have meant the end of many nation states.
Your question was framed by an implied market categorization: that buyers are either high-income or, presumably, low-income. This is a false dichotomy. Buyers are either needful of a job to be done or not. If the job is important enough, money will be found to hire a product. Sellers of products will also find ways to meet the demand through lower prices and increased capacity. Every product Apple makes used to be out of the reach of all consumers. Whether computers (portable or not), music players and professional grade software, voice recognizing personal assistant cellular phones and tablets are all luxuries or necessities is only a question of timing.
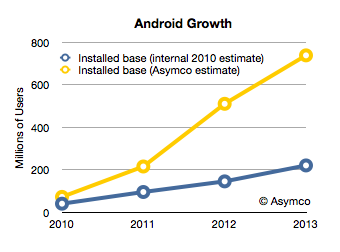
Android has had unprecedented growth. Based on activation announcements, it's possible to estimate that thus far, about 370 million Android devices have been activated. The total number of devices in use is a lower figure which depends on replacement rate and retirement rate. This total number of devices in use at year end is estimated in the following chart.
I added the blue line which represents what Google had as an internal estimate in mid-2010.[1] The difference between the two lines shows that Android's growth is far higher than what the company expected. If the company itself did not expect this growth, it's unlikely anybody else did either.
Unexpected, exponential user growth is usually accompanied by a dramatic positive improvement in the finances of a company and a higher return to shareholders. The curious aspect of Android's success is that it has not had an impact on either. The market has not "discounted" the half-billion anticipated Android users into a price for Google shares that reflects this growth. It can only imply that those users are not very valuable.
But why would there be such a disconnect between the number of users and their value?
In order to answer this question we have to come to grips with what I call "Android economics". We need to understand how Google uses Android to make money and whether it is succeeding and if it's not, why not.
In many ways, the Android business model is straight forward. It's an extension of the existing Google business model: Revenue is obtained from Search, AdSense and the applications that enable these two. In the case of Android there is also revenue from app sales (Google Play a.k.a. Android Market) and from AdMob. Of course, all these revenue sources (except for Play) are sold through other mobile channels that include alternative, competing platforms. They are present on iOS, Symbian, BlackBerry and even embedded OS phones ranged directly by carriers. For each of these alternatives, Google pays for placement of their search as the default search in the browser.
To Google, total search revenue from iOS is far higher than it is from Android. That's because iOS users engage more with their devices and there are not yet a large multiple of installed Android users vs. iOS users.
But it would make sense that having your own platform would be more economical because there would be none of these placement fees. In this sense Android is another "channel" for distribution of Search and AdSense. But one which may be a lot cheaper.
However, it turns out that it does not work that way. Android has other costs.
In fact, Android's distribution costs might be higher than other channels. What we have to understand is that all of Google's channel revenues have a "cost". The revenue from a particular distributor of search results that Google generates is offset by the cost to acquire the terms. You can think of it as Google paying for the queries through a revenue sharing agreement. Google does not get search terms directly and depends on distribution. Overall, it pays about 50% of revenues back to distributors. In the case of its own web sites the rate might be lower, perhaps 40%.
Google even has a term for it: Traffic Acquisition Costs or TAC.
This revenue sharing in exchange for search terms extends to Android. Google pays about 40% TAC to Android distributors of those searches. But since Android is owned by Google, who does Google need to pay for traffic? Who is an Android distributor? Who gets the revenue share?
Google does not make a secret of it: network carriers and device vendors (OEMs) receive revenue share. From the latest earnings conference call:
Yes. I mean, again, I'm not going to talk about specific of the TAC on mobile. But as you know, we get people using our devices both organically as well as through our distribution partnerships with carriers and OEMs. And typically, the OEMs and carriers participate in some of the economics that are on the Android marketplace or Google Play and some of them participate in the economics around Google Search just the way we would do syndication on the Web platform, which you do with many partners around the world. We have similar deals on the mobile front.
Arora made another point in the quote above. Not only is there revenue sharing with carriers and OEMs for Search and AdSearch but also for Google Play (app and content sales.)
Device vendors and carriers get a cut. Google's model has always been one of giving a cut of revenue to their upstream distribution. It just might be surprising to hear that device vendors like Samsung and carriers get a piece of Search and apps.
This basic observation leads to a series of questions:
How much is paid out and to whom?
Is that revenue sharing sustaining the ecosystem? Do vendors create Android devices and do carriers push Android to consumers because they get this revenue share or is the amount insignificant vs. device margin? What about tablets? Why haven't Android tablets they taken off as Android phones have? Are the economics to blame?
Is this a competitive advantage vs. other platforms? Does Windows Phone compete with revenue share for Bing? Is Microsoft offering a bigger carrot (as well as a stick?)
How does this economic picture show up in Google's financial and stock price performance? Or, more precisely, why doesn't it?
And, finally, what conditions create a virtuous cycle of growth and what conditions could turn it into a vicious cycle of decline? Is there a lurking factor which would cause Google to benefit greatly from this user base or is there an inherent point of failure in the model?
I'll be answering these questions in a series of posts this week.
--
Notes:
Google's internal documents were leaked as part of the Oracle trial (Exhibit 1061). They can be found by using Google search with the following search term: "OC quarterly review".
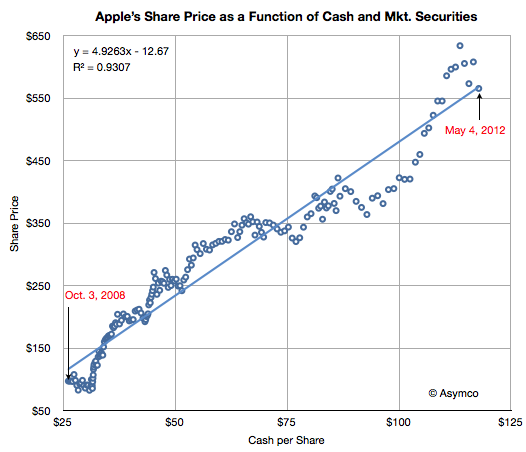
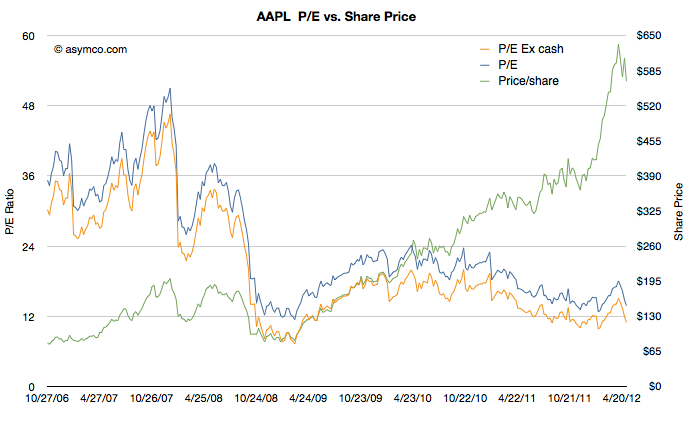
I first noted a correlation between Apple's share price and its balance sheet a year ago. In February, when I last checked, Apple's share price was priced nearly at 4.6 times its cash value. The stock has had a brief rally but has returned to the trend line it's had since late 2008.
I should emphasize that this correlation between cash and price is abnormal. It should not be happening. Share prices for growing companies should be tracking its future potential, not its assets. I'm only presenting this data to highlight this abnormality. There is no fundamental basis for this happening. In fact, there is a basis for this not happening.
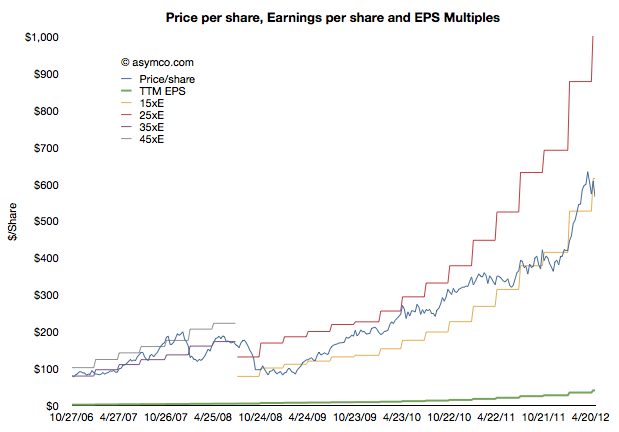
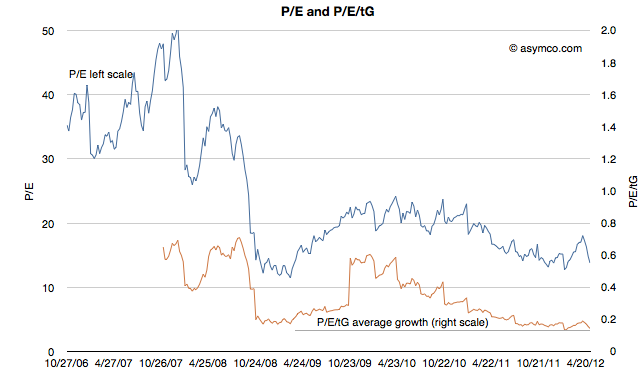
The relationship above is a symptom of another pattern called multiple compression that can be seen in the following charts:
The last chart in particular shows how as a function of earnings and growth, Apple is priced near a low. Certainly lower than during the depths of the 2009 recession.
Given this disconnect from the income statement, the pricing by balance sheet multiple seems to be a symptom of something deeper. Reasons vary with the seasons, but the company is not perceived to have sustainable growth.
During the first quarter this year HTC, RIM and Nokia all surprised investors with bad news. The effect is evident in the share price of these companies which, in the case of RIM and Nokia is around book value, and in the case of HTC, neared 12 month lows and a 70% drop from peak.
These "misses" in earnings and expectations are on top of the already woeful news from Sony Ericsson and Motorola, which have not had profits for years and LG, which has been borderline since late 2009.
In combination, this seems to imply a dearth of profits in an industry that is, by all measures, booming. Units are up 7% with smartphones up 47%. Revenues are up 20% and overall profits are up 52%. This are exceptionally strong numbers. Few industries can measure growth in double digits.
So if the industry is booming but the majority of participants in the industry are loss making (and surprisingly so) then what is going on? There are two answers: new market disruption and low end disruption.
The new market disruption is the migration of a large number of demanding customers away from phones-as-voice-products to phones-as-computing-products. The low-end disruption is the migration of a large number of less demanding customers from branded phones to unbranded, commodity phones.
The New Market Disruption
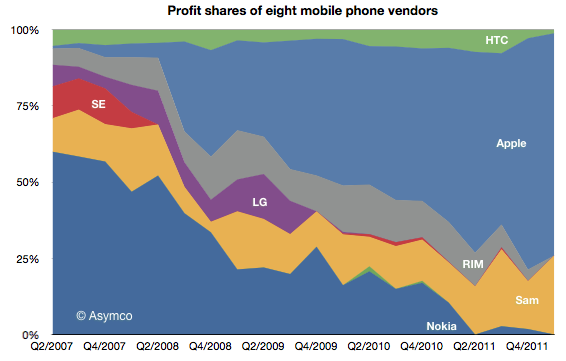
The new market disruption is evidenced by the shift of fortunes to Apple and Samsung and away from every other device maker. Here is the profit picture:
Of the vendors tracked (public companies who report mobile phone divisional performance), Apple obtained 73% of operating profits, Samsung 26% and HTC 1% [1][2].
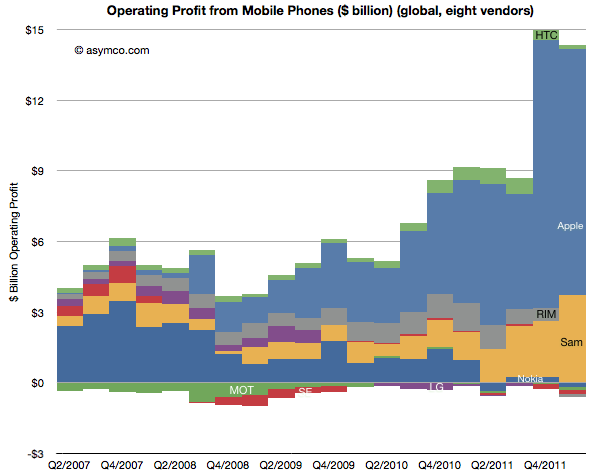
The "share of profit" picture is potentially misleading because it could imply that the profits available are a constant. They're not. The absolute profits picture below shows how the industry actually expanded available profits by quite a lot. Two years ago the vendors generated profits of $5.3 billion in the first quarter and last quarter they generated $14.4 billion.
Seen this way, the story isn't so much that Apple "took the profits from the incumbents". Rather, it's that Apple created a vast new pool of profits. And one need not look far to find out where they came from: operators. These profits were mostly carrier premiums for the iPhone 4S.
Before shedding tears for operators, consider that although this does amount to a current transfer of profits from carriers, the decision is a popular one. Hundreds of operators have made it. It's unlikely that they all colluded to be robbed. Indeed, they willingly hand over these premiums because the iPhone ensures a competitive advantage or preserves their customer base from churning. The calculations that go into a decision to range the iPhone are compelling enough that 250 operators made the decision (though, crucially, there are still 250 who have not).
Following this value proposition to its logical conclusion would suggest that the industry is rewarding those who can supply computers-as-phones which preserve the cash flows of what is essentially a trillion dollar data services business. Vendors which cannot offer this solution saw their businesses implode. At least on the high end.
The low end disruption
Simultaneous with this shift of the high end to smartphones-as-app-and-service-platforms came an explosion of growth in unbranded phones. As Apple led and most brands followed the new market, the old market of voice-oriented phones was abandoned to new entrants offering cheap "good enough" phones. Nokia tried to preserve its volumes and margins there but it's becoming increasingly difficult.
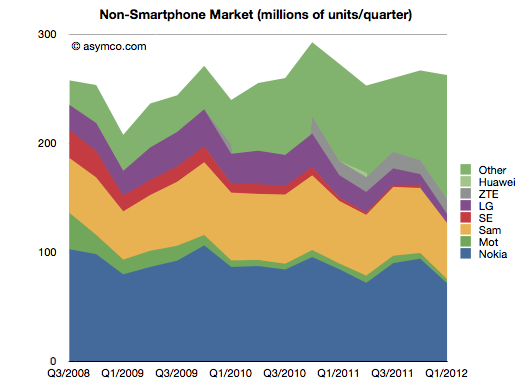
The following chart shows how the "Other" vendors have come to make up about 44% of the market.
Note that although this "feature phone" segment is not growing, it is still a large market (250 million units a quarter). The entrants in this market are numerous (perhaps in the thousands) and they are offering white label and unlicensed knock-off products. They are also offering unregulated (i.e. without IMEI numbers) products which are technically illegal and sold mainly in underdeveloped countries which have no incentives to enforce regulations.
This is a consequence of feature phones reaching the point of being "good enough". The feature set and quality are adequate for voice, text, games and even media playback and are priced at $30 or less.
This commoditization of the low end is pressuring what would normally be the fallback cushion under an underperforming smartphone business. The crisis for the incumbents comes from not only being unable to shift to the new market as fast as needed but also from not having cash flows from a low end that was thought to be sustaining.
This combination of two disruptions is why we see an explosively large and growing market failing to reward all but two of the participants.[3]
---
Notes:
You can download, view and interact with a motion chart for the industry data here. All data is sourced from company filings except for some estimates where data is missing.
Operating profits are sales minus cost of sales minus operational expenses attributed to the business. When not available, opex is estimated as a percent of total in proportion to sales. Note that operational income excludes taxes, depreciation and other capitalized costs.
We cannot say that the thousands of low end entrants are unprofitable. They are probably enough profits to sustain them and even to attract more entrants, but we have to also recognize that there are likely to be very low margins.
One of the arguments made for the cause of the increase in Apple's share price of late has been that dividends would attract more institutional investors and provide more liquidity to Apple's shares. Can we test this argument?
We're not dealing with speculation. The decision to start paying dividends was made three weeks ago. It makes sense to assume that this new information has been absorbed by the markets and market participants have adjusted their positions. Funds that were previously restricted in their investment in Apple due to its lack of dividend policy, could now go ahead.
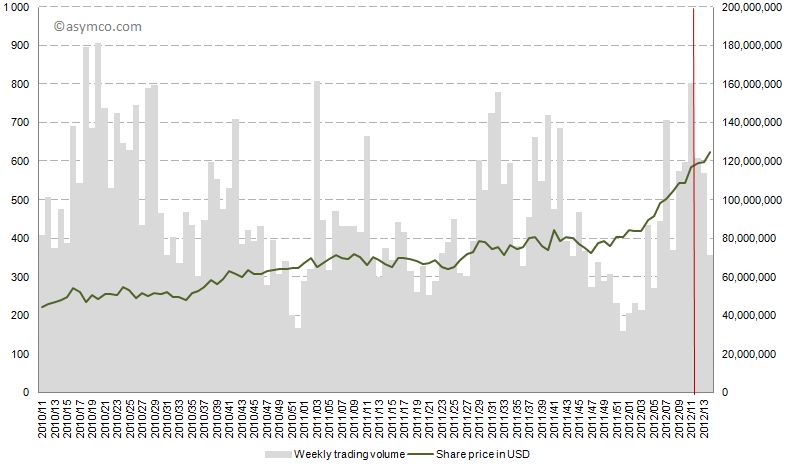
However, as the following chart shows, the share price climbed continuously before and after the dividend declaration of March 19th (shown in red). Trading patterns did not show unusual highs or lows. In fact, after March 19th the trading volume decreased on a weekly basis.
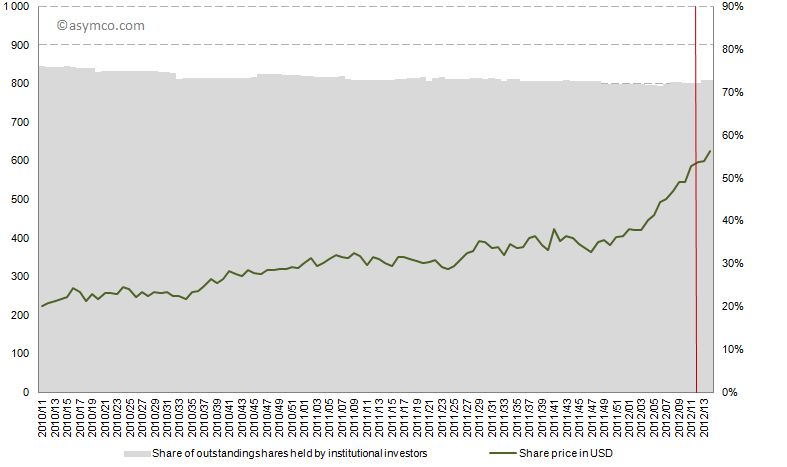
The other indicator is institutional holdings. The share of institutional investors as percentage of all outstanding shares did not increase significantly, and has been in an overall decline since late 2010.
But this lack of visible response to the decision should not be surprising.
Dividends are a tool to adjust capital structure based on optimal investment decisions. Dividends do not add value. The value of a company reflects the perceived net present value of all free, future cash flows. Whether the cash is in or out of the company is immaterial to its value. In either case the cash belongs to shareholders.
What the market is reflecting is fundamentals, not any change in liquidity due to "more buyers" available. For a long time the fundamentals were not accepted as sustainable. The best explanation for the rise in the share price is therefore that the company's future is now becoming clearer and a cloud of doubt is being lifted.