A complete market overview will follow when all the top tier vendors report the last quarter, but in the mean-time here are some data that are available:
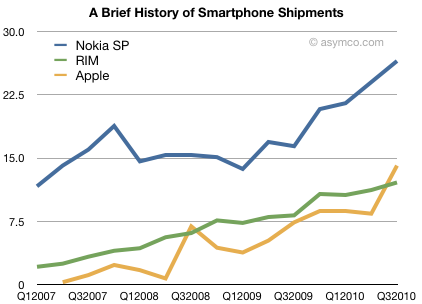
Smartphone volumes for Nokia, Apple and RIM:
Whereas Nokia is often criticized for being weak in smartphones, the fact is that they have grown at a decent rate over the last two years. In fact, they've opened a gap with RIM. Apple has increased share but it will take quite a while to overtake Nokia.
So why is Nokia's smartphone performance so under-valued? Partly it's because ASPs have been dropping. A lower price and lower margin is sometimes seen as a sign of weakness. But Nokia has had a strategy of expanding into more price brackets in their core markets (i.e. outside the US). Half of Nokia's smarpthones are sold through distributors not operators and probably end up being sold unlocked and unsubsidized. Price matters in those markets.
The other problem that Nokia takes a beating over is that their products don't get used as smartphones. Many are sold without data plans at all which makes one wonder what exactly makes their phones "smart". So many of these 100+ million/yr. smartphones are really hired to do a feature phone job. They're "overqualified" and thus underutilized. The statistics in terms of app downloads, browser and ad impressions all lag as a result. The ecosystem suffers.
Lastly, they are all but absent from the US. Due to accidents of history (CDMA) and various mistakes, Nokia never got a foothold in what turned out to be the most important mindshare market. A decade ago the US was a mobile data backwater, with lower data ARPU than Nigeria. It was not a market Nokia felt particularly deserving of investment. In hindsight, this was a big mistake.
But these knocks against Nokia still should not detract from the fact that they do sell a lot of Symbian phones. Distribution still matters as does having 600 operator customers. And in many parts of the world, Nokia is synonymous with mobile phone. Many of those buyers will migrate to future Symbian devices.
My mobile platform thesis has been that as long as penetration is not 80% and as long as operators are still in the value chain, mobile platforms will remain fragmented and split shares. The graph above shows exactly how that has evolved among the top three smartphone vendors.
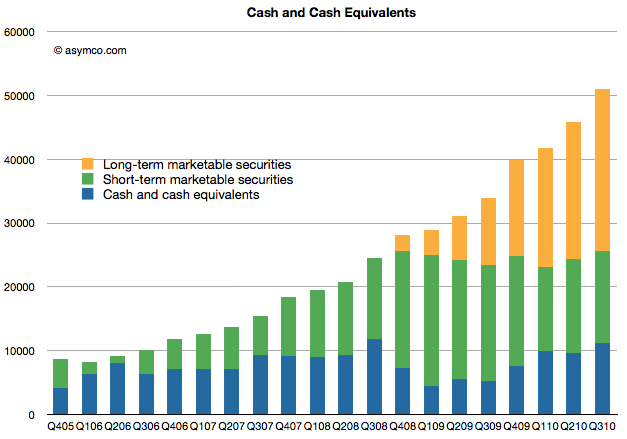
During the last quarter the company added $5.2 billion to its cash, long- and short-term marketable securities accounts for a total of $51 billion. This amounts to about $53 per share vs. $49.43 per share in July (making the share price about $250 ex-cash).
I would caution again that when reading commentary about Apple's cash that many observers exclude long-term securities from the "cash" total.
To see the difference in the total, this chart breaks out the three different accounts over time.
Note that without long-term securities, the cash wold appear to have stayed roughly constant since Q4 2008.
Also note that in the third quarter of 2006 the company had just crossed $10 billion. The cash equivalents are now over five times bigger. The amount also doubled since Q3 2008. It is the largest cash hoard of any technology company.
The question of what this cash will be used for remains open with management repeating that opportunities might arise to do something big.
Following earnings growth of 68%, after hours trading of AAPL at $300/share shows a P/E of 19.8. The company added over $5 billion in cash for a total of $51 billion or $52.9/share.
Excluding cash from the price of $300 leads to an enterprise value of $249 and a trailing twelve months earnings of $15.15. The ex-cash P/E is therefore 16.44.
P/E/trailing Growth is 0.29.
My guess is that this is keeping AAPL cheaper than the S&P 500 on both P/E and P/E/G.
One of the most hotly debated subjects in the mobile phone business is the importance of market share. It's also a topic of lore in the PC industry. Briefly the two arguments are:
Market share matters more because it drives network effects which ultimately drive competition out of the market, creating the opportunity for monopoly rents.
Profit share matters more because profit is the only fuel that can drive innovation. Any macro downturn or shift in strategy can cause a company to cease investing in unprofitable projects.
The old disruptor's adage: "Be hungry for profits and patient for growth" is challenged by the equally disruptive: "Grow share with lower prices in exchange for new revenue sources."
There are many rich anecdotes to support each strategy, but how about some data? Fortunately we have some: the market and profit shares for vendors covering 80% of the world's largest technology market over a three year period. The vendors are a good proxy for the market, the time frame is long enough to cover seasonality and anomalies and the market is very big (over 1.2 billion devices) and very broad (world-wide).
The only question is how to measure success. One measure is how various strategies benefit the asset owners, i.e. the share holders. Benefit to society, employees and consumers are very difficult to measure. But share holder benefit is easily obtained by measuring change in share prices.
So, here are two charts:
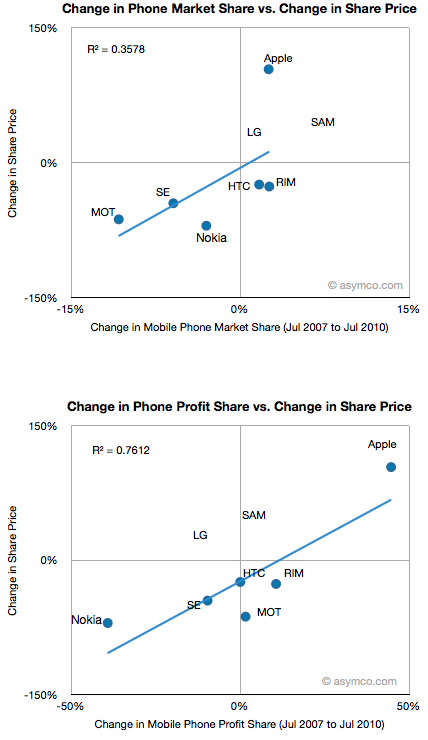
The percent change in market share vs. percent change in share price for the top mobile phone vendors.
The percent change in profit share vs. percent change in share price for the same vendors. (see note 1 for time frame discussion).
I showed the R-squared value of the correlations. (See note 2 regarding LG and Samsung). At r-squared of 0.36 share price is not well correlated to market share while at 0.76 it is rather well correlated to profit share. To a financial analyst this would seem obvious. After all, share price reflects the present value of future cash flows which are clearly coupled to profit and hence to profit share growth. However, as many technology observers would point out, market share determined the success of Microsoft and Google, and to some degree Nokia.
High market share can cause competitors to be starved of components or ecosystem developers. At the same time, high profit share can cause competitors to be starved of capital.
What does this analysis add to the argument? Note that this data covers a hardware business. Is hardware relevant? It does not scale as rapidly and has a short shelf life. It's also notoriously difficult to distribute. However, outside of the service revenues for cellular voice and data, device hardware is the only pool of money that has any material dimension in the industry. It's also the pool of money with the highest margin in the industry. For the time being and the foreseeable future, hardware is the only business model worth anything in mobile computing.
The data shows that in this particular but substantial market profit share is closely correlated to shareholder value creation. It also shows that profit loss is closely correlated with shareholder destruction. The dominant data comes from Apple and Nokia, which appear to be polar opposites in performance on both measures.
In other articles I've shown how profits have shifted from incumbents to entrants in the smartphone disruption. This shift has resulted in direct benefit and loss to the owners of the two asset classes. To suggest that market share alone is a determinant of "success" in the device market must exclude the effect on shareholders and, ultimately, the management and employees of the companies concerned. The virtuous/vicious cycles will be fed by the profit variable more than any other.
I don't think the market share argument holds water in this market and this data supports my belief. It may be that as value shifts over time away from hardware the benefit will shift as well, but business models alternatives to hardware have not emerged after ten years of experimentation. If anything, the idea of selling hardware as a way of capturing service revenue was pioneered by RIM and perfected by Apple. Nothing I've seen so far is challenging this model. Whoever attempts to siphon the device pool of money (which has remained fairly constant over the smartphone disruption) needs to solve system-wide problems like the dependence on the network and the life-cycle of portable electronics.
----
Notes:
The dates when performance was sampled are are July 1 2007 to July 1 2010. The latest quarter (3Q10) has not been included in this data as it has not been fully reported. The data will be updated with the latest quarter as soon as it's possible.
For many competitors the share price is dependent on more than performance in the mobile phone market. In particular, LG, Samsung, Motorola and Apple have diversified product lines which affect their share prices. Two of those companies (LG and Samsung) are conglomerates and their share performance is dominated by businesses other than mobile so I did not include their data in the correlation measure (though their place on the chart is shown). Motorola and Apple's stock prices were, to a very large extent, driven by their mobile phone performance over the same period so their data is included in the correlation analysis. The other vendors have been primarily focused on mobile phones.
"Media tablet hype around devices such as the iPad has also affected consumer notebook growth by delaying some PC purchases, especially in the U.S. consumer market. Media tablets don't replace primary PCs, but they affect PC purchases in many ways," Ms. Kitagawa said. "At this stage, hype around media tablets has led consumers and the channels to take a 'wait and see' approach to buying a new device."
Fascinating. I'd love to hear more about the non-iPad "media tablets" that delayed PC purchases last quarter. Maybe I don't get out enough.
But more to the point, let's combine the data from Gartner and the forecast for iPad.
I show below the impact of the iPad on PC vendor sales. I'm using my own estimates of world-wide PC sales (you can see other estimates here (Apple 2.0))
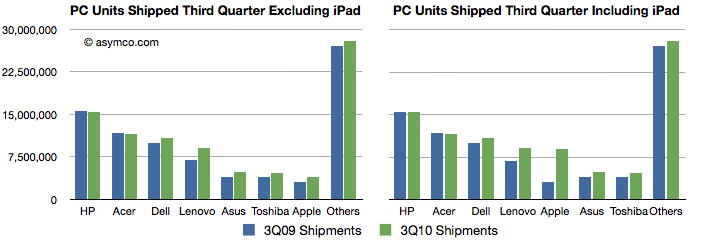
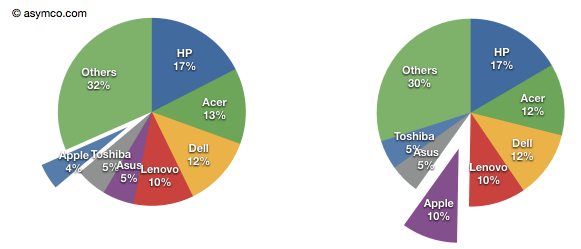
The world-wide PC units shipped without and with iPad:
When including the iPad Apple goes from 7th to 5th ranked, and with 50% growth clearly within shot of top rank next year.
Now I look at PC unit shares:
With the iPad Apple goes from 4% share to 10% share. Again, within striking distance of number one or two in a year.
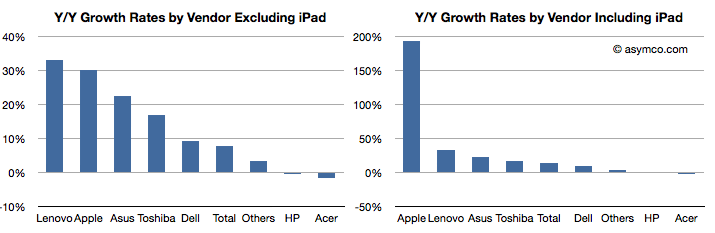
Finally, growth rates:
Apple's share growth goes from second to first but also several times higher than any of the others.
When Gartner spins the iPad as a "Media Tablet" it's clear that the device is disruptive. Reminds me of what Gartner thought about Smartphones four years ago.
I cannot think of a better endorsement for an investment than a snub from Gartner.
Acer chairman J.T. Wang recently predicted that Apple’s share of the tablet market would decline precipitously as new rivals emerge, falling from nearly 100 percent to 20 to 30 percent.
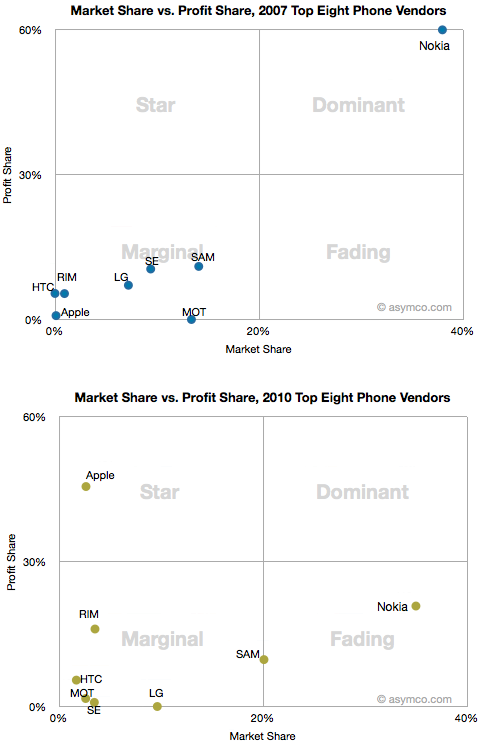
I plotted the vendors on share of market and share of profit axes in two different points in time: Q2 2007 and Q2 2010. I further broke the chart into four quadrants as shown:
I chose to label the quadrants to indicate the possible categorization of the companies.
Dominant: large market share and large profit share
Star: low market share with large profit share
Fading: high market share with low profit
Marginal: low market share and low profit
It's interesting to note the shift over the time period of the eight vendors. Whereas Nokia moved from Dominant to Fading, only Apple rose from Marginal to Star. The Marginal players dispersed their placement with Samsung moving laterally toward Nokia while RIM followed in the Apple trajectory and increased profit share while maintaining relatively low share.
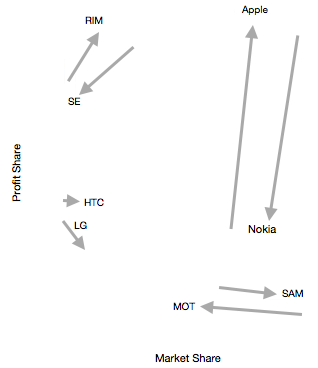
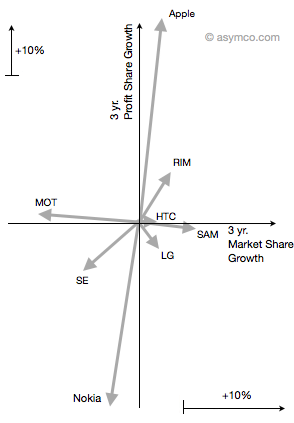
Thinking about motion around these two dimensions could be reduced to a vector model. If each vendor is represented by an arrow showing direction and distance moved, we can compare each vendor vs. a symmetric competitor which might account for the loss or gain of share.
The vectors can be paired as follows:
Although the data does not contain all market participants, the shifts in share are quite closely conserved with the vector magnitude (arrow length) and angle (direction) paired. Note how Nokia and Apple swapped Profit without too much impact in Units volume. Similarly, RIM and Sony Ericsson traded profits and volumes quite symmetrically. Samsung also took volume while Motorola lost it. HTC and LG did not change positions dramatically.
Finally, moving all vectors to the same origin leads to this view of share gain/loss over three years in two dimensions:
It becomes quite easy to see who the winners and losers are and by how much.
This model is only an observation of the shifts in market power and is not conclusive about where share was gained or lost, however there is compelling symmetry which also matches the intuition of observers.
Of all the public statistics about platform share, Share of web use must be the most important measure for Google. The more browsing people do, the more searching they do and if Google search is most likely for a platform then the more income Google derives from that platform.
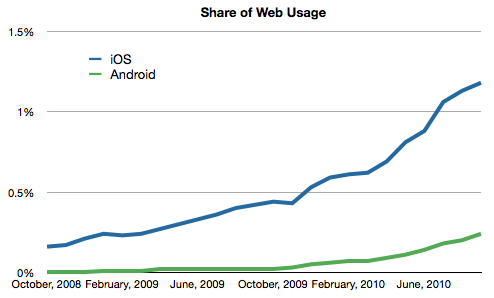
NetMarketshare.com has offered an insight into the split between Android and iOS as search platforms and it shows how iOS is still five times more likely to yield search revenue than Android. That multiple is likely to shrink as the gap narrows, but it still demonstrates the power of iOS to drive Google's bottom line. It's no wonder then why Google has renewed their default placement of Google search in mobile Safari (a guarantee they don't seem to share with all Android licensees.)
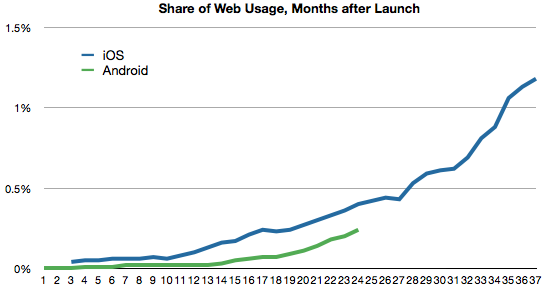
But Android launched later than iPhone, so everyone should be asking how rapidly the share of Web has grown since the start of each platform. When iPhone launched in 2007 it was almost competing with mobile web non-consumption. The alternative mobile browsing experiences were so bad that it's hard to remember anyone putting up with them. A year later, the bar was set higher and Android filled a vast chasm of demand for mobile browsing for people who could not buy an iPhone.
At the same point in the life of each platform, Android seems to be exploding in units sold. With this proliferation of Android licenses, it should be interesting to see if their unit share numbers are reflected in web share numbers. So far the story is not convincing. The growth in Web share is not pacing faster than iOS achieved at a similar point in time.
So far, 24 months into the life of each platform, iOS leads by almost 50% higher share.
iOS/mobile Safari has the advantage of iPod and iPad for distribution but that does not explain the relative lag of Android with respect to Web share as Android has a large number of SKUs.
It may be too early to draw conclusions, but anyone trying to analyze Google's strategy with Android should be paying close attention to this.
"You could buy your way in, if you are Microsoft," he said. "This is a market where a deep balance sheet will help Microsoft determine where they want to go."
He notes a good marketing campaign can do wonders for adoption, with Ehud predicting Microsoft will hit 15% market share in 2012 (about the same as the iPhone’s share now)
"With [Microsoft's] resources, I think they can sustain double-digit market share," he said.
He notes Microsoft, with $36.8 billion in the bank, could win market share in multiple other ways, including subsidizing phone costs.
He still however predicts Android will lead the pack with 30%, Apple next with 25%, and RIM, Nokia and Microsoft all having 15% of the market.
There you have it: users are so easily persuaded that a platform purchasing decision can be acquired via small outlays of cash for ads and subsidies for vendors and operators.
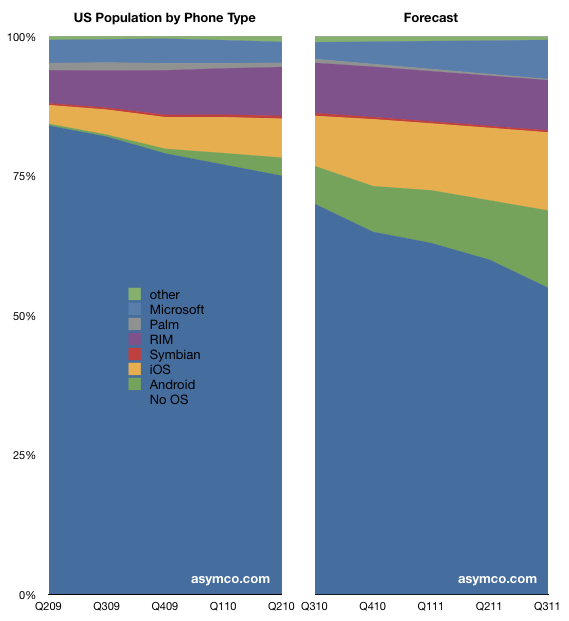
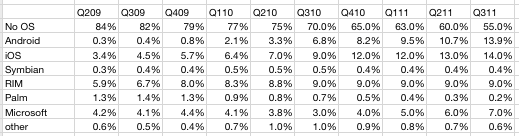
Since wireless subscriptions in the US are running at about 100% penetration, it's possible to classify the wireless subscribers as representative of the entire population. So it's safe to categorize the population of the US by the phone OS they carry.
The left part of the chart shows data from Nielsen that breaks up the population by the OS to date. The right part of the chart shows my estimate for how the platform shares will evolve by this time next year. The non-OS share will still be above 50% but it looks like it might shrink even more rapidly after reaching a tipping point of half the market. (Note these charts do not show quarterly sales but installed base of each OS).
My hypothesis remains that smartphone user bases will be balanced (or fragmented, depending on your point of view) by operator portfolio decisions and chronic constraints on distribution.
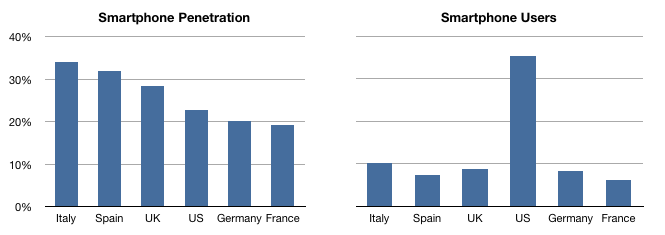
Following up on survey data showing that up to 25 percent of Americans have moved to smartphones, here is another survey (Comscore) which shows that US smartphone users are at about 23 percent.
Comscore also surveyed European countries, and we can compare the popularity of smartphones vs. the US.
I also indexed the share to population to show the relative populations of smartphone users across these countries.
It may come as a surprise to some that smartphones are more popular in the UK, Spain and Italy than in the US. Considering that these are countries with lower levels of disposable income, and that in Italy and Spain pre-paid plans are overwhelmingly more popular. Buyers in those countries are much more likely to pay full, unsubsidized prices plus 20% or more VAT. Overall the price differential for an Italian buying a smartphone vs. an American is likely to be a factor of 5. It gets even more peculiar when you consider that many Italians have more than one phone, with overall phone line penetration above 100%.
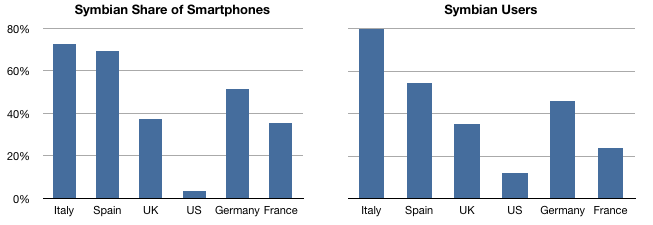
The explanation for this remarkable appetite for smartphone goodness is the early lead that Symbian had in Europe. Buyers who entered the phone market ten years ago became accustomed to upgrading their Nokia phones. Symbian phones were aspirationally positioned as feature-rich camera and messaging devices. Many were also purchased without data plans and were thus used as high-end feature phones. In other words, consumers in those countries were comfortable paying full price for unlocked Nokia devices and using them with multiple SIM cards.
This can be seen in the share of Symbian in these charts:
The data points to how normative behavior evolved and how different that can be even among culturally aligned Western nations. When looking at Asia and South America, it gets even more interesting.
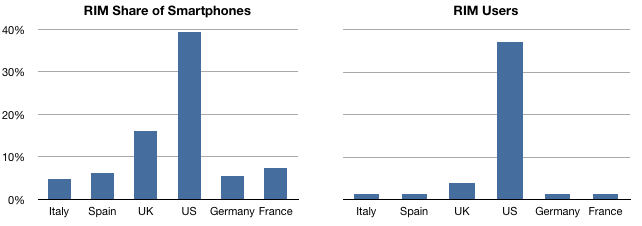
Whereas in Europe it was Symbian, in the US RIM got the ball rolling.
The contribution of these platforms in shaping expectations, not to mention pricing, for the iPhone and Android should be noted.