Asymco

Asymmetric Intelligence

share

  1. Were Nokia and Symbian always inter-dependent?

    Research · 8 comments

    Several readers pointed out that in my discussion on the market share of modular vs. inter-dependent market shares for smartphones, Nokia was incorrectly classified as having an inter-dependent software architecture since the Symbian platform is/was a modular component.

    The problem is that the relationship between Symbian and Nokia is not that of independent modules. Nominally, the two are independent and mutually exclusive, but, in practice, Symbian has always been so heavily dependent and influenced by Nokia that it's never been possible to declare its governance fully independent.

    I won't describe the full history since there are many other sources (good example here.) But I will point out that since Nokia licensed Symbian exclusively and Symbian obtained the vast bulk of license fees from Nokia, the relationship was one similar to a bilateral monopoly.

    Nokia's bargaining power over Symbian was always high enough to affect its operations. "Ownership" does not only infer a formal control over equity, and many would agree that Nokia "owned" Symbian even when it held less than 50% of the equity. The relationship was so tight, that even though there were other members of the consortium with board seats, the licensing by Nokia's competitors was always very limited. The only significant non-Nokia revenue for Symbian came from Japan where Nokia did not have a presence.

    After Symbian was effectively acquired by Nokia, the ownership became both de jure and de facto. The open sourcing of the Symbian code made it no less a Nokia operation than the open sourcing of Android makes it no less a Google operation.

    So for all intents and purposes, the relationship between Symbian and Nokia makes Nokia's smartphone hardware inter-dependent on Symbian's software.

    Now, given that the way the products are built in practice may be far from integrated, it would seem that Nokia's management captured the worst of both worlds: Modular implementation of an inter-dependent business. Nokia captured all the downside of modularity (poor integration and polish) without any of the benefits (e.g. flexible supply chain or lower R&D.)
  2. Competing with non-consumption: Can Apple sell 100M iPhones next year?

    Research · 30 comments

    [Wedge Partners analyst Brian Blair] also contends that Apple’s production forecasts suggest the company thinks it can sell 100 million iPhones next year. “While a staggering number any way you look at it, our checks reflect full calendar 2010 builds in the 48-50 million unit range,” he writes. “While this number can change and adjust downward or upward  based on demand, we believe it is incredibly bullish that Apple feels it is possible that they could see nearly 100% year over year growth for iPhone in 2011 as this would mean that exiting 2011, Apple would have approximately 10% share in the global handset market.”

    via Apple Can Sell 100M iPhones, 48M iPads in 2011, Analyst Says - Tech Trader Daily - Barrons.com.

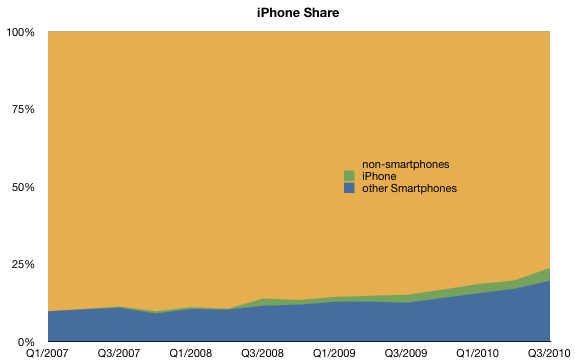
    Apple is, in my estimate, likely to sell at least 47 million iPhones in calendar 2010. (16 million in the current quarter, or 85% y/y growth).

    The 100 million in 2011 estimate assumes 100% growth on average. Is it really "staggering" to forecast another year of triple digit growth?

    The history of growth is one indicator. There the news is good: the product has been able to sustain that level of growth for three years.

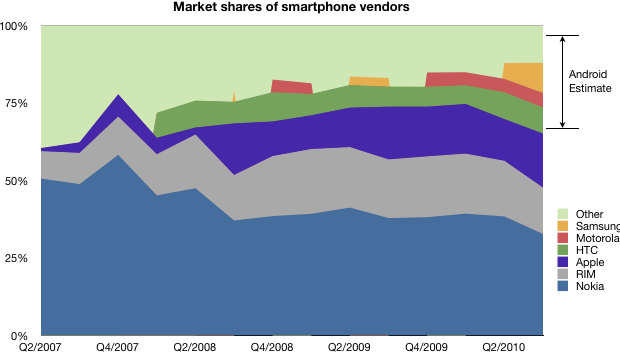
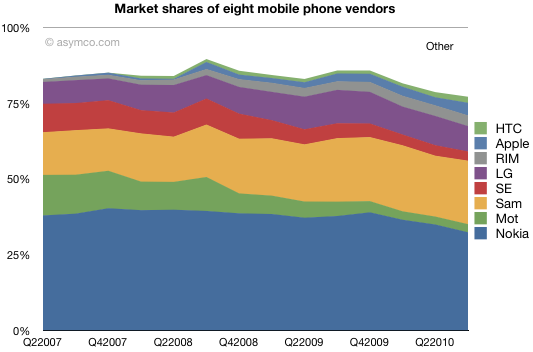
    The second indicator is room to grow. Apple largest competitor is smartphone non-consumption. This competitor holds 76% share, but is rapidly losing share. Consider the the following chart:

    I've heard the mantra that smartphones are not for everybody and that the vast bulk of consumers will opt for voice-oriented phones indefinitely, especially in low-GPD/capita countries.

    To this I point out that there are no technical obstacles to implementing smartphone technology in all price points nor that there are any constraints on distribution, network technology rollouts or shortage of capacity to produce these products for all current mobile users (5 billion at last count). I also believe that user demand for this level of product utility will shift rather more quickly than supply.

    So, in my mind, the headroom looks pretty good as well.

    Lastly there is the question of alternative platforms. I'll get to that shortly.

  3. Absolute value: the handset market stacked

    Research · 18 comments

    In previous posts I detailed shares for units, sales and profits. I also offered different ways to look at the data like rankings and profit "area" maps.

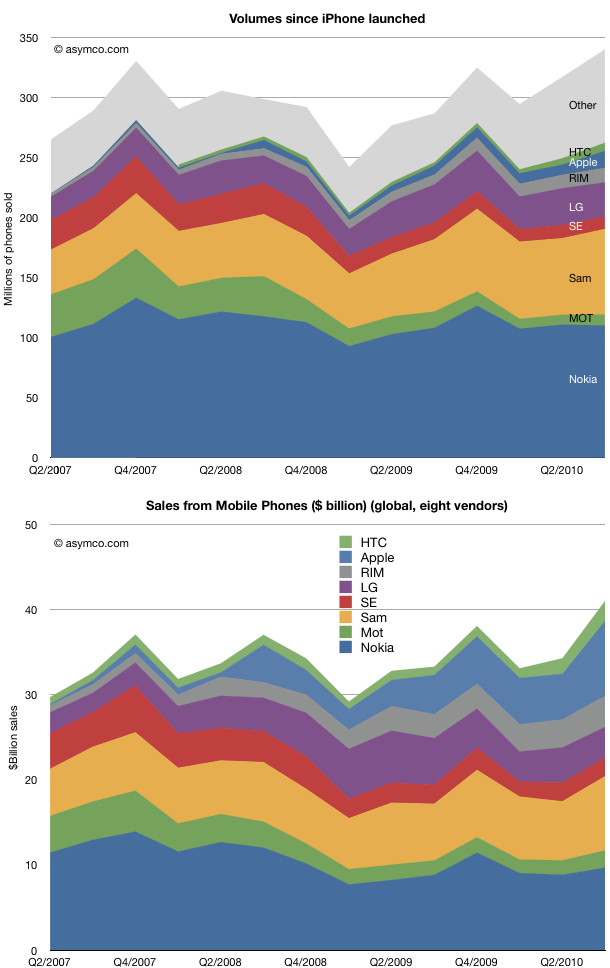
    This article is about the absolute numbers. What is the total market in terms of units sold, sales and operating profits.

    The time frame remains from the second quarter in 2007 to the third quarter of 2010. The same eight vendors are analyzed (with "Other" available for units analysis only).

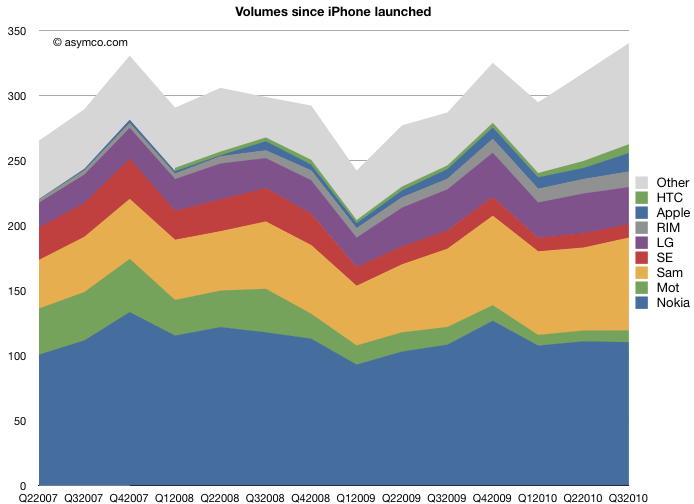
    The first observation is that the market grew to new heights in Q3. 340 million phones in the quarter means that we might be looking at a very good holiday season. The market was range-bound due to the recession and its over-hang, but there seems to be a good indicator of macro-level recovery

    On an individual competitor basis, the share snapshot pictures we saw earlier gave a good summary of the condition of competitors. Here we see the evolution of absolute units and sales over time. It's instructive to scan the two charts as a pair to see how units and sales are affecting the positions of the participants.

    I clustered the "pure smartphone" vendors at the top of the charts so you can visually separate them from the broader portfolios of the others.

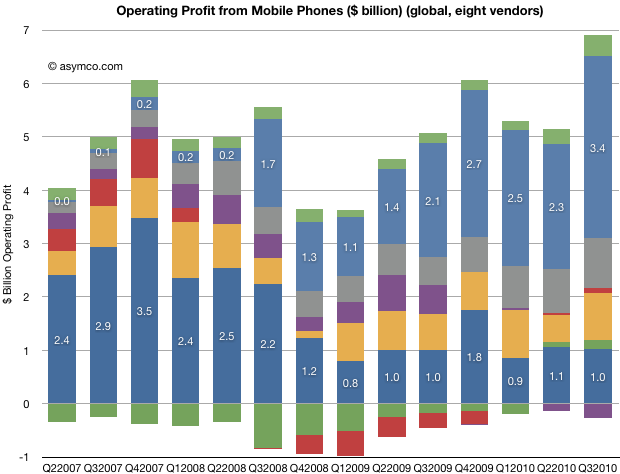
    Finally, here is the evolution of total profitability (operating) for the participants. I annotated Nokia and Apple for calibration.

    (note the color coding legend in the pervious charts).

    What is most impressive is how LG, Motorola and Sony Ericsson seem to be in the same boat. At the same time, Apple, RIM and HTC are outstanding in performance. And Nokia and Samsung are stuck in a dilemma. On the other hand, every vendor is different in many ways, and it's inaccurate to paint them with the same brush.

    Overall, we see a pattern of increased absolute value in the market. All but one vendor is profitable, and sales are increasing. A large part of the growth is due to the transition of the market to smartphones.

  4. Estimating Android market share for the third quarter

    Research · 10 comments

    Take a look at this chart. It combines the known shipment data with the total market size for smartphones as defined by Canalys.

    Knowing the platform/vendor make-up we can estimate the percent of the market that was Android.

    Note that the major unknown is still how much the platform hedgers (Samsung, Other) split their volumes between Android and Windows Mobile (yes, it's still being sold).

    Given this information, I would estimate Android share was around 30% globally. Canalys estimates 25%, which makes this analysis look reasonable.

    On a platform basis, Android gains were mostly at the expense of RIM, Symbian and Windows Mobile as we know that the iPhone share remained steady.

    Note that in years past the licensing vendors predominantly opted for Windows Mobile, a market that Microsoft wants to regain.

  5. iPhone's smartphone share continues to rise

    Research · 7 comments

    There is some confusion with the latest Canalys teaser press release. The implication is that Apple has lost smartphone platform share due to the Android surge.

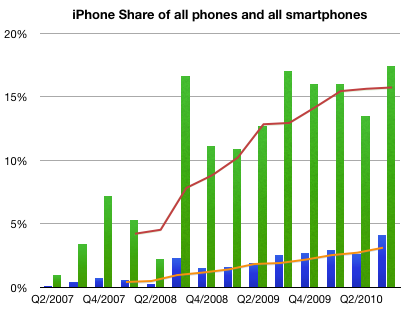
    Using the published data, it's easy to see that Apple has continued to increase share in both smartphones and handsets as a whole.

    I used green bars to represent quarterly share of smartphones and blue bars to represent quarterly share of all phones.

    I used orange line to show trailing four quarters (TTM) share in regular phones and red for smartphones.

    Here are the Q2 to Q3 changes in share for the vendors whose data is published:

    1. Nokia 38.4% to 32.7%
    2. Motorola 4.32% to 4.7%
    3. Samsung 5.11% to 9.71%
    4. RIM 18% to 15%
    5. Apple 13.5% to 17.4%
    6. HTC 8.65% to 8.41%
    7. Other 12% to 12%

    Sequentially, Nokia lost 5.6% of share, Samsung gained 4.6%, RIM lost 3% and Apple gained 4%, Motorola, HTC and Other remained largely unchanged.

  6. What's the opposite of price erosion?

    Research · 44 comments

    In the mobile phone industry, and indeed, in most technology sectors, price decline is a fact of life. Component prices tend to drop while their performance increases. This rapid obsolescence drives prices down constantly. Competition also plays a part as undifferentiated products are rapidly imitated.

    This phenomenon has its own term: price erosion. It's built into most business plans and forecasts.

    But how real is it? What are the implications in terms of market share if one accelerates price erosion or reverses it?

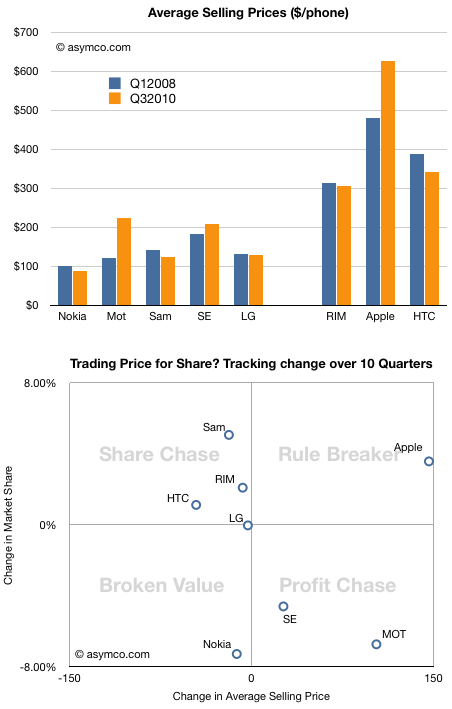
    This chart shows the average selling price for all the vendors whose data I maintain over a period of time.

    Normally, a drop in price is followed by an increase in share, and an increase in price by a drop in share. To test this hypothesis, I tacked on another chart that shows how share and price have been traded off in the market over the last ten quarters.

    Note how prices have dropped for all but three vendors. Two of those vendors (Motorola and Sony Ericsson) have lost share. One, Apple, has gained share. The rest, whose prices did drop, had increases in share, very roughly in proportion to the price drops. Again, we have one exception, Nokia, which suffered both price and share loss.

    Except for these two anomalies, the vendors are placed on the -45 degree diagonal that would show expected price elasticity in the market.

    I took the liberty of breaking the chart into four quadrants, and gave them names suggesting the strategies of the companies.

    Lying along the traditional trade-off axis are either Profit chasing or Share chasing strategies. Anomalies off the axis are either Rule Breakers or Broken Value propositions.

    This view of the companies allows us to abstract and think about market evolution.

    It would be interesting to think how these players will evolve over time.

    It's quite possible that LG will move into the profit chasing model (as they already indicated they would by building more smartphones). These strategies are typical of companies squeezed from the bottom and the top. I once called this group "the biggest losers" and suggested that they are the best target for Android.

    It's also possible that Nokia will move into the same quadrant, though their profit algorithm favors share above all else.

    The biggest question is whether Apple's rule breaking is sustainable. It's not clear whether they are interested in share as that does not have all that much to do with their definition of "greatness". But a platform strategy begs for volumes.

    This remains the biggest puzzle facing observers of this market.

  7. Trading Places: How Apple climbed into the Top Tier

    Research · 22 comments

    Apple reached fourth place in ranking of top phone vendors by units sold. I guess that makes it a "top tier" vendor.

    So how did it get there?

    Here is a chart showing how market share evolved since the quarter when iPhone launched:

    Units sold and shares.

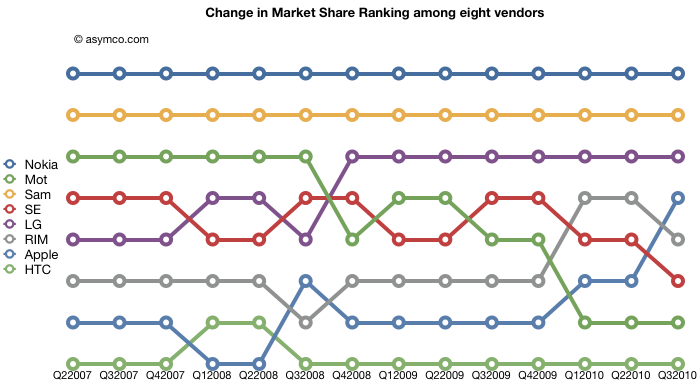
    The chart shows how this cohort of eight vendors has fared over the past 3.25 years. The squeeze on Motorola and Sony Ericsson is plainly evident. What's harder to tell is how the tiny players in the smartphone place fare in the ranking of "top tier".

    Here are the same vendors with their position in the volume leader league table over time:

    Lots of interesting patterns here which I'll leave to the reader to interpret.

  8. iPhone share of all phones sold is now above 4% and continuing to rise

    Research · 22 comments

    I am dead serious. I am now convinced that we have enough data to determine for a fact that Apple will not only see a dramatic decline in quarter-on-quarter sales in units of the iPhone this January-March quarter (which is the predictable pattern and no surprise) but that we will also see a decline in iPhone market share against at least HTC and Blackberry;  that would be demoralizing news in itself. I know now that the numbers are clearly stacking up so, that the annual sales level of iPhone units, will result in a decline in iPhone annual market share in 2010.

    via Communities Dominate Brands: iPhone in Memoriam: A History from its Peak Moment of Success. But who copied whom?.

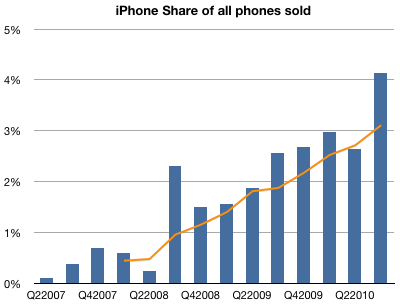
    Contrary to the loud and emphatic proclamations above, the data shows that the iPhone's market share gains have been steady.

    The following chart shows iPhone market share by quarter with a 4-quarter moving average. Total market size is reported by IDC.

  9. Wall Street's Infinite Loop: How AAPL is valued

    Research · 30 comments

    In the previous article discussing the growth scorecard, I left open the question of how Apple's growth is reflected in its share price.

    The approach to answering this question is to show how the share price correlates to that growth. The challenge for analysts has been that the company switched from subscription to current accounting for the iPhone (the largest component in its income statement). As they re-stated income and thus earnings, any historic review of P/E or other multiples of Earnings have to also be re-computed.

    So this is what I've done:

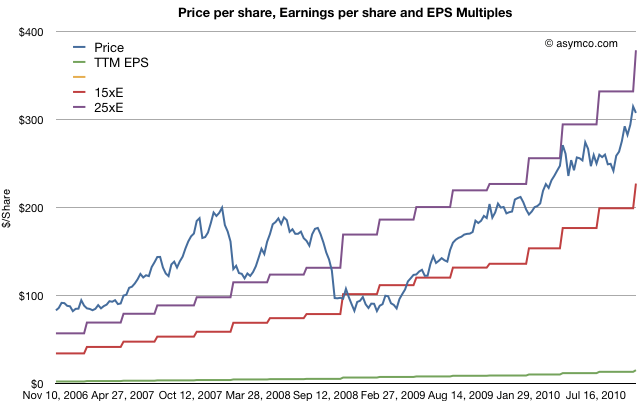
    The first chart shows Apple's price per share (blue) vs. its trailing twelve months earnings (green) and multiples of those earnings (15x and 25x).

    The chart shows how Apple was priced well above 25 P/E before October 2008 and has remained within the 15 to 25 multiple bands since the winter of 2008/2009. This seems fairly reasonable and the stock's rise is a cause of celebration for many, but a cause for concern for some. Is this rise in price matching a rise in value?

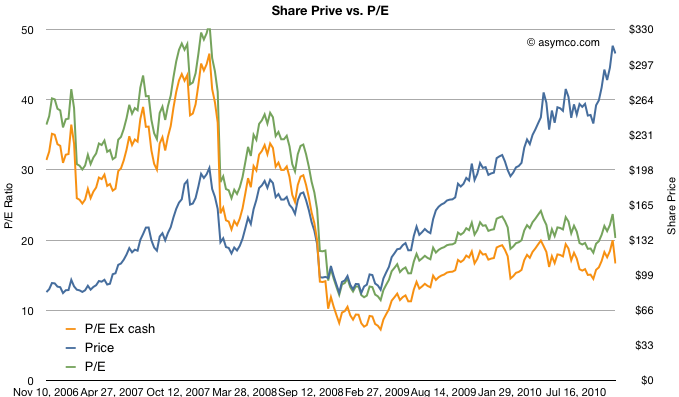
    To answer, we need a way to look at the valuation of Apple. One way is to plot the P/E ratio over time. That would show how the market perceives the value of the company (i.e. how many years' worth of earnings is built into the price) The chart below does that.

    I took the additional steps of plotting the P/E excluding cash from the price to show "P/E Ex cash" in the orange colored line and I also copied the Share price line from the first chart on this one for contrast.

    What the P/E analysis shows is that as the stock rose, it's P/E ratio fell. This means that the "valuation" of the company is quite a bit lower now than it was in 2006 and 2007. In fact, as a multiple of profitability, Apple's stock is nearly half as valuable now as before the recession.

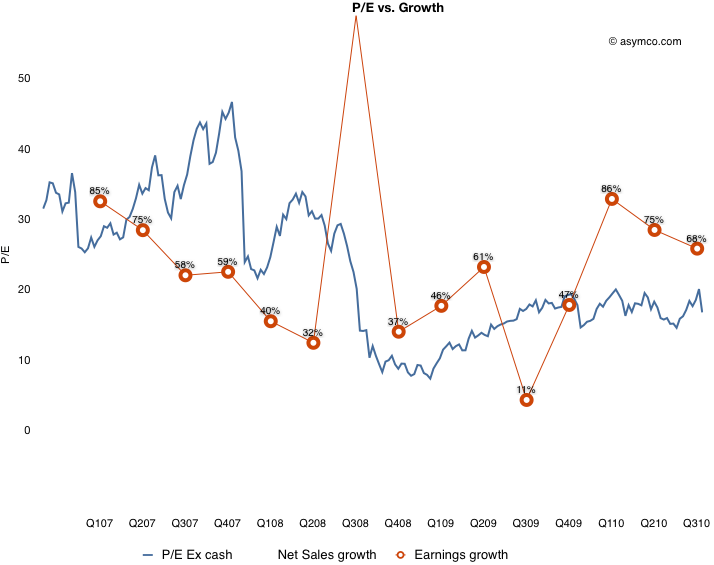
    Since valuation is usually correlated with growth, (P/E is often compared in a ratio with Growth) we need to see whether the P/E in the chart above matches the actual growth of earnings. Fortunately we have just measured growth with the scorecard.  Here are the two charts together:

    What this shows is that while earnings growth did slow down in the lead-up to recession (with the hugely anomalous 3G launch spiking growth to 155% in Q308 causing the year-later plunge to 11%), growth picked up again in the depths of recession and has moved back to pre-recession levels. The only difference is that the multiple assigned to the stock has remained near recession lows. This is visualized by the blue line being mostly above the red line pre-crash and usually under it post-crash.

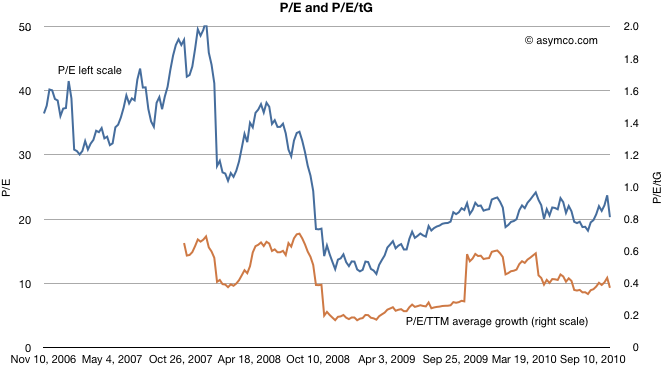
    To put a finer point on this, I plot the ratio of P/E and trailing growth (P/E/tG) in the brown line below:

    It shows that as a measure of valuation with respect to growth, Apple is trending down. A P/E/tG ratio of 0.4 and closer to 0.2 if we exclude cash shows very weak confidence.

    The only conclusion I can draw is that the market does not believe that Apple has significant growth opportunities. A P/E of 20 with consistent 70% growth is, to be blunt, damnation. For comparison, Amazon just reported 16% growth in earnings and was rewarded with a P/E of 68.

    Amazon notwithstanding, is Apple an anomaly? Is the disconnect between earnings growth and the stock price unique to Apple or does it apply to most other equities? Is pessimism about Apple a symptom of pessimism in general? I will suggest a way to answer this in a future article.

  10. Sony shares up on speculation of Apple interest

    Research · 28 comments

    TOKYO (Reuters) - Shares of Sony Corp rose nearly 3 percent on Tuesday as traders cited media reports speculating that the Japanese electronics maker could be a potential acquisition target of Apple Inc.

    via Sony shares up on speculation of Apple interest - Yahoo! Finance.

    There's a sucker born every minute. That phrase, (erroneously) attributed to a major benefactor of my Alma Mater, continues to ring true today.

    Although Steve Jobs once admired Sony, the company today contains nothing of value to Apple. A disruptor is unlikely to buy the company he just disrupted. Would Sony have bought Westinghouse? Would WalMart have bought Sears? Would Microsoft have bought IBM in the 1990's?

    When considering an acquisition the chances are that the asset being purchased is going to ask a premium price. So the buyer has to answer this question: what is it about the asset that makes it worth more than the market price?

    There are three (and only three) sources of value that a buyer can buy:

    1. The resources (intellectual, physical, contracts, channels or employees)
    2. The processes (the algorithm of how those resources are put to use)
    3. The business model (the way the assets and processes and applied to create profits).

    A company like Sony has some resources but its processes and business model are obsolete. Should Apple pay a premium for Sony's assets? I don't see a reason why.

  11. Visualizing Apple's Profitability

    Research · 26 comments

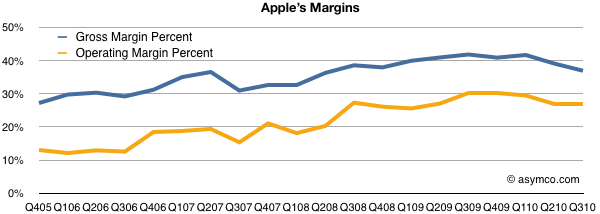
    After the last earnings report, many noted that Apple's gross margins dipped. Turley Muller noted in a letter to PED that the cause was probably the aggressive ramp in iPhone 4 production which broke new records at 14.1 million units.

    That may be. My estimate of iPhone margin shows it dropping to about 49% from the more usual 55% (sometimes even higher).  We'll never know exactly how much, but sometimes margins drop. RIM and Nokia are punished for drops in the GM percent so why shouldn't Apple?

    However, there are some other factors to consider: the overall margin is currently historically very high. As the high-margin iPhone makes up more of the total product mix, the overall margin should be growing. And it is. The chart below shows the trend since 2005. GM was in the high 20's five years ago.

    Note however the other margin: operating margin. After taking the fixed costs into consideration (which we saw to be shrinking as a percent of sales), Apple's bottom line profitability has been rising slightly more rapidly than the GM. It has plateaued recently but not dipped significantly.

    Also note that there have been dips in the past from which GM expansion resumed. One such dip was at the launch of the first iPhone in 2007, though we can't be sure that was attributed to the iPhone itself or to other factors like that most cited by management: components costs.

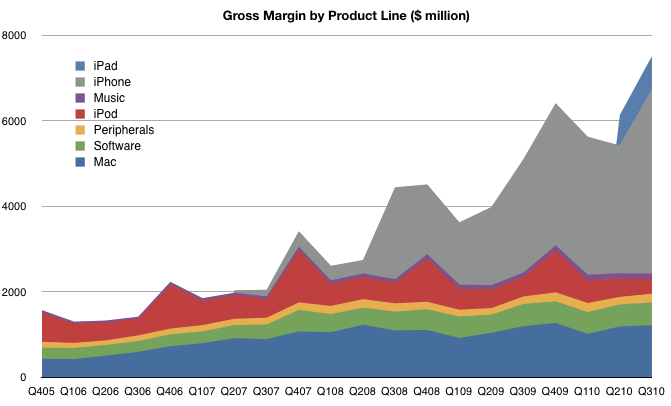
    However, the bottom line profitability is only part of the picture. It would be instructive to look at which product contribute how much. You won't see this analysis often because the gross margin by product is not published by Apple and it takes quite a bit of guesswork to get there.

    I maintain product-level gross margins and compute the overall GM bottom-up. The product-by-product line profitability is based on several assumptions which I won't detail here, but those assumptions lead to the following contribution chart:

    There are several takeaways here:

    1. The iPhone is huge (57% of gross profits). It is far more important than most people assume. Without it, the company would not have materially grown EPS since 2007.
    2. The "Music" which includes iTunes revenues is tiny. Many people assume that iTunes is a large contributor to Apple's operating profitability but operating margins on the store are 10 percent. Peripherals add more to the bottom line than the iTMS/App Store. The benefit of the iTunes/App Stores is in the hardware sold.
    3. Software contributes more now than the iPod. This is completely under everyone's radar but Apple's software business has been growing and with 80% gross margins (assumed) it's a big part of the profit picture.
    4. The iPad margins are lower than the iPhone. As it grows in volume, the profit share will grow, but it's a long way from being the profit share leader.

    This picture should also be a warning to Apple's competitors. If they seek to grow shareholder value and shift profits away from Apple they need to see just how much of that profit is captured in hardware. At the same time, they need to realize that it's the non-hardware businesses which make the hardware so desirable. Like it's products, Apple's income statement is very inter-dependent.