Asymco

Asymmetric Intelligence

smartphone

  1. The perils of possession without utilization

    Research · 184 comments

    [Updated with new charts including data from StatCounter and not NetMarketshare]

    Generally speaking there is an equivalence drawn between iOS and Android as technologies and even as user experiences. However, as I've pointed out on several occasions there is a very clear nonequivalence in business models and thus the "fuel" which keeps each platform running. But does this difference in models lead to some difference in the way the products are "hired" to do what they do. Does it imply anything about how the products are likely to evolve?

    I collected into one place all the data I could find about utilization (how much of a service and how often it's used) and possession (both in terms of current ownership and new acquisitions) of iOS and Android.
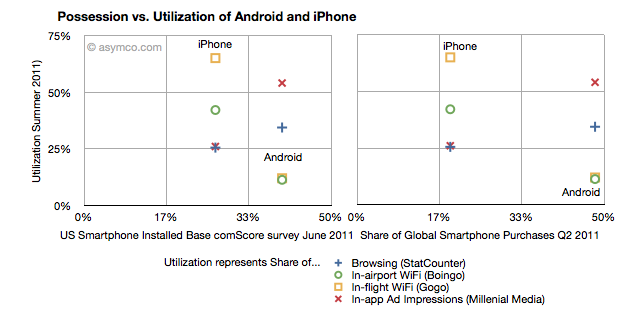
    Possession data comes from comScore survey data of share of US installed base of smartphones by platform at the end of June 2011 (first chart) and share of Global Smartphone Purchases as of Q2 2011 sourced from company reports and IDC (second chart).

    Utilization data (vertical axes) comes from August  2011 shares of mobile browsers (from StatCounter June 2011), in-airport WiFi associations from Boingo in June 2011 (iPhone vs. Android), in-flight Wifi associations from Gogo in June 2011,  and In-app Ad impressions from Millenial Media also in June.

    The charts are divided into nine sections corresponding roughly to "low", "medium" and "high" utilization vs. possession.

    The first chart compares a US-only population for possession vs. a mixture of global and US-only populations for utilization. The second chart compares a global population to the mix of US and global metrics.

    What I found interesting is that if we take ad impressions (red X) and browsing (blue +) data out, the two platforms are indeed quite distinct. iPhone has a medium level of possession with a high level of utilization of data services while Android has a high level of possession with a low level of utilization. The data is also nicely clustered.

    If we take just the ad impression or browser data then the platforms are quite similar: medium utilization for medium possession and high utilization for high possession. If the two platforms were to swap places in possession (i.e. market share) then they would probably also swap places in utilization (i.e. impressions).

    What the data seems to suggest therefore is that for data services the iPhone is a far more popular tool than Android. But for in-app ad impressions and browsing the products are used in a similar manner.

    The big difference is however that the services where iPhone utilization is high are those where users have to pay something. Most (if not all) of the ad impressions in apps are for free apps. So ad consumption scales with possession. But non-free services don't. This data seems to support the hypothesis that Android users are disproportionately less willing to spend money (note that the data does not say that users don't have money, but simply that they are not spending it). The other data which backs this hypothesis is that paid app sales on Android trail quite far behind the rate of purchase on iPhone. That could be due to payment problems in the Android marketplace but this data shows that there is some other effect as well.

    Why is this important?

    We can argue that Android is a low end product and that it disrupts and that this is consistent with that positioning. However it also indicates that the value is not in that ecosystem. And ecosystems are what sustain a platform in the long term. This debate will continue but I am reminded of other platforms which had similar patterns.

    Both the Blackberry and Symbian had high possession (in terms of share) with very low utilization. There were lots of surveys which showed that browsing, app downloads and "monetization" of services after the sale of the handset were low. Much was written about it being due to poor experiences. But learned observers today insist that the experience on Android is as good as on the iPhone.

    So why is there less economic participation from Android users? It's not just about these proxy services, but all manner of activities which enrich an ecosystem. Possession without utilization implies a product that does not do its job. Its features are not being absorbed. Why would that be?
     

  2. Mobile Impossible

    Research · 25 comments

    In yesterday's post about the "biggest mobile loser" I covered the exodus of users from non-smart devices in the US and EU5. I also said that what happens in those regions tends to happen in other regions with a time shift. In some regions it happens quicker but in most it happens more slowly.

    But can we be sure that there isn't vast non-smartphone growth in other regions? Well, no, we can't be sure. At least not without access to reliable data.

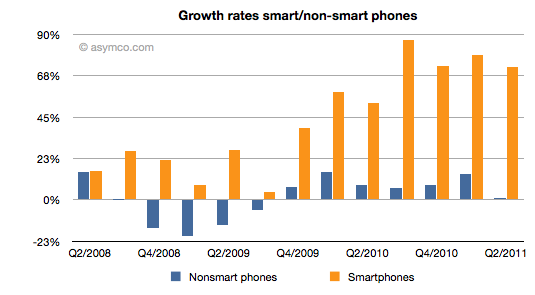
    But what we can track is the overall non-smart phone market and compare it to the smartphone market. Here are the growth rates of the two sub-markets:

    The difference is plain to see. We can also note that the non-smart market may be heading into a contraction--something noted by some analysts close to the market--but no real sign of that happening in smartphones.

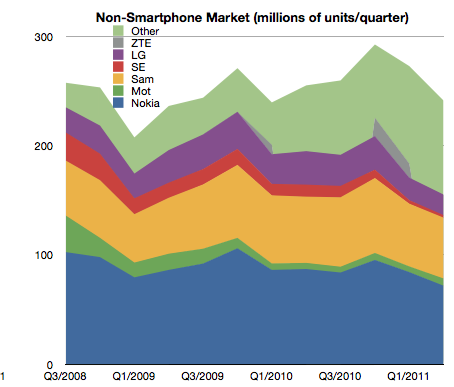
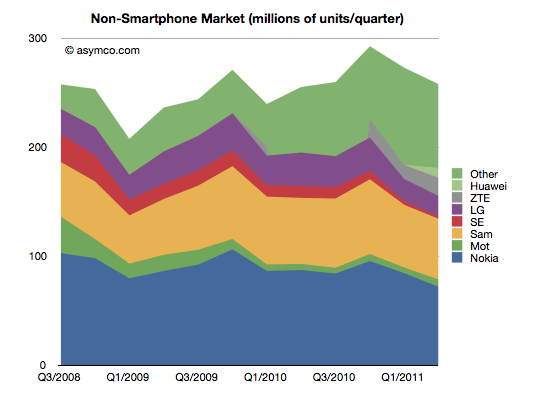
    Beside growth, we can also see actuals and the split of various vendors' volumes in the market.

    It's also clear that the top line has not moved much in the last few years. Next, the shares of the vendors.

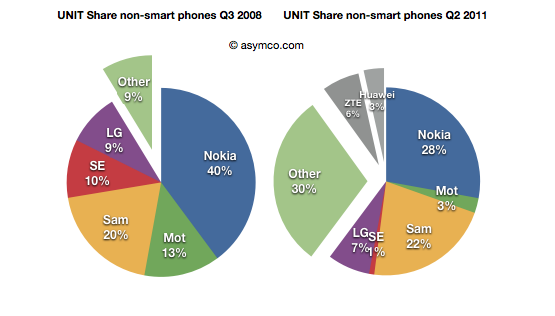
    Finally, the before-and-after share pies.

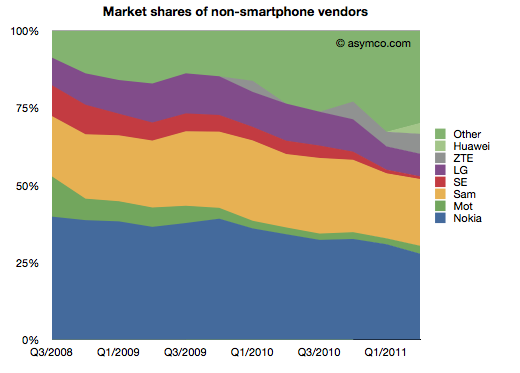
    We can see that the growth story, if there is one, is coming from low-end entrants. In late 2008 the main brands had 90% share. They now have about 60% (in a flat market.) The growth is all from "Other".

    What seems to be happening is that buyers in mature markets are swapping (or upgrading) from non-smart to smart and adopting new smartphone brands. At the same time, new users in emerging markets are increasingly adopting new non-smartphone brands.

    So the question for the incumbent vendors is extremely important: Facing them are low-end and smartphone entrants engaged in a pincer movement, with obvious success; can the old brands survive?

    The answer, as always, depends on whether the competition is symmetric or not. Low end competitors are usually structured around low cost structures. High-end competitors are exploiting new markets and new business models. For an incumbent to survive and fight on both fronts they'd have to adopt both of these models for themselves, simultaneously and quickly.

    We can see that Sony-Ericsson and Motorola (Google) have thrown in the towel on the low end. The question of dual-front strategy is mainly relevant only for Nokia, Samsung and LG. LG is on the ropes and may actually be ready to exit the market so that really means Nokia and Samsung. Nokia has signaled continuing interest in the non-smart market (citing "the next billion users"). Samsung also seems to be hanging in there. Can they do it?

    I cannot stress how difficult this is or how rarely it has been achieved. The two approaches are if not opposites then at least orthogonal. It's like Mission Impossible. You can't be a low cost global vendor while investing in R&D for differentiated platform-based devices. These are shaping up to be businesses requiring completely different skill sets. Few have the ability to host these skills inside one company. I can think only of one example.

  3. Biggest mobile loser? The non-smart phone

    Research · 19 comments

    Yesterday comScore published survey results for EU5 (France, Germany, Italy, Spain, UK) on smartphone use and installed base. The headline is very similar to what would be written about the US: Android had phenomenal growth over the last twelve months. I also noted that the apparent growth of Google (16.2% share change) seemed to be matched by an apparent decline of Symbian (-16.1% share change.) However the reading of the data is not so simple.

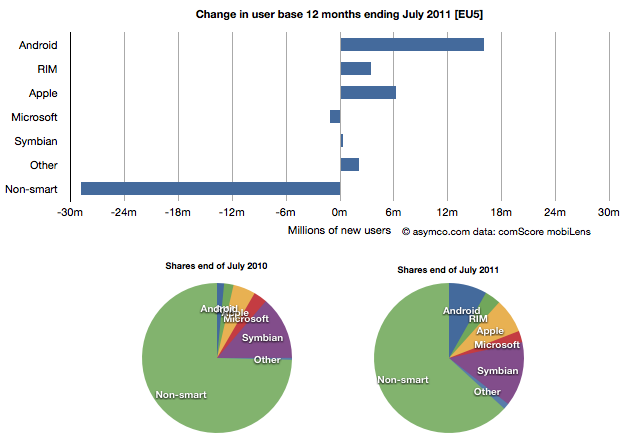
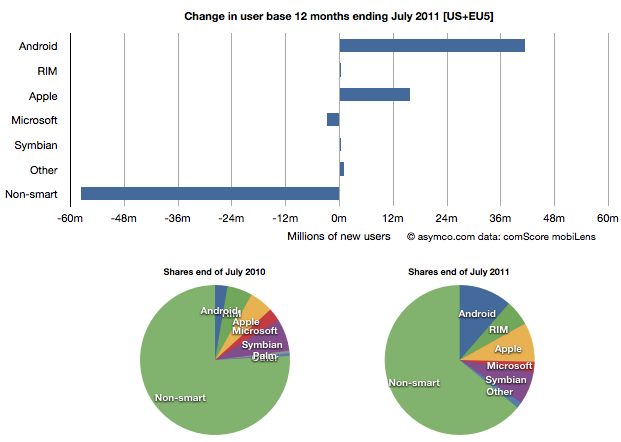
    In order to understand what has happened to usage, it's much more valuable to look at consumption and the actual number of users rather than change in share of a subset of the market. Consider the following charts:

    The bar chart shows that three platforms gained users in the last year (ending July) and that there were negligible losses in users by others. Negligible except for non-smart phones. A remarkable 29 million users moved from non-smart phones to smartphones. Those switchers switched into Android (16 million), iPhones (6.3 million) and RIM (3.4 million). Symbian even gained about 330k users. Microsoft lost about 1 million but its platform has not been actively promoted in that time.

    When seen as a pie chart, you can see how the usage shifted from non-smart to smart even more clearly. It does not appear that Android took share from Symbian at all. Android took share from non-smartphones. The table in the link from comScore leads one to conclude otherwise.

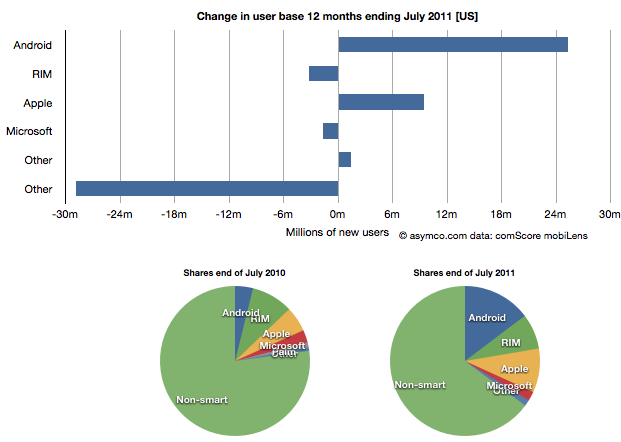
    I took the same approach to look at the US data (also from comScore). It shows a similar pattern.

    In the US, RIM was a net usage loser but its losses also paled to the losses of non-smart devices. In comparing with EU5 the pattern is very similar.

    I then combined the EU5 and US data and provided a view into the combined markets (note scale change from previous two charts.)

    This shows the change in platform phones more or less being from non-smart to Android and iPhones. The total population is 470 million people--not insignificant. The total number of non-smart devices abandoned is nearly 60 million in one year, which equals the total number of new smartphone users. That's 12% of most of the developed world switching in one year. If this keeps up, the "tipping point" when smartphones will outnumber non-smart phones in use in these large markets will be in another year.

    In terms of sales rate, the tipping point has already happened. Sales of smartphones crossed over in the US and Europe several quarters ago (November 2010 in EU5) and the trend is accelerating. Furthermore, if patterns of mobile technology adoption repeat as they have for the last two decades, emerging markets will follow in two to three years.

    This tipping point observation has been repeated on this site a number of times when reflecting on the data in the US. Now it's becoming clear that the same pattern has been underway in Europe as well.

    The big picture from the survey data is just how vast the demand for smartphones is. Some platforms are benefiting more than others in terms of share of growth, but the biggest mobile loser is clearly the non-smart phone. Not only is it an unprofitable product for almost every vendor, it is also being increasingly shunned by buyers.

    At the same time, at 450 million users we're still only looking at less than 10% of the market. As this pattern spreads globally the platform install bases will be measured in the billions of users.

  4. Tele Vision

    Research · 115 comments

    Every few months rumors emerge of another technology company attempting to create a new product centered around the TV. Apple's name comes up, of course, but so does Google. And Microsoft has been experimenting with no lesser degrees of vigor than the others. They all seem to be trying to make TV smarter, somehow.

    But I would argue that these efforts are misguided. Television is more than the TV set or a set-top box, or any box. It's more than channels or broadcasters or producers or aggregators or distributors. It's all of these things; plus more. It's a value network of great breadth and complexity. It's a highly modularized industry with well-defined business model boundaries and inter-dependencies. I would argue that its very breadth is what has kept it rigid and immune from disruptive change.

    If you look at each technological experiment to move to a new business model, they can all be reduced to the offer of an additional or substitutive module. There is no assumption made that the content being served will change. To put it in the context of mobile computing, it's like trying to introduce a smartphone in a world without data networks--where the only service to be served is person-to-person calling. Unlike the Smartphone which could only have emerged to leverage the Internet, TV has no "smart content" to leverage. The "smartness" has to be not in the box but in the programming.

    Of course, I don't mean there's a lack of good programming. What I mean is that there is no innovation in what a program is--the job it's hired to do. The way it and its distribution fits into a person's life. TV programs have not changed for half a century. They feature the same genres, the same duration, the same business model, the same series, format and scheduling and the same value chains as when "I Love Lucy" premiered in 1951. They assume people watch TV during the same time each day (while doing nothing else.) They also assume people are equally influenced by brand advertising and that audiences are largely homogeneous.

    Contrast that with other media. The song, the book, the game, the newspaper even the movie have gone through consumption changes which have been supported by disruptive innovations. The portable music player, the ebook reader, the console and the mobile phone and the internet in general have all allowed consumption to conform to new usage patterns. The jobs that music is hired to do has changed dramatically. These re-definitions of what media is used for caused dramatic changes in both the production and distribution and hence the way value is captured in media.

    TV, it seems, stands alone and immune.

    So it's not hard to understand why technology solutions have largely failed. Every attempt to make a change in a part of the value network has affected another part, which has led to resistance and reversal. Even Hulu, an innovative distribution method for content, owned by a group of incumbents, has had to scale back ambitions as the incumbents throttled it. Apple TV faces a stone wall of restrictions on distribution due to the inter-locking contracts content is bound by. Google TV has been largely shut out for the same reasons.

    And I won't delve deeply into the fact that TV is intensely parochial. There are few if any global brands, programs or regulations. Every country, region, city and town feels a need to localize its content and offer obstacles to external sourcing. Governments engaged with the industry so long ago that they've become co-dependent.

    Only one experiment is entirely independent of the current network: YouTube. YouTube does not rely on current programming. It has allowed a new set of producers and new form factors to emerge. It's still very rough and incomplete as a solution but it may get better. The growth is phenomenal and the business model is sustainable[2].

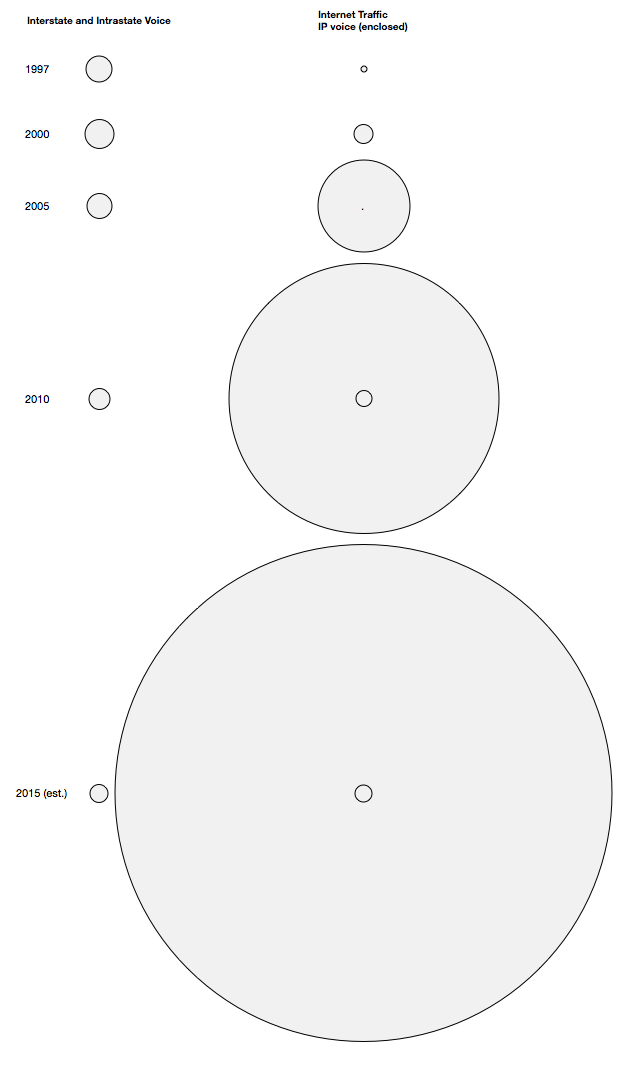
    It's hard to provide an illustration of how important this separate network effect becomes, and how long the time frame can be. The only proxy I can draw on is the story of how Voice over IP has grown in comparison to voice traffic over the switched network. The following chart shows how three types of traffic have grown in the US between 1997 and 2015 (est.): Interstate and Intrastate Voice (left column) vs. Internet traffic (right column) with IP voice inset inside Internet Traffic (areas represent relative traffic measured in Terabytes/month)[1].

    The estimate for 2015 shows that Voice over IP will reach 23,000 terabytes/mo. while PSTN voice will consume only 26,000 TB/mo. A negligible difference and one which will likely be in favor of IP over a global scale. The tail indeed does wag the dog.

    The only numerate conclusion that can be drawn is that the growth of internet consumption is so vast that it swamps other forms of media, even if within the internet, media itself is a minor component.

    So as far as having a vision of tele-vision, the answer is not to graft technology onto an archaic value network, but to build a new value network around new technology.

    ---

    Notes:

    1. Source: Lampert, O'Connor & Johnston, P.C. June 16, 2011 Ex Parte via ... The Tail Wagging the Dog--A comparison of PSTN and IP traffic from 1997 to 2015.
    2. I note with some dismay that Google feels it needs to dabble in the current value networks. Nurturing YouTube is a far better use of its resources.
  5. Nokia vs. Android

    Research · 82 comments

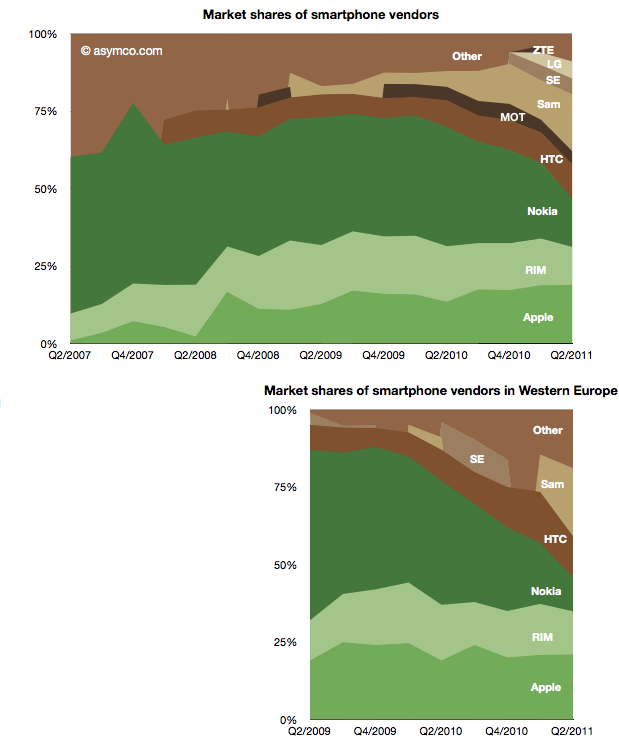
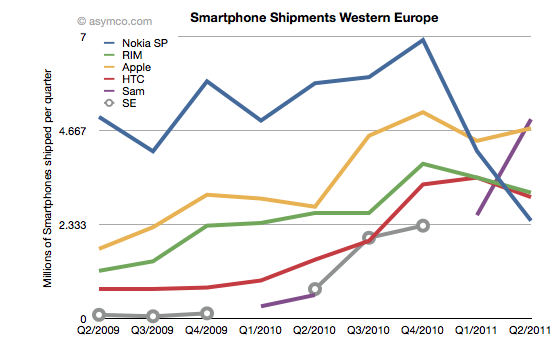
    Two years ago Nokia sold 30% of its smartphones in Western Europe. Today it sells 15% in that market. Its unit shipments went from 5 million to about half that and its market share went from 55% to 11%. Its rank in the market went from first to fifth.

    The fall is exceptional and dramatic. The two charts below show smartphone market shares. The top chart shows global share and the second shows Western European smartphone shares (European share data sourced from IDC).

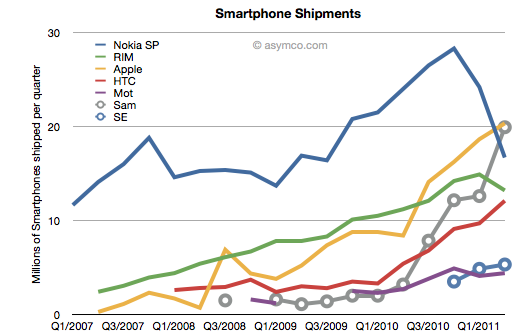
    The other perspective is shown the the following chart which shows actual units shipped.

    One striking thing is how volumes collapsed into Q1 and Q2 this year, coinciding with the public decision in February to deprecate Symbian. The other interpretation I would make is that within the two year time frame Nokia's share has been completely absorbed by Android, not Apple. Whereas most commentary shows Nokia suffering at the mercy of Apple, it's Android that took share in Europe.

    Can a Windows Phone portfolio turn Nokia's fortunes around? The first problem is that such a portfolio will not be available until next year. The second problem is that the competition will not be standing still. The third problem is that the market itself may not be growing as fast as expected.

    It's becoming increasingly difficult to see how Nokia can weather this turbulence and odds are against it.

  6. 155 million American mobile phone users don't use smartphones

    Research · 18 comments

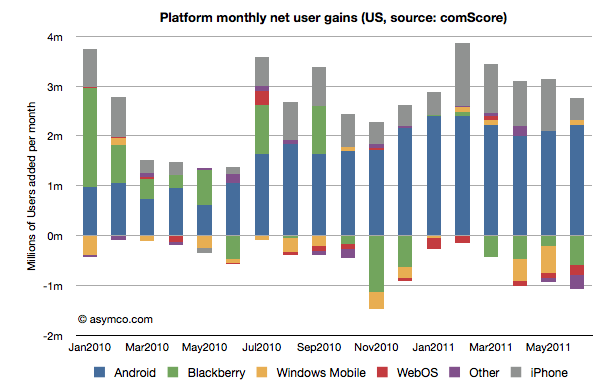
    ComScore's latest survey data shows the following net user gains in the US smartphone installed base:

    In summary, the key data points for June:

    • 2.8 million new smartphone users in three month period ending June (vs three month period ending May)
    • Of the total 78.5 million users, about one million switched platforms
    • RIM had a net loss of about 600k users
    • WebOS lost about 195k users
    • "Other" (mostly Symbian) lost 273k users
    • Windows Mobile/Phone reversed two months of decline and added 100k users
    • iPhone added 452k users (considerably below its approximately 1 million/month run rate for last four months)
    • Android gained 2.2 million users, consistent with average over 7 months.
    • Platform "churn" was at 1.36%, about average over three months

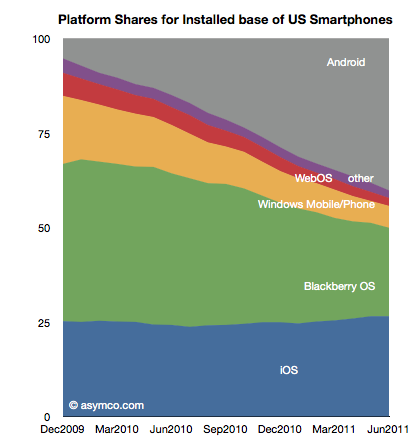
    Installed platform shares for the US market are shown in the following chart

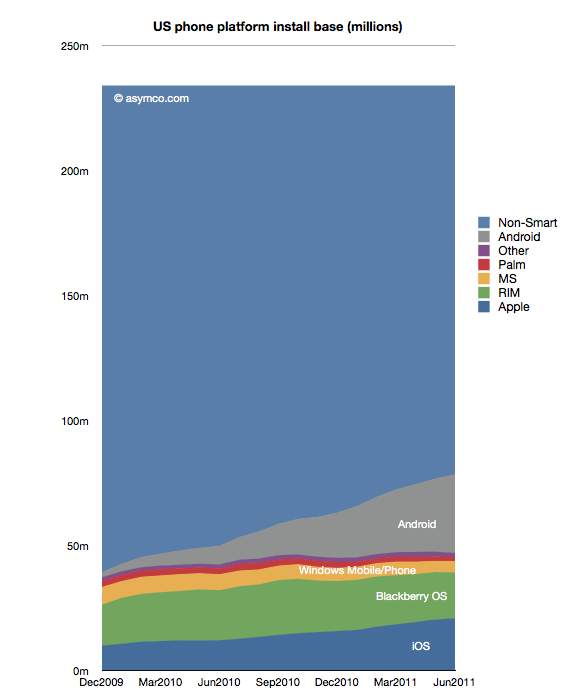
    Platform Installed base vs. non-smart devices is shown below:

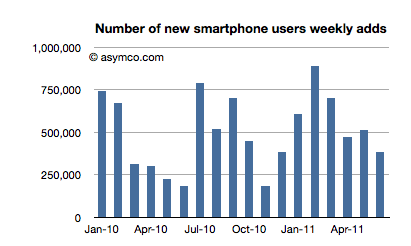
    The penetration of smartphones slowed down in June (though that seems to be seasonal). The following chart shows weekly smartphone adds (or feature phone losses as total user base has held constant.)

    Averaging the adoption rate over six months gives a "tipping point" forecast (50% penetration) of October 1st, 2012. That still means that 155 million American mobile phone users don't use smartphones.

  7. The Competition

    Research · 20 comments

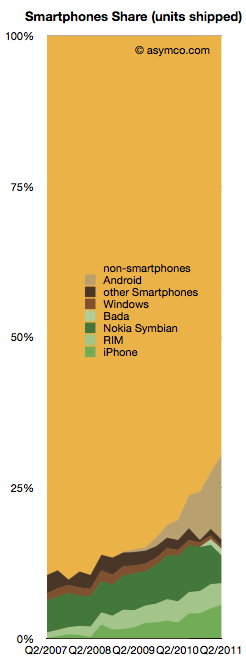
    Smartphones made up about 30% of global phone sales last quarter. That is a significant increase from 10% in Q4 of 2007.

    From this perspective, iPhone obtained 5.6% share, Android 14.2%, Nokia Symbian 4.6%, RIM 3.6%, Bada 1.1% and Windows 0.4%.

    The competition however still has 70.5%.

    The chart to the right shows the challenge remaining and the progress being made.

    The good news is that the non-smartphone market is not growing while the smartphone market is. In fact, the non-smart market has had a three year CAGR of 0% and a y/y growth of 1.0% and a sequential decline of 6%.

    The non-smart portion of each branded vendor's business is pretty dismal:

    • Nokia saw 17.57% decline y/y
    • Samsung's non-smart business declined by 8.14%
    • Sony Ericsson's dropped by a dramatic 80%
    • LG's fell by 38.56%
    • Motorola is the only one that grew y/y, by 17.86.

    The reason all these brands fell is because the unbranded vendors took their place. "Other" non-smartphones grew by 43%. They have been sustaining growth at the rate of 57% compounded over three years.

    The following chart shows the increasing share taken by the "other" vendors in non-smartphone units:

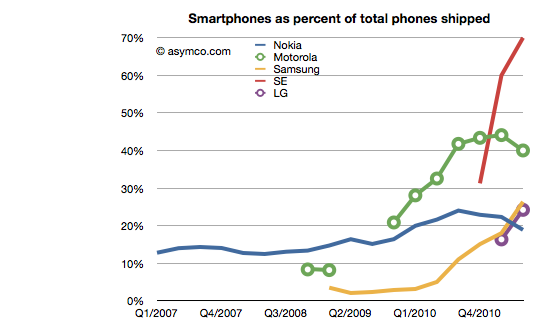
    The non-smart business is so dismal for branded vendors that I've been assuming that they will cease to build such devices in the near future.

    The trend is shown in the following chart which shows the percent of units for branded vendors which are smartphones.

    Motorola, Sony Ericsson and Samsung are fleeing to smartphones as rapidly as they can. LG is following as quickly  as possible as well.

    The only question remains with Nokia. While their smartphone business evaporates they've also made a commitment to the non-smartphone market and are thinking about "the next billion" users who, presumably, will not buy smartphones and will buy some variant of Nokia's Series 40.

    Targeting the low end may be commendable, but the question they need to answer is why would those next billion buy anything other than a low cost smartphone? And if not, then what's so different about the next billion?


  8. The Android and iOS pincer movement

    Research · 47 comments

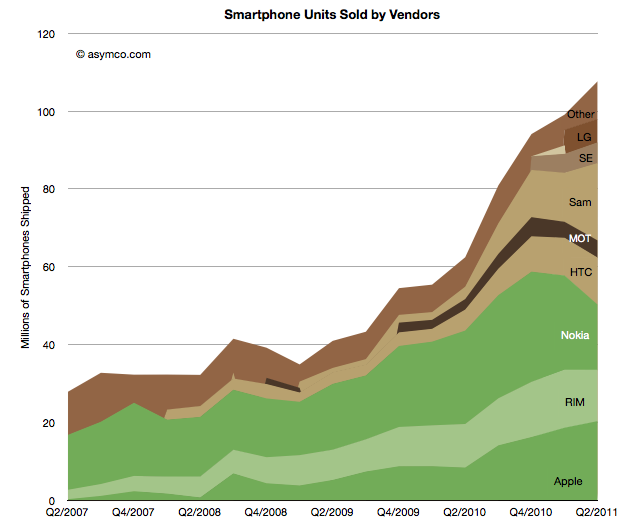
    Nearly all the data on smartphone shipments is now available for the second quarter 2011. Some fragments are still not public, including ZTE and Huawei (and any others) shipments. We also have estimates for the various platforms including an estimate for Windows Phone and Bada (though not for WebOS).

    This allows the following chart:

    Using the traditional color scheme which separates "integrated" from "modular" vendors, the chart shows overall volume growth and how the volumes are split among vendors.

    The market grew at about 73% y/y and 50% compounded over three years and 9% sequentially. The y/y growth rates for individual vendors were:

    1. Samsung 525%
    2. Apple 142%
    3. HTC 124%
    4. Motorola 63%
    5. "other" 29%
    6. RIM 18%
    7. Nokia -30%

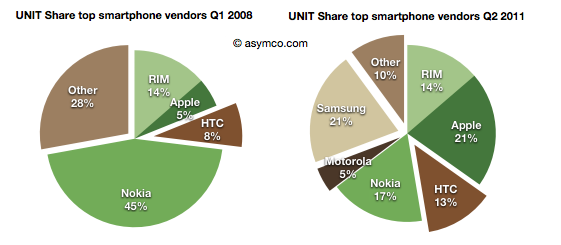
    In terms of unit share, the pie charts below show the before and after (three year span):

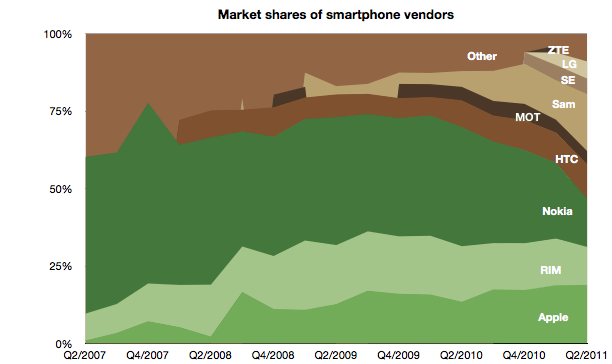
    And the stacked area below shows every quarter over a four year period.

    The story is largely unchanged since last quarter except perhaps in the rapidity or deterioration in Nokia's performance and Samsung's partial exploitation of that decline.

    It should be noted that not all of Samsung's volumes are licensed platforms. An increasing share of Samsung smartphone volumes is Bada, an internally developed OS.

    In the charts above I arranged the bars to place Nokia and RIM in the middle to show their double envelopment. A pincer movement is only an analogy but perhaps it's evocative of what's happening.

  9. The Samsung hedge: Estimating Bada for Q2 and hence Samsung's Android shipments

    Research · 28 comments

    The number of Bada phones shipped last quarter is not public, however some assumptions can be made that lead to plausible estimates.

    First, we know that Samsung shipped about 3.2 million smartphones in Q2 2010 and that total included Bada and Android (and perhaps even some Windows Mobile).

    Second, we know that there were about 19.9 million smartphones in Q2 2011.

    Third, Canalys published an estimate that Bada grew by 355% y/y.

    So if we knew how many Bada phones shipped in Q2 2010 we could derive the current Bada shipments and also realize how many of the nearly 20 million smartphones from Samsung were actually Android.

    The clue is in an estimate from December last year that suggested that there would about 5 million Bada shipments in 2010. Coming close to the end of the year, and from Samsung directly, we can be pretty sure the figure is accurate.

    Taking this 5 million and spreading it over four quarters could give us enough of an estimate. That makes 1.25 million quarterly units. If we assume some seasonality or increase toward the end of the year, a Q2 figure of 1 million might be more accurate.

    Therefore, applying the 355% growth rate yields a Q2 2011 estimate of 4.5 million Bada shipments and hence about 15.4 million Android devices from Samsung last quarter.

    Considering the increasing importance of Bada to Samsung, it should be clear that Android is not the only source of growth for the company and its transition of feature phones to Bada as well as Android is a key strategic driver for differentiation vis-a-vis low end entrants.

  10. The end of easy growth in smartphones

    Research · 176 comments

    At the end of last year I was saying that the smartphone boom was a tide that lifted all boats. That is no longer the case.


    But the big story is that there has been a clear non-seasonal counter-cyclical decline in Nokia and RIM's smartphone performance. RIM's steady rise has come to an abrupt halt. Nokia's decline has accelerate precipitously. So much so that Samsung and Apple have overtaken Nokia and RIM and it looks like HTC will overtake RIM within one quarter and perhaps Nokia as well.

    The fortunes of vendors is now clearly tied to the fortunes of their platform choices. Android has a spotty record with Samsung[1] and HTC having accelerated growth with Android, Motorola and Sony Ericsson have not rallied to a similar degree (though they did remain operational). But it's at least very clear that BlackBerry OS and Symbian are now a burden to their owners.

    The fact that not all vendors benefit from a boom indicates that the early, happy days are over. People are noticing that there is a difference between smartphones and are not buying any and all. An era of competition will follow. I hinted that such a shift would happen when a "tipping point" was forecast and that point has been reached in several mature markets.

    The consequences are that weaker platforms and vendors will come under increasing pressure.

    ---

    Notes:

    1. Samsung decided to stop reporting the number of smartphones they sell. They also refuse to report the break-down between different platforms--they sell Windows Phone, Bada and Android devices. The figure I gave to Samsung is 19.9 million units, higher than 19.0 and 19.3 million from other analysts.
  11. Apple captured two thirds of available mobile phone profits in Q2

    Research · 81 comments

    The major publicly traded phone vendors have all reported results for the second quarter. Based on the data available so far we can begin putting together a picture of the market.

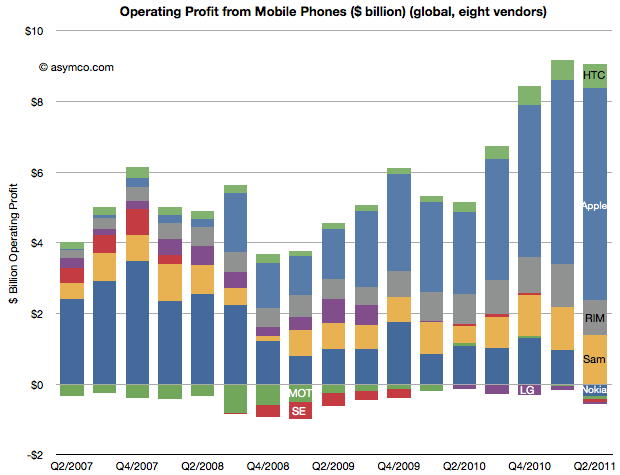
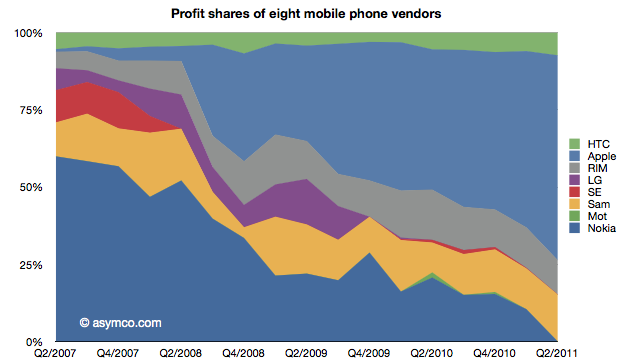
    The first picture I'll draw is usually the last: profitability. The following chart shows operating profit from the sale of mobile phones among the eight vendors I follow (Nokia, Samsung, LG, Sony-Ericsson, Motorola, HTC, Apple, RIM).

    This quarter saw a slight sequential decline in overall profit for the sector, but four vendors did not manage a profit from selling phones. Nokia, Motorola, Sony-Ericsson and LG all saw losses. The other vendors split the slightly decreased pie with Apple getting two thirds of it (66.3%)

    This share is up from 57% in Q1 and 50% in Q3 and Q4. Samsung's share went to 15%, though that's not a peak level historically. In Q1 2008 the company was at 21%. RIM was at 11%, a level in a range that has been unchanged for three years. Finally, HTC captured 7.4%, a new high and an increase from 6% since last quarter.  The profit share chart follows:

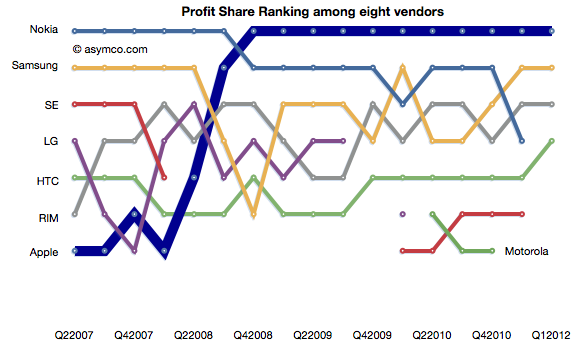
    The ranking chart for profitability follows:

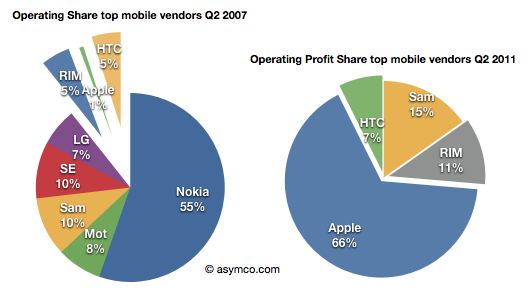
    Finally, the "before-and-after" view of profit capture showing the change in profit share over a four year period.


    The story remains largely unchanged from last quarter: Three companies which captured 11% of the profits before the modern smartphone era started (four years ago!) now capture 84% of the profits. Only one global brand phone vendor selling non-smart voice-oriented feature phones is still profitable however, as we shall see later, the only reason profits still exist for any vendor is due to the strength of their smartphone portfolio.