Asymco

Asymmetric Intelligence

smartphone

  1. Faster Followed

    Research · 76 comments

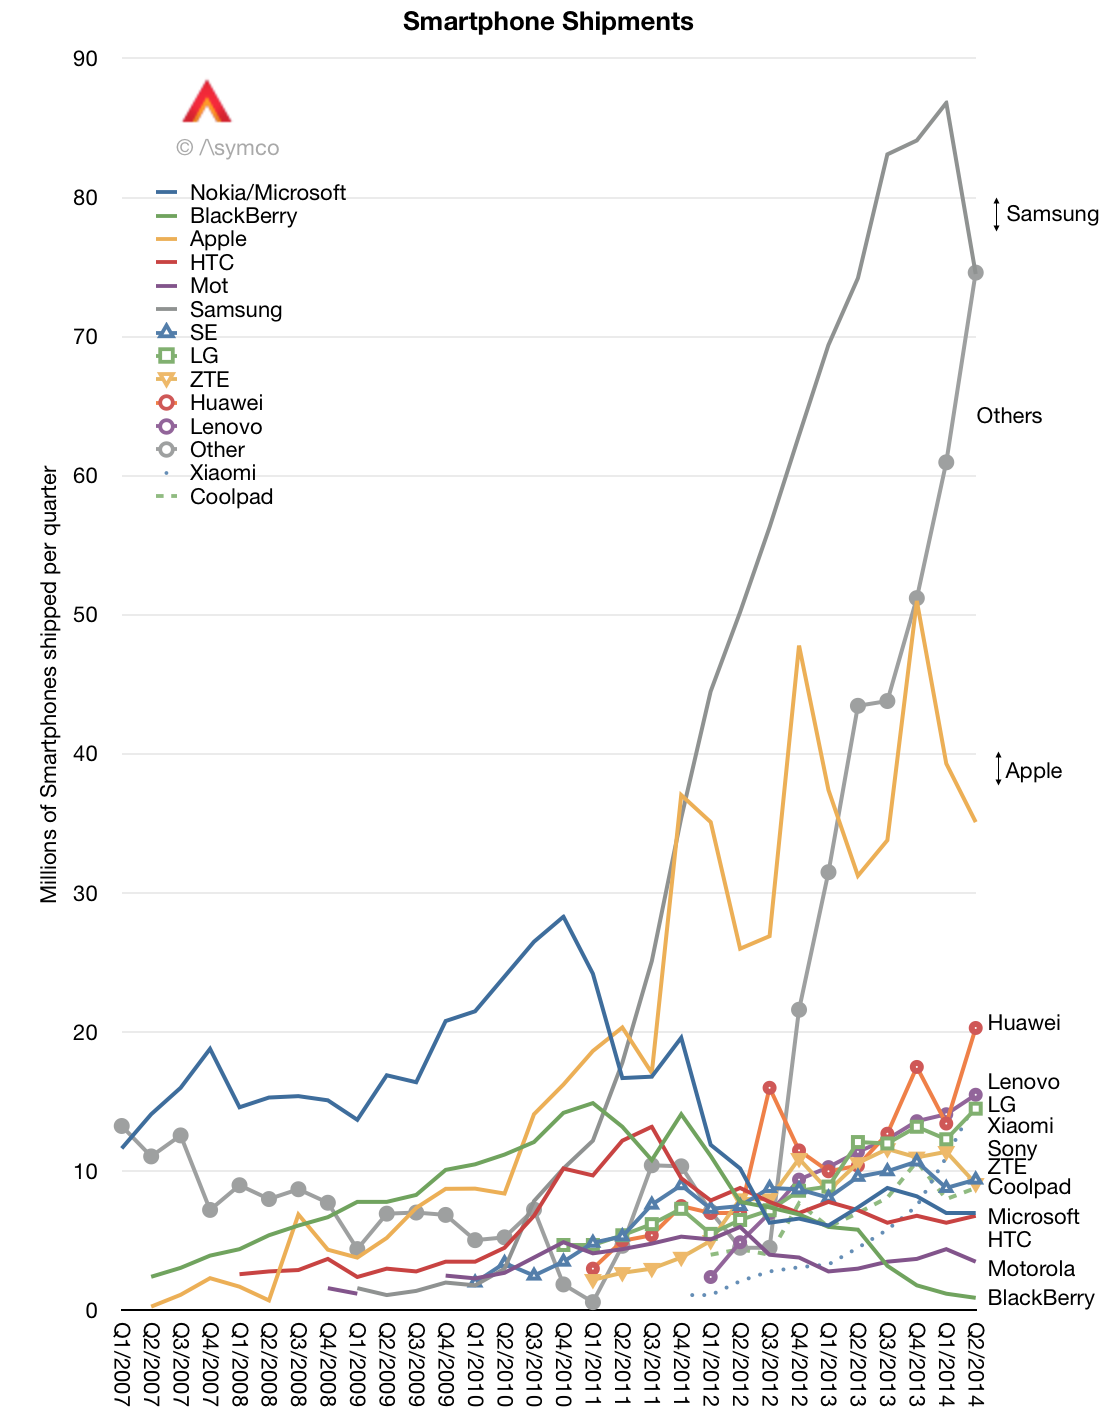
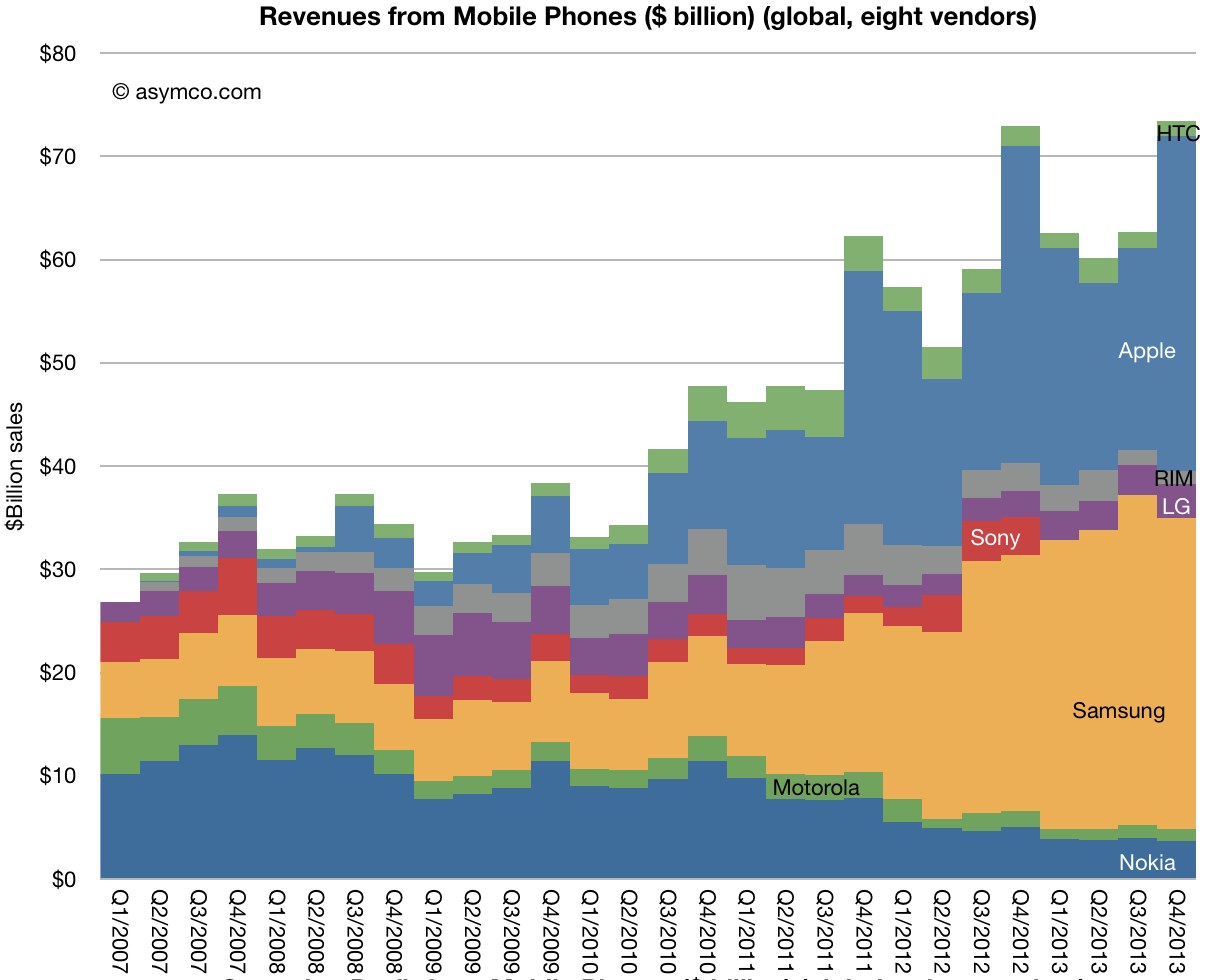
    Samsung's smartphone ascent was breathtaking. From having essentially zero market share in the category in late 2010 to becoming the largest vendor took less than two years. In doing so it grew to become the largest phone vendor, smart or not--a goal which eluded them during the previous decade of effort. Samsung went on to capture not only the lion's share of unit volumes, they also took almost all the profits in the Android mobile phone market.

    And in a market filled with competitors. Literally hundreds of vendors and thousands of products were available at every conceivable price point. Samsung did away with HTC, LG, and Motorola. HTC, the first Android vendor (and first to market with Windows Mobile), Motorola, Google's launch partner in the US and "Droid" brand partner (and future owner).  Google's own Nexus products. Samsung Galaxy ruled them all.

    Galaxy swamped the Chinese market and the Indian market, the largest in the world. They were so powerful that they were singled out both by Microsoft and Apple for IP royalties.

    All within two years or the average life-span of one smartphone.

    But something went wrong in 2014. Growth in shipments suddenly stopped. This was not a problem with the overall market, which kept growing. The slowdown did not affect other vendors, especially the up-and-coming Lenovo and Xiaomi and the second and third tier vendors whose names are  known only in the local markets they serve.

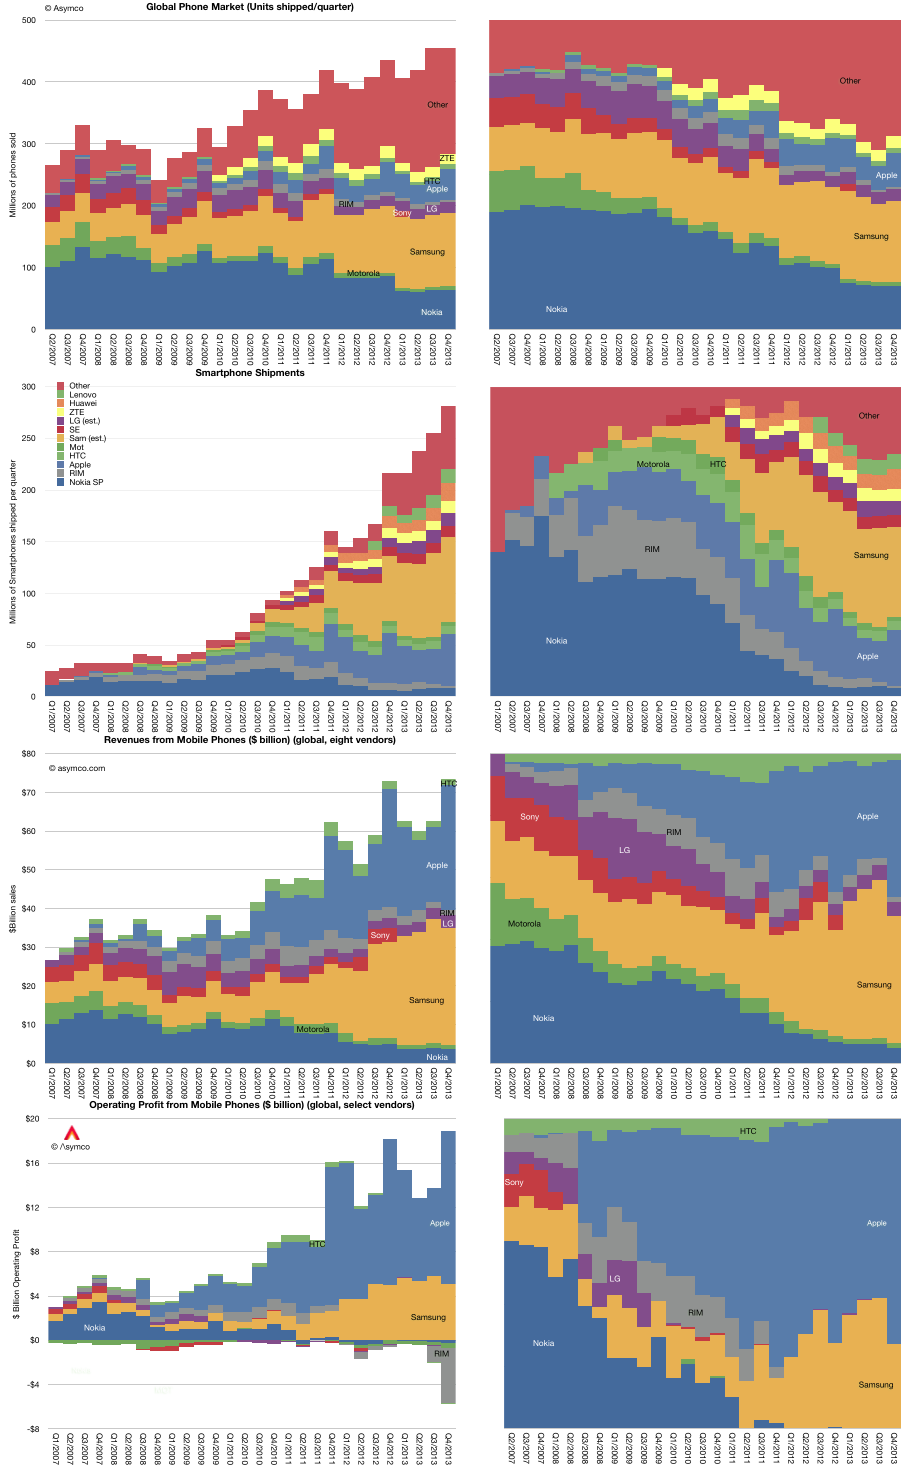
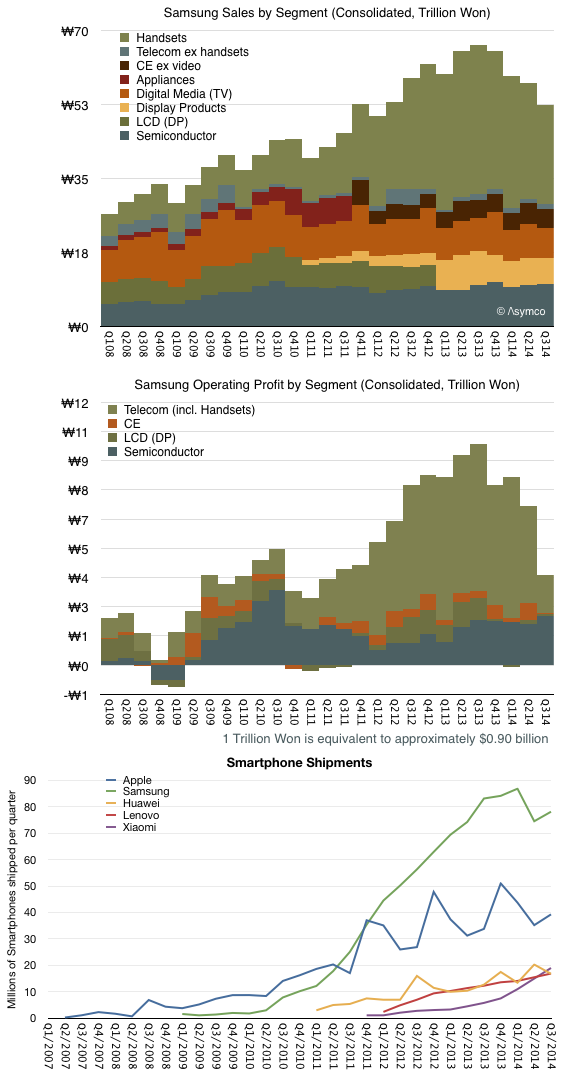
    The result of this slowdown is shown in the following graphs:

    <>

    Screen Shot 2014-10-30 at 10-30-4.11.19 PM

    Note how the wobble in units shipped was foretold by slowing revenues and an even more profound effect in profits. Peak revenues and profit occurred in Q3 2013 while volumes continued to grow until Q1 2014. Even in the last quarter, shipments are at near year-ago levels. Profits however have dropped to 2011 levels.

    At the same time, Apple shipments continue to grow as do those of Lenovo, Huawei and Xiaomi. Xiaomi in fact is growing in a trajectory eerily parallel to that of Samsung from 2010. It just hit the same level of volume that Samsung had in Q2 2011. And Samsung had been making phones for decades while Xiaomi is barely two years old.

    Having seen a boom/bust rise/fall pattern with other vendors (e.g. Nokia and Blackberry) it should behoove us to ask what are the causes of success and failure in this business. Samsung management suggests that they perceive speed of action, product mix/portfolio choices and hardware experimentation are the keys to their success.

    However, competitors which are rising rapidly (at the expense of Samsung) are not acting in the same way. Xiaomi is patterned as a Chinese Apple, offering design, brand, attention to detail and software as differentiation. Lenovo is building on its computing roots and expanding with acquisition. Huawei and ZTE leverage networking business and operator relationships.

    The crisper answer to causality may be that the market is bifurcating into an "upper" market where new jobs-to-be-done are being explored with integrated offerings (Apple and Xiaomi) and a "lower" market which is in the throes of low-end disruption. Both are competing with non-consumption though the upper market is service non-consumption and the lower market is feature non-consumption.

    Samsung is stuck right in the middle ((Just like Nokia was.)) It defines itself on the basis of what exists. It competes only within a defined market and positions itself agains existing products. They claim to be "better" than the competition and make the point loudly with their advertising. However, being better is never a solid foundation. At some point you'll be either good enough or someone more agile will be faster than you.

    At some point the fast follower exposes themselves to being faster followed. Better to find new lands to conquer.

  2. What next, Samsung?

    Research · 201 comments

    I received a few questions from Shirley Siluk of NewsFactor as a follow-up to my post on the trajectory of successful companies.

    1. Do you foresee any hope for a turnaround for Samsung? If so, where do its best opportunities lie?

    Screen Shot 2014-10-13 at 1.44.54 PM

    The smartphone business was a huge opportunity for Samsung and they took full advantage of it. Unfortunately, it’s a difficult business to stay on top of. The list of victims in that industry is quite long and there have been no long-term winners. Samsung’s operating model seems to be to invest as a ‘fast follower’ filling in the market after it’s established while leveraging capital intensive components synergies. That has also worked for them in consumer electronics (at the expense of Sony and other Japanese vendors). If the modus operandi does not change then their turnaround will depend on the creation of new opportunities/categories. Wearables may be such an opportunity but it may not be as big as the phone business. ((The graph shows estimates of smartphone shipments for a select number of vendors.))

    2. What has contributed most to Samsung's decline? Which competitors are posing the greatest threat?

    The fast follower strategy belies its own limitations: it implies a transience or impermanence in strategy. In a fast follower strategy it’s only a matter of time before late followers eat into the business, similar to the way that the fast follower ate into the innovator. Chinese vendors are poised to take more share. The way I said it in 2011 was that I saw in Huawei ((I did not anticipate the Xiaomi and Lenovo entrants which are also doing very well.)) what Samsung was five years earlier. It’s easier for the low-end providers to move up-market and not at all easy (in terms of loss of margin) for the higher end to move down.

    3. You mentioned the pattern of commoditization in all of Samsung's markets -- what would be the best way around this?

    Commoditization is largely unavoidable. The way to survive as a business is to ensure you create new businesses or solve new problems. One hope that springs eternal is that through a “brand” a maker can ensure long-term margin survival. That did not help Nokia, Sony, or Microsoft. Brand is only valuable if it carries meaning and often that meaning becomes a fading product. So the short answer is that Samsung needs to create new categories or businesses. The challenge for them is that they need to control the platform and service infrastructure. These are currently out of their control and I’m not quite sure how they can regain that control.

    I was wondering if you had any followup comments you could offer about Samsung in light of the announcement today that it's developed a faster 60 GHz wifi technology -- do you think this kind of technology, if it's everything Samsung says it is, could provide the kind of corporate turnaround momentum Samsung needs?

    Certainly not. This is a sustaining improvement in a technology. What Samsung needs is a disruptive improvement. A disruptive improvement implies a new business model. Put another way, it means that Samsung needs to invent a new way of making money.

    --

    Postscript: One problem with this prescription is that it's considered impossible to execute and those who try to operate as repeatable innovation companies are punished with deep discounts and condemned as being "hits driven" rather than annuities. Woe befalls the manager who seeks this route.

  3. Late late majority

    Research · 64 comments

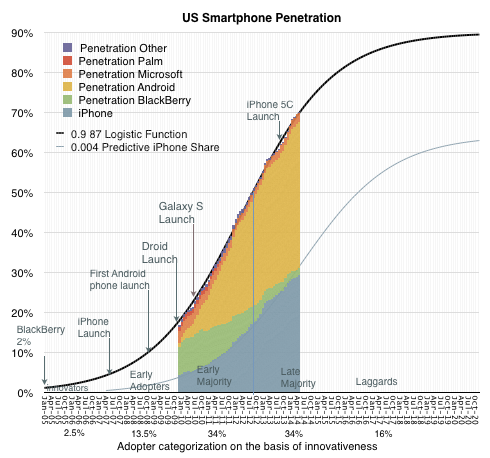
    Seven years after the iPhone was launched, 70% of the US population is using smartphones. Smartphones existed before the iPhone so the category is older than seven years but as far as adoption goes this is nearly the fastest ever.

    The CD Player reached 55% in seven years and the Boom Box about 62%. If measuring the period between 9% penetration and 90% ((which I consider the "economically attractive" period of growth)) the smartphone in the US will have a lifespan of about 9 years starting in 2008. Before this period, the product was largely experimental and participating vendors ((Palm, BlackBerry, Nokia)) mostly failed. After this period most products will be "commoditized" with decreasing margins and increasing consolidation.

    The rapidity of growth is all the more remarkable given the penetration is at the individual, not household level. The total user base is therefore over 270 million rather than the 115 million usually targeted by consumer technology, nearly 60% more purchases. This is also remarkable because the product has a shorter lifespan of use (two years) than is typical for other consumer technology products ((e.g. TVs, Refrigerators, Radios, etc.))

    We are therefore now in the "Late Majority" phase of the US market. This is not a surprise. The inflection point in the market occurred in mid 2012 so we've been in this phase for two years already. It's not therefore controversial to predict two years of continuing though decelerating growth.

    Screen Shot 2014-07-08 at 7-8-2.39.27 PM

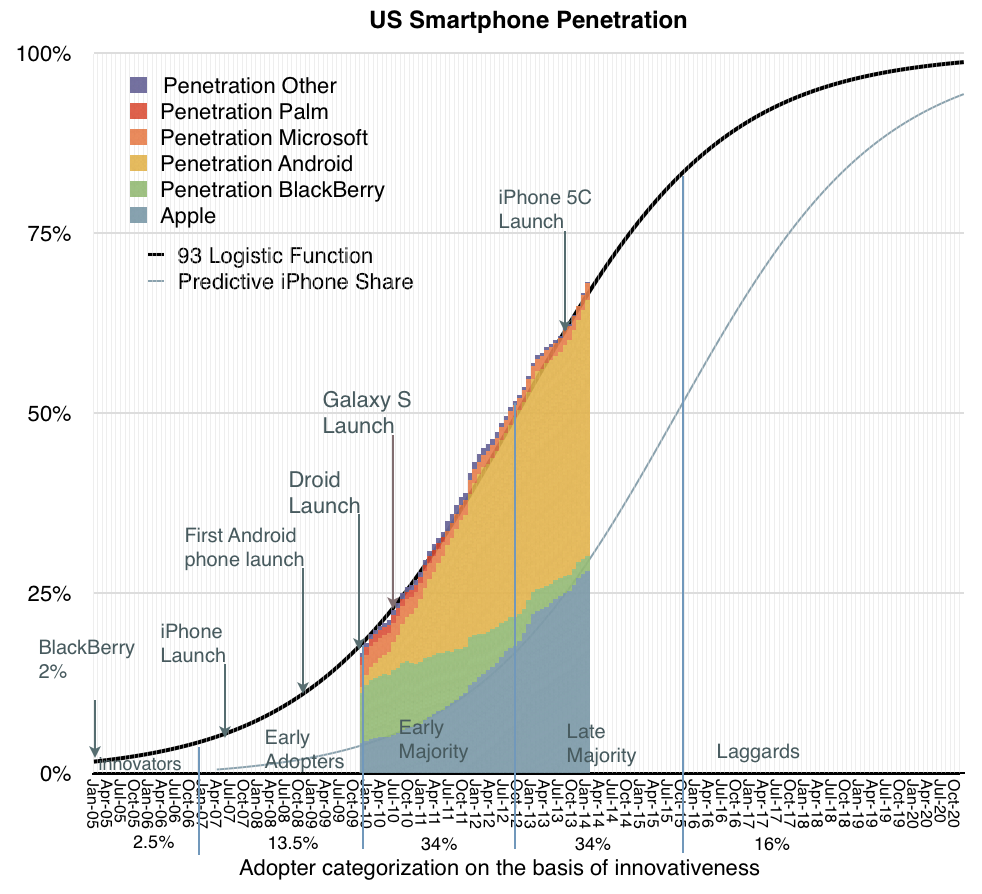
    As Geoffrey Moore explained, the marketing of technology products needs to be varied as we get into different phases of the market. Innovators (first 2.5%) need to be sold on the premise of novelty itself. Early adopters (next 13.5%) seek status and exclusivity. Early majority (34%) seek acceptance and Late Majority (34%) seek pragmatic productivity. Laggards (last 16%) seek safety.

    One aspect of this adoption cycle that is misunderstood is the role of pricing. The assumption is that pricing matters more as adoption increases. This is misunderstood because pricing always matters and therefore it never matters. Pricing is one of many elements of marketing mix and at any time there are product choices across a wide spectrum of pricing. Pricing is also a signal which can be elaborately obfuscated through bundling and unbundling.

    One way to illustrate this is to consider how Apple products behave in the late phases of markets. Apple products have notoriously firm pricing.

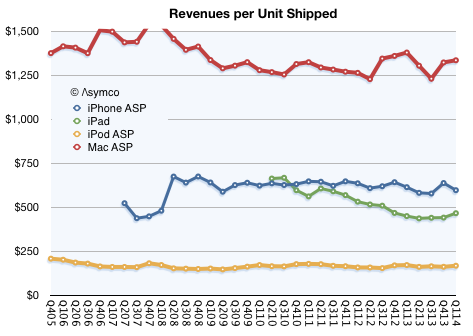
    Screen Shot 2014-07-08 at 7-8-2.38.26 PM

    The revenue per unit of Macs, iPods, iPhones and iPads remains stubbornly consistent. This is not to say that each unit sold is the same price. The company tweaks "the mix" of mid, low and high products to keep the average selling price constant. But fundamentally the average remains constant which means that regardless of market phase, Apple retains its margins.

    So as we look forward to the last two years of growth for smartphones, how will Apple fare?

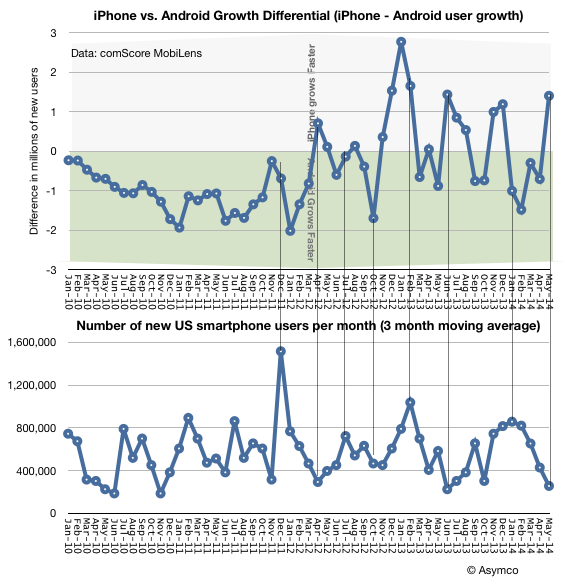
    There are weak signals that it will do rather well. I looked at two sets of data for clues: the number of new-to-smartphone users being added each month relative to the increase of usage of either iPhone or Android.

    Screen Shot 2014-07-08 at 7-8-2.40.19 PM

    [Edit: The title of the second graph above should be "Number of new US smartphone users per week (3 month moving average)"]

    What I'm looking for is a relationship between the rate of adoption of the overall product and the rate of adoption of iPhones. I measured the new-to-smartphone users as the change in user population (per week) and the preference for iPhone as a growth differential. ((iPhone growth in millions of users minus Android growth in millions of users. Positive data points suggest iPhone grew faster in a period and negative points suggest Android grew faster.)) The data shows no perceptible correlation between adoption rate and preference for either platform, however when looking closer there is a  periodicity to the addition of users, especially starting in 2012.

    The range is not insignificant, ranging from ~300k users/week to well over 1 million. The periods of growth of users could be due to new product launches or incentives and promotions done by the mobile operators. Whatever the reason, there is some flux.

    If we look at the corresponding adoption differential in platforms the relationship seems to be that peaks in adoption are matched to Android preference and troughs to iPhone preference. This might seem logical: after the 50% saturation point, when promotions are run by operators, non-consumers are drawn in and they tend to adopt the "low-cost" product.

    However, this is also paradoxical. Why, when we are in a late stage of the market, does the iPhone do well when users are not incentivized to adopt? The graph above shows that as we crossed 70% adoption, 1.4 million more users adopted the iPhone than Android.

    Even if we look out to the last six months, iPhone added 15.5 million late majority users while Android added 14.2 million. If promotions decrease for the "late late majority" and laggards then would the iPhone do even better relative to Android?

    The only answer seems to be that "low cost" is not what's driving this market. But then again, it never did. Towards the end of the "pre-smartphone" market the most wildly popular voice phone in the US was the RAZR. And it was a premium product.

  4. Twenty Questions from Catalin Stelian Andrei

    Research · 17 comments

    Catalin Stelian Andrei, Editor of The Day, INTERNET PROTV asked me twenty questions:

    1. What phone do you have in your pocket right now? Why that model?

    I carry the iPhone 5. The last iPhone I bought was an iPhone 5C which I gave to a family member.

    2. Apple is going to launch, form all we know, an iPhone with a bigger screen, long after their market rivals. Is Apple one step behind, being forced to take this road in the fight with Android and Windows Phone devices? Because many smartphone users were hoping that an big screen iPhone, a redesigned model, will be lauched long time ago, and that didn’t happen.

    Making bigger phones is easier than making smaller phones. First because miniaturization has always been the most difficult engineering challenge, and second, because a smaller phone has a smaller battery making efficiency much more important. The larger the phone, the simpler it is. The third reason smaller is more valuable is that it’s easier to carry and use. The largest phones cannot be put in pockets and cannot be used with one hand. In the history of consumer, electronics size reduction has been the most consistent measure of performance, and the most rewarding. Usually the most exceptional reductions in dimensions create the highest price and profit bands. There have been niches for larger portable devices but they are consistently a small part of the overall market. If Apple were to introduce a larger device I hope they will be able to solve usability problems and make the category attractive to a larger audience.

    3. What do you expect from the new iPhone 6?

    I expect it to run the latest version of iOS and, with the new apps developers will ship, that should make the most impact in people’s lives. I imagine health maintenance and home automation will become valuable new franchises. Of course iOS 8 will also run on older iPhones, but I suspect the newest iPhone will somehow run the new software better and have smoother integration with services.

    4. What’s the “not to do” lesson that Apple needs to learn for the now iPhone from it’s own past experience or their competitors?

    The biggest challenge is to move rapidly with scale. The company has managed to grow from zero phones a year to hundreds of millions. That’s great but it’s still frustrating to wait one year for major improvements. The “cycle time” of innovation for Apple remains one year. I wish it could be faster but perhaps this is also too fast for some. In some services like maps and iCloud and iWork, which are independent of hardware (mostly,) speed is of the essence.

    5. The iPhone is the most expensive smartphone on the market right now. In Romania, it certainly is. But where does Apple gains it’s most money from, selling products to users or selling services, like iTunes, App Store? And having that in mind, what will be their next step: better – breakthrough products or bigger, more complete services?

    The answer to where a company “gets its profits” is best answered by asking where a buyer “gets his value” from the product. For instance you might answer the question of where a car company gets its value by saying that it’s from making people be in more than one place in a day. So the “differentiation” of a car is in answering the question slightly differently. If it’s hard to see a difference to this answer between cars then it’s hard for any one company to make a profit. For a company like Apple, we need to ask what its users value about the experience and why they are willing to pay for that. My hypothesis is that the brand's value is in making life a little bit easier. That’s what Apple competes on. Of course, some people are not willing to pay to have an easier life and some even want to make their lives more complicated so Apple’s proposal to make life easier, for a price, is not accepted by everybody—which is ok by them. But for many, paying for comfort, productivity and ease of mind is worth quite a bit. The reason Apple is able to gain a premium over the competition is that this value proposal (of paying for simplification) is either weak or non-existent for competitors. Indeed, many competitors compete on the basis of making life more complicated.

    6. What does innovation means for Apple right now? What are their options for assuring a next decade of success? A new Steve Jobs person or a Steve Jobs tipe of group thinking. How hard is that to achieve?

    Innovation is meaningful invention—bringing useful creations to a large number of people who then make use of that creation. The interesting aspect of making money from innovation is that it’s a rare phenomenon, requiring many disciplines to work together. It’s like a big movie that somehow works and becomes widely popular but costs little to make. Many movies are made, few are successful and very few of those which are successful are built at low cost. What we know about technology innovation is that it’s a combination that comes together under strong leadership but that leadership alone is not sufficient. The myth of Steve Jobs is that he was both necessary and sufficient to success. The truth is that he was necessary but not sufficient. To make successful innovations requires strong leadership and teamwork and a process of incentives and passion that is hard to create a formula for. How this works at Apple is its biggest secret.

    7. Who are the key Apple employees right now? Do they need another Jobs or do they already have him?

    All Apple employees are key. I would say that’s the magic formula. There is no chief magical officer (and there never was.)

    8. What will be the next best thing for Apple? […]

    I don’t know. It’s probably not knowable.

    … Are they capable of another breakthrough in the market?

    Yes. This is almost certainly knowable.

    9. Is the smart-home project something that will really happen in the next, let’s say, two decades?

    If the project requires replacement of existing infrastructure, it will not happen. If the project allows adding new items to existing infrastructure, it will almost certainly happen.

    10. Growth comes from the middle and low-end smartphones, according to IDC. Would or would not be a good idea for Apple to release a handset cheaper than the 5c?

    If Apple were concerned with growth then they should. But we have to ask why they avoided doing this six years ago. Not only was it obvious to do so but a portfolio strategy was the modus operandi for every competitor and had been for decades. The question isn’t why Apple does not broaden its line-up but why do the others diffuse their efforts and have such poor focus.

    11. What feature or software you think would be the main battleground in the future, in the smartphone market? Apps? Battery? Camera?

    Integration of all the above. When new experiences and services emerge those who are able to make them usable succeed. Usability requires integration.

    12. Who puts more pressure on Apple: Apple itself, Samsung, LG, HTC, Microsoft and Nokia? And how.

    I suspect competition is part of motivation but it’s not the entire story. Let’s not forget that Apple is considered to suffer from competitor pressure from software companies, services companies, media companies, hardware companies and everything in between. For instance, Apple is in competition with Microsoft, Amazon, Google and Samsung but the competition is not transitive. In other words Amazon is not perceived as being in competition with Samsung and neither is Google competing with Nokia. So somehow Apple should be sensitive to every perceived alternative to every aspect of its products. This quickly becomes an absurd idea. Apple is a system of things and systems can’t be compared with components.

    13. What is Apple’s sensitive spot today. What do you believe Apple fears the most?

    Losing people. The problem of retaining talented people is the most difficult challenge, especially when they become very wealthy due to the success of the firm.

    14. In 2012, you described the fall of Nokia in competition with Samsung at the Guardian Mobile Business Summit due to the disruption theory: the launch of the smartphone. Is Apple in danger of becoming a victim of the same story in the near future? What technology could replace the smartphone and when?

    Yes, every company is vulnerable to disruption. The defense is not to protect against it but to self-disrupt or enable self-destruction. Self-preservation is an instinct in humans so this is psychologically very difficult. The crisis comes not from a technology change but a business model change and that implies a cultural change. Companies embrace any and all technologies which sustain their business models and reject, resist and ignore any and all technologies which disrupt their business models. Changing business models is like a brain transplant; it happens so rarely that we can count it on one hand. By the way, because it’s so rare is why companies who attempt it are discounted by the market.

    15. You've been a Nokia executive. From this perspective, how do you see the deal with Microsoft and the future of Windows Phone and the Lumia brand?

    This is a long story. I can’t really do it justice now but I will say that it seems that Microsoft understands that they need to become an integrated systems company and not a component supplier. The same became evident to Nokia so they needed to merge.

    16. You've also worked with people from RIM. Do the have the capacity to innovate?

    Perhaps but scale also matters. RIM and HTC may not have the time to grow.

    17. Let’s imagine that no big company owns my personal information. If I wanted to sell that to someone, what would be the right price to ask? How valuable are individuals in the war for gaining personal information?

    The price of your personal information will be set by auction. It’s up to you to decide if you want to create a reserve price or to let the highest bidder win. As of today most people would trade all their personal information for almost zero price. This will not last and consumers will find out their value over time. I can’t predict how it will change but it will be a combination of offers being made and personal data catastrophes which will act as warnings.

    18. Do you believe in phoneblocks project from Motorola?

    Only people who want more complicated lives will want to build their own products. There are some such people (for example children) but they are not willing to spend a lot for that complication so the overall market for increasing complexity is small.

    19. The last question. What could trigger an Apple fall and when?

    The most common trigger for failure is success. To continue succeeding is very hard because motivation disappears. What can cause a crisis of motivation would be that there is a loss of belief that there are problems left to solve.

  5. How close to saturation is the smartphone?

    Research · 6 comments

    The US is not the market where penetration is highest. However, it is the largest market where we have reliable penetration data (from at least two sources) and the one where penetration is near the top of the range.

    The graph showing the US ranked against others as of a year ago is here. The US was cited at 56.4% at the time. I keep track of comScore's data and it showed 58.2% at the end of March and 55.3% at the end of January, making the figure very believable.

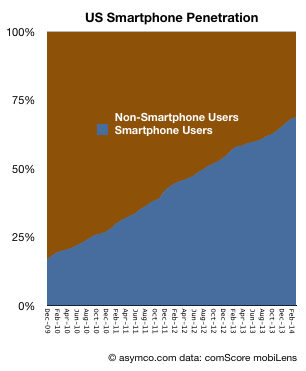
    The most recent data from comScore shows penetration at 68.8%. In order to understand what the limits of that growth could be it's important to see the longer-term pattern. It would show whether there is a clear point of inflection and thus a predictable "saturation" around an asymptotic value.

    The following graph shows the percentage of smartphone users/non-users since late 2009.

    Screen Shot 2014-05-08 at 5-8-6.13.29 PM

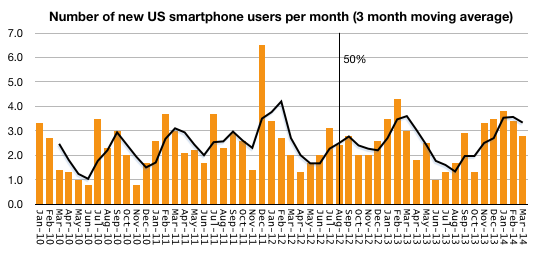
    The following graph shows the rate at which users are being added to the smartphone ranks (measured as new users per month.)

    Screen Shot 2014-05-08 at 5-8-6.14.01 PM


    To summarize, the conversion of users from non-smart to smartphone usage is fairly constant. The March '14 period saw 2.8 million new-to-smartphone users. the March '13 period saw 3.0 million, the March '12 period saw 2.0 million and March '11 saw 3.0 million. There is no discernible slowing of adoption.

    Note that I added a trailing three period average in new users which fluctuates somewhat predictably due to seasonality. Finally, note that the figure of 50% penetration was reached almost two years ago and no noticeable change of adoption has happened since. Cellular phone ownership in the US is still rising (though very slowly) and it now about 90%.

    The only conclusion is that even at the current 68.8% penetration, we are not anywhere near "saturation" of smartphone users in the US, and the US is a leader among "developed markets" so there is little to suggest that saturation has happened anywhere with significant populations.

  6. The iPad discontinuity

    Research · 144 comments

    iPad sales were unexpectedly slow in Q1. Tim Cook explained it as follows:

    iPad sales came in at the high end of our expectations, but we realized they were below analysts' estimates and I would like to proactively address why we think there was a difference. We believe almost all of the difference can be explained by two factors.

    First, in the March quarter last year we significantly increased iPad channel inventory, while this year we significantly reduced it.

    Second, we ended the December quarter last year with a substantial backlog of iPad mini that was subsequently shipped in the March quarter whereas we ended the December quarter this year near supply demand balance.

    We continue to believe that the tablet market will surpass the PC market in size within the next few years, and we believe that Apple will be a major beneficiary of this trend.

    Tim Cook went on to say "over two-thirds of people registering an iPad in the last six months were new to iPad"

    In a later discussion, Luca Maestri said:

    As Tim explained earlier, our iPad results and the comparison to the March quarter last year were heavily influenced by channel inventory changes. Specifically, this year we sold 16.4 million iPad into our channel and sold through almost 17.5 million, reducing our channel inventory by 1.1 million units.

    Last year, we sold over 19.4 million iPads into our channels and sold through 18 million, and therefore increased channel inventory by 1.4 million units. As a result, the year-over-year sell through decline was only 3% compared to the sell-in decline of 16%.

    We exit the March quarter with 5.1 million of iPad channel inventory which left us within our target range of four to six weeks. iPad continues to lead all other tablet by far in terms of user engagement, size of ecosystem, customer satisfaction and e-commerce.

    In a later Q&A:

    Steven Milunovich - UBS Securities: Tim, I understand that the iPad is not as weak as it appears on a sell-through basis, but still it's relatively flat over the last year in terms of sell-through. What are your thoughts in terms of why that is and can that accelerate with Office on the iPad going forward?

    Tim Cook - CEO: It's a good question. Let's talk about iPad a little more than we did in the comments.

    When I backup from iPad, here is what I see. It absolutely has been the fastest growing product in Apple's history, and it's been the only product that we've ever made that was instantly a hit in three of our key markets, from consumer to business including the enterprise and education.

    And so, if you really look at it in just four years after we launched the very first iPad, we've sold over 210 million, which is more than we or I think anyone thought was possible at that period of time. It's interesting to note that that's almost twice as many iPhones that we'd sold in a comparable period of time, and over seven times as many iPods as we'd sold in the period of time.

    So, I think it's important to kind of to put that in perspective. We've come a long way very, very quickly. Looking at it by market a bit, which I think is important. I think Luca mentioned a little bit of this in his comments. In the education market in the U.S., we have a 95% share. So the focus in education is on penetration, is on getting more schools to buy and my belief is the match has been lit, and it's very clear to the educators that have studied it is that student achievement is higher with iPad in the classroom than without it. So I'm confident we've got a really great start in education far beyond the U.S. now. This is happening in many, many parts of the world.

    In the enterprise market, we're seeing virtually all, 98% of the Fortune 500, they're using iPad. We're seeing – according to Good Technology who looks at activations of tablets – the latest data we have from them is that 91% of the activations of tablets in enterprise were iPads. So this is also an astonishing number and many of those enterprises are writing apps that are key proprietary apps for running that business, and this is great for that company because they're more productive as a result of that. So once again, just like in education in a way, what we have to do in enterprise is focus on penetration, it has to be deeper and broader.

    But in terms of having people begin the process, beginning writing apps, we're doing a pretty good job of that. In the retail market, if you look at the U.S. as a proxy, the NPD numbers for March just came out a few days ago and we had 46% share and embedded in that 46%, there's a lot of things in there that I personally wouldn't put in the same category as iPad, and that are weighing the share down. It's certainly a market we wouldn't play in and in a type of product you would never see an Apple brand on. So, we feel like we're doing well there.

    Office; I believe does help. It's very unclear to say how much. I believe if it would have been done earlier, it would have been even better for Microsoft frankly, there is a lots of alternatives out there from a productivity point of view, some of which we brought to the market, some of which many, many innovative companies have brought. But I do see that Office is still a very key franchise in the enterprise, in particular. I think having it on iPad is good, and I wholeheartedly welcome Microsoft to the App Store to sell Office. Our customers are clearly responding in a good way that it's available. So, I do think it helps us particularly in the enterprise area.

    The other things you look at on iPad that are just blow away its customer [satisfaction], is 98 [percent]. There is almost nothing in the world with a 98% customer sat and the intention-to-buy numbers look good with two-thirds of the people planning to buy a tablet or planning to buy an iPad. The usage numbers are off the chart, far and exceeding Android tablets, four times the web traffic of all Android tablets combined.

    So, when I backup from all of these, I feel great. That doesn't mean that every quarter, every 90 days is going to be a number that everybody is thrilled with. But what it means to me is that the trend over time – over the arc of time, that things look very, very good, that iPad has a great future. And of course the thing that drives us more than any of this are the next iPads if you will, the things that are in the pipeline, the things that we can do to make the product even better, and there is no shortage of work going in on that nor any shortage of ideas.

    So when I backup from all of this, I can't help but still be extremely excited about where we are. I think we did a reasonable job of explaining what we think the disconnect was between what we had expected, which we hit it at the high end of our expectation and the street's view of this one. I believe the vast majority of it is that first thing was just channel inventory that maybe we should have been even clearer on last quarter to take into account. But I'm very bullish on iPad.

    That's quite a long set of explanations for was essentially was a flat quarter for the iPad. I can't add more to this, but I do want to focus on the bold part of the quote above. "But what it means to me is the trend over time – over the arc of time, that things look very, very good".

    How can we see the long arc of time?

    The tool I've used for this is the measure of penetration. Historically products which become "mainstream" or widely adopted follow an S-curve during that adoption. The curve is remarkably predictable given a limited set of points. I've discussed how the adoption of smartphones is predictable in the US, EU5 (( And UK specifically and several broader global regions)) and how even particular platforms might be predictable in the context of rates of adoption.

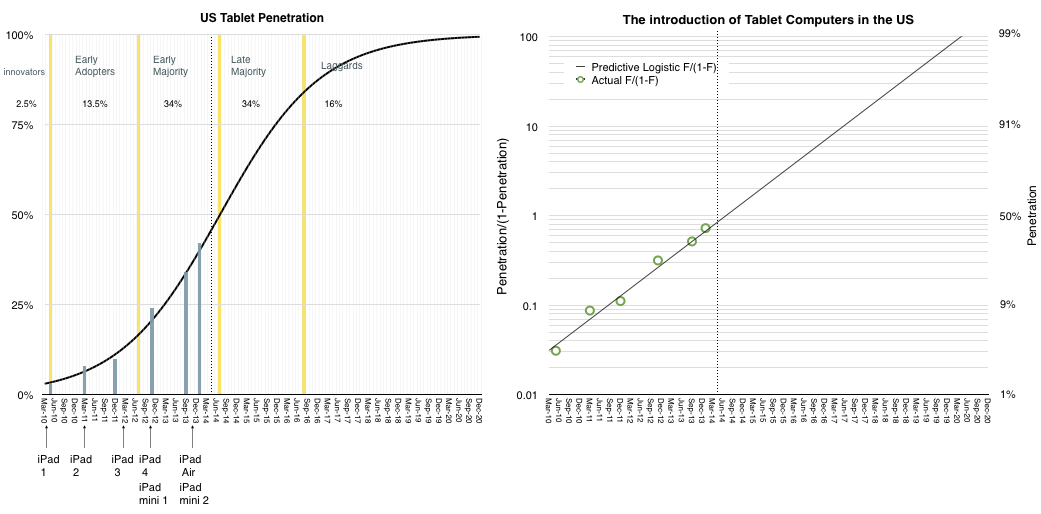
    We are fortunate that data also exists for tablets. The Pew Research Center's Internet & American Life Project has published a short history of tablet adoption in the US. I've plotted this data and imposed an S-curve on the data which fits it rather closely.

    The results are shown below:

    Screen Shot 2014-04-30 at 10.49.58 AM

    In the graph on the left, the blue bars represent actual measurements of penetration (18+) while the black curve represents a best fit for the adoption rate.

    Note that I've added the launch dates of all the iPad models and sectioned the curve into adopter categorization on the basis of their willingness to adopt.

    I've also drawn a dotted line on the point where we are in the present.

    In the graph on the right I've also duplicated the data using the transform of penetration to log scale penetration/(1-penetration). This shows the relative fit of the data in a more visually comfortable way.


    The usual caveats apply:

    • This is US only
    • These are adults only
    • The iPad is not the only competing product

    Nevertheless, this is a fairly strong proxy for the market. First, because the US has been leading adoption of almost all consumer product categories in history. Second because adults are a representative sample of users and third because iPad is market share leader.

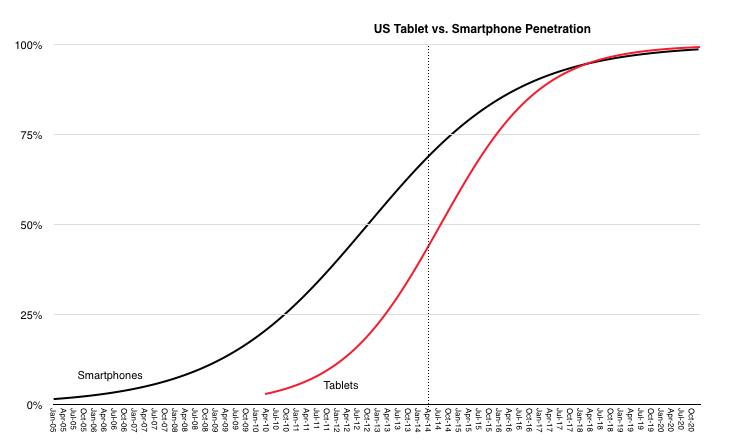
    What the penetration data shows is an extremely rapid rate of penetration. In comparison with the smartphone, the tablet is rising much faster. This is shown below:

    Screen Shot 2014-04-30 at 10.59.16 AM


    They are likely to saturate at around the same time but the tablet started much later.

    So how does this explain the slowing iPad sales?

    It's possible that saturation for tablets could come well below 100% and that we are on a different curve than the model above. However, the ubiquity of the product and broadness of appeal, even within non-consumer (i.e. education and enterprise) makes it difficult to reconcile. In addition, the penetration data is self-evident. It's improbable that penetration goes to 42% as it just did, and then stops suddenly. These decelerations of adoption have been observed historically but they are usually explained by cataclysms such as wars and economic contractions, neither of which are affecting the US right now. If a product solves an important "job to be done" then it gets adopted in a predictable way by a given population.

    The anecdotal evidence provided by the company and others coupled with the survey data collected for the population of US users implies that the iPad is solving numerous important jobs and is therefore continuing on a predictable trajectory and that a discontinuity has not occurred.

    Management started by saying the iPad sales volume was not surprising to them and that they have not changed their long-term expectations. The penetration data seems to support their confidence.


  7. Postmodern computing

    Research · 99 comments

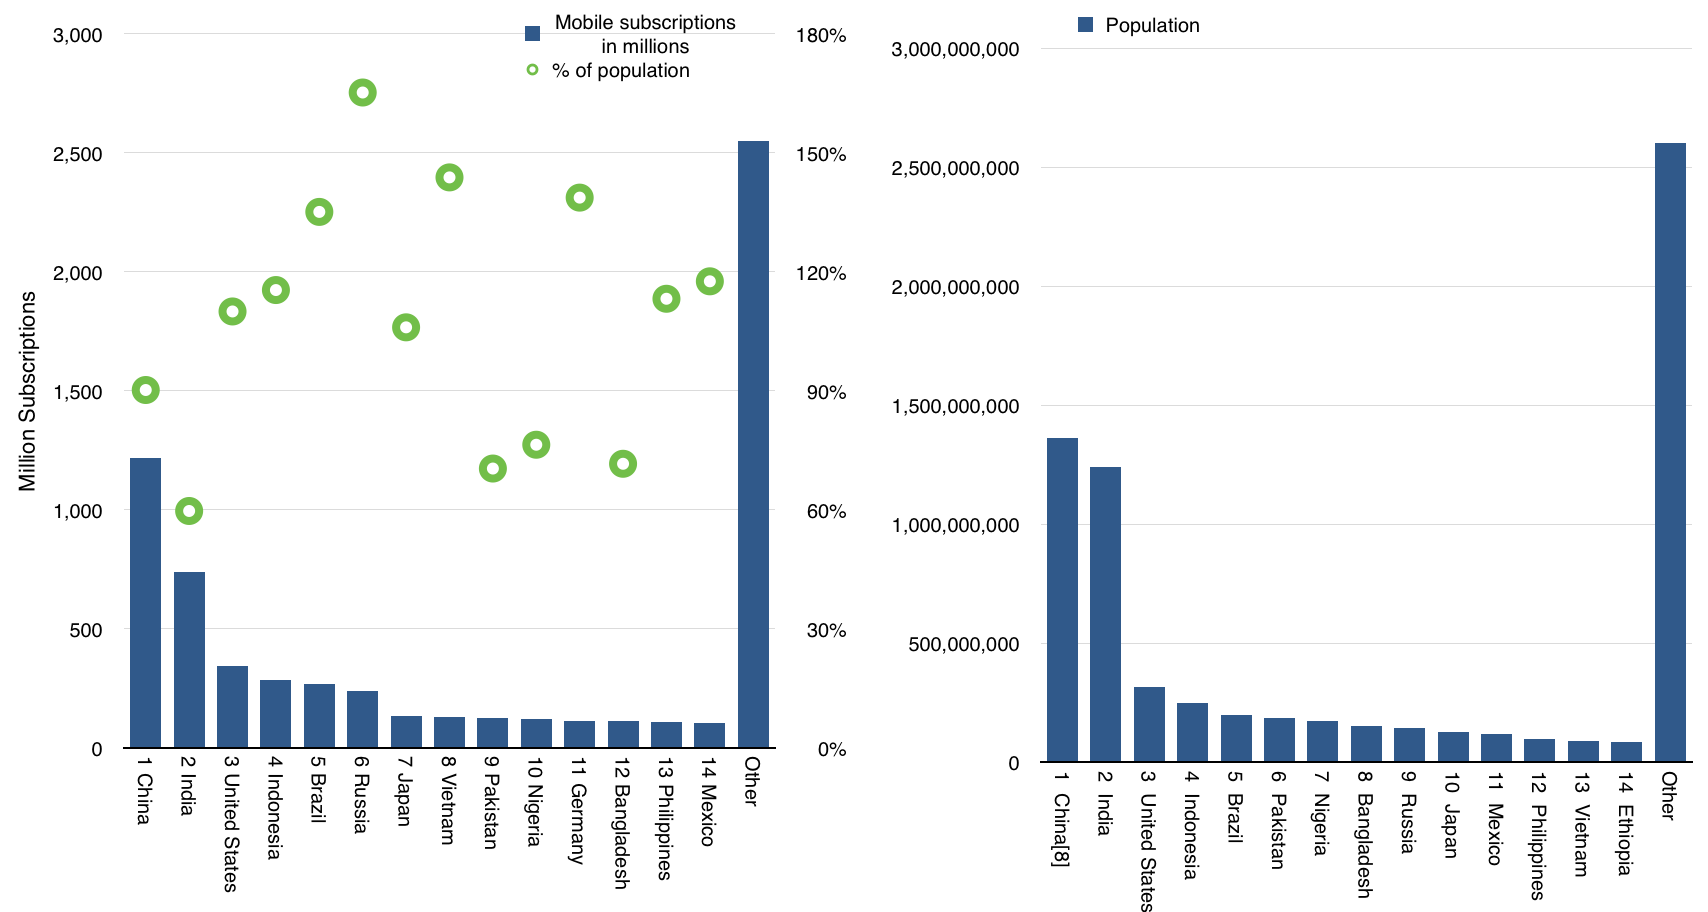
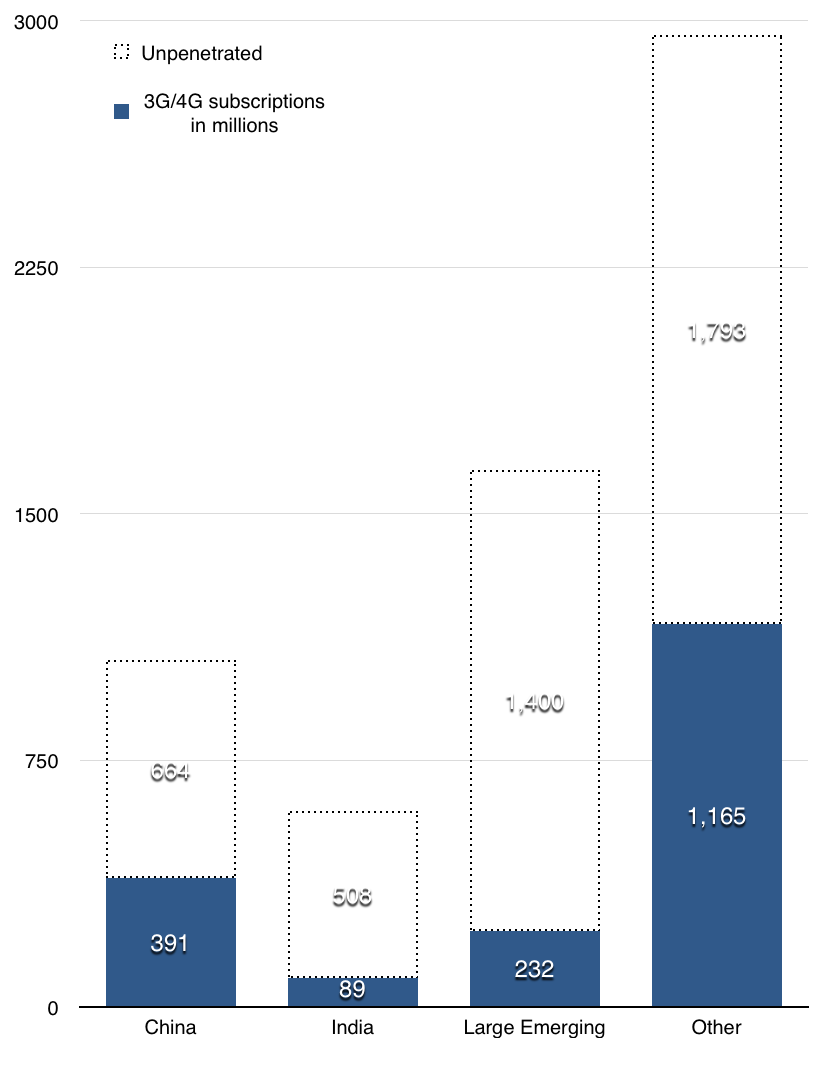
    There are 7.1 billion people on Earth. Coincidentally there are also 7 billion mobile connections.  Those connections are held by 3.45 billion unique mobile subscribers. ((GSMA)) Unsurprisingly, the largest national mobile markets (by number of subscriptions) correspond closely to the most populous nations.

    Screen Shot 2014-04-07 at 7.21.46 AM

    Considering smartphones, last year 1 billion smartphones were sold and the number of smartphones in use is about 2 billion ((There are also about 2 billion 3G/4G connections world-wide))

    Given the rapid adoption of smartphones, it's also safe to assume that smartphone penetration will follow population distribution. In the US, where comScore data is published monthly, penetration is following a predictable logistic curve.

    Screen Shot 2014-04-07 at 7.55.13 AM


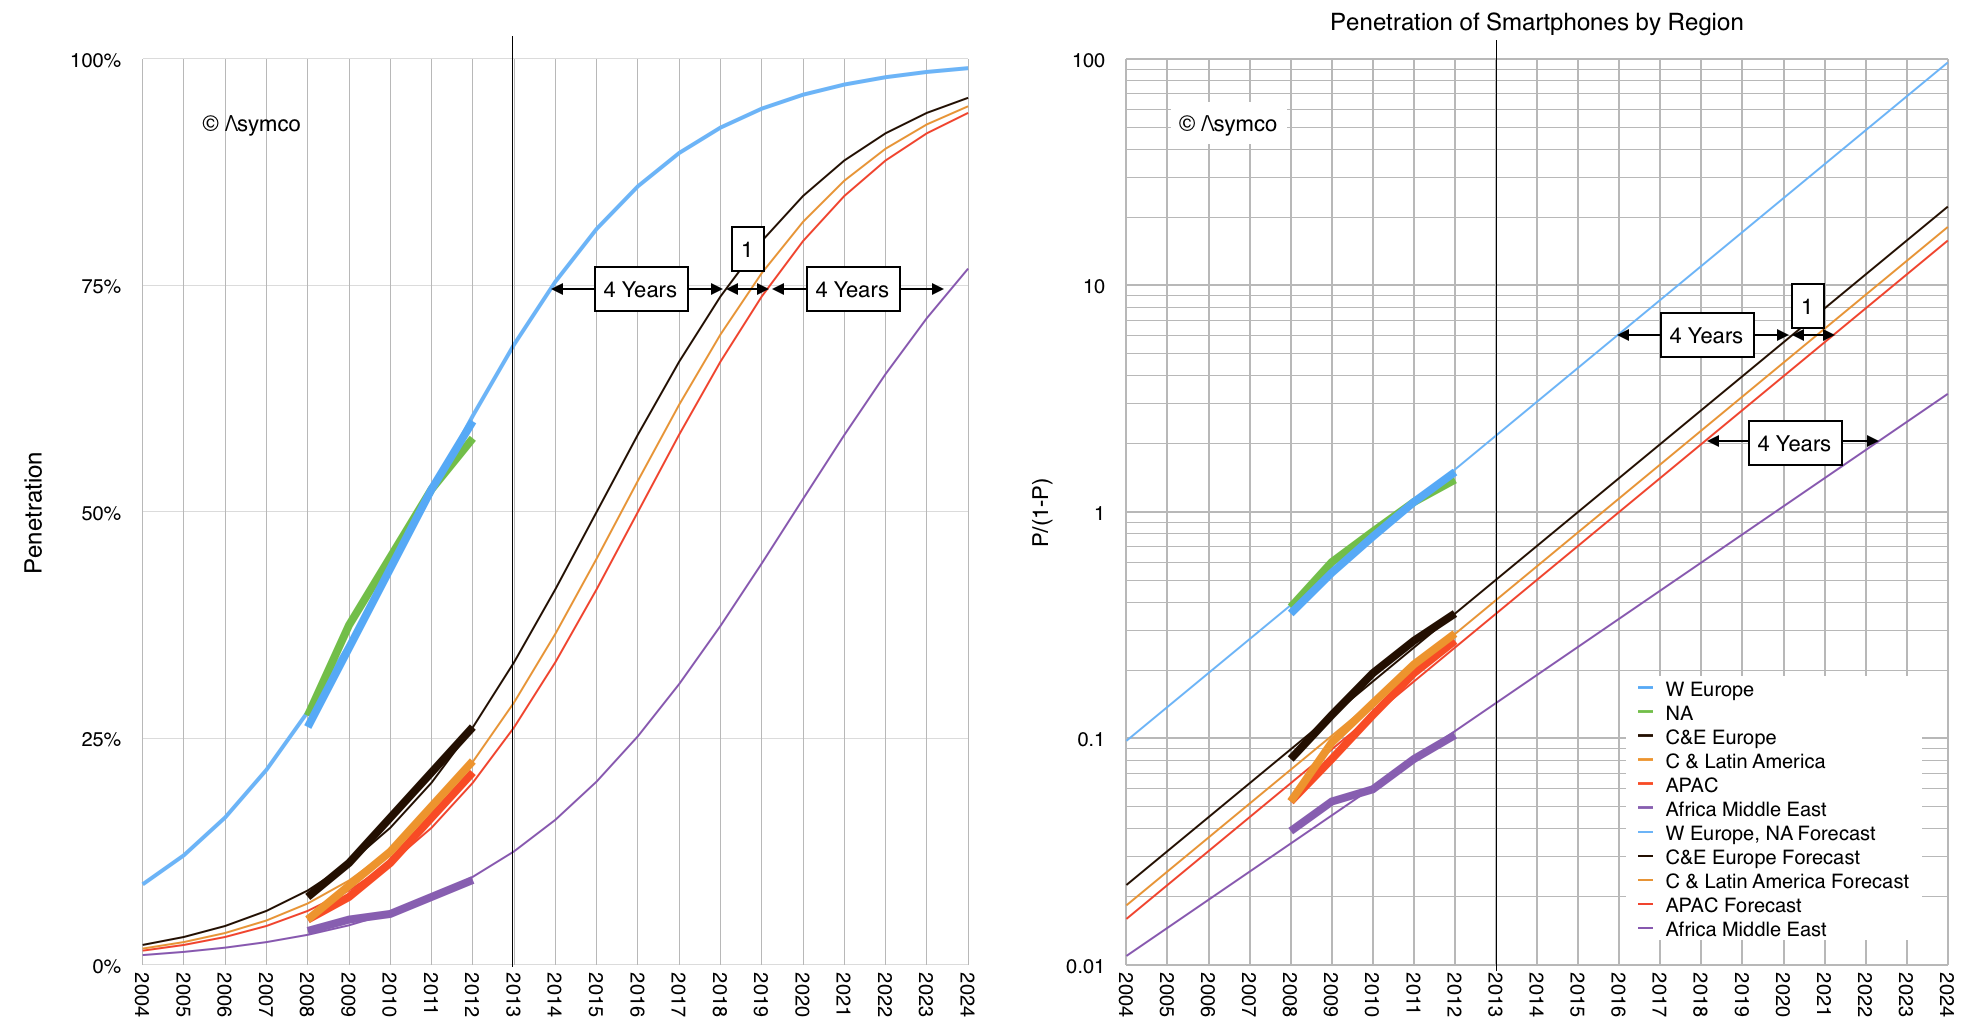
    Assuming similar patterns world-wide we can forecast regional smartphone penetration.

    Screen Shot 2014-04-07 at 7.56.49 AM

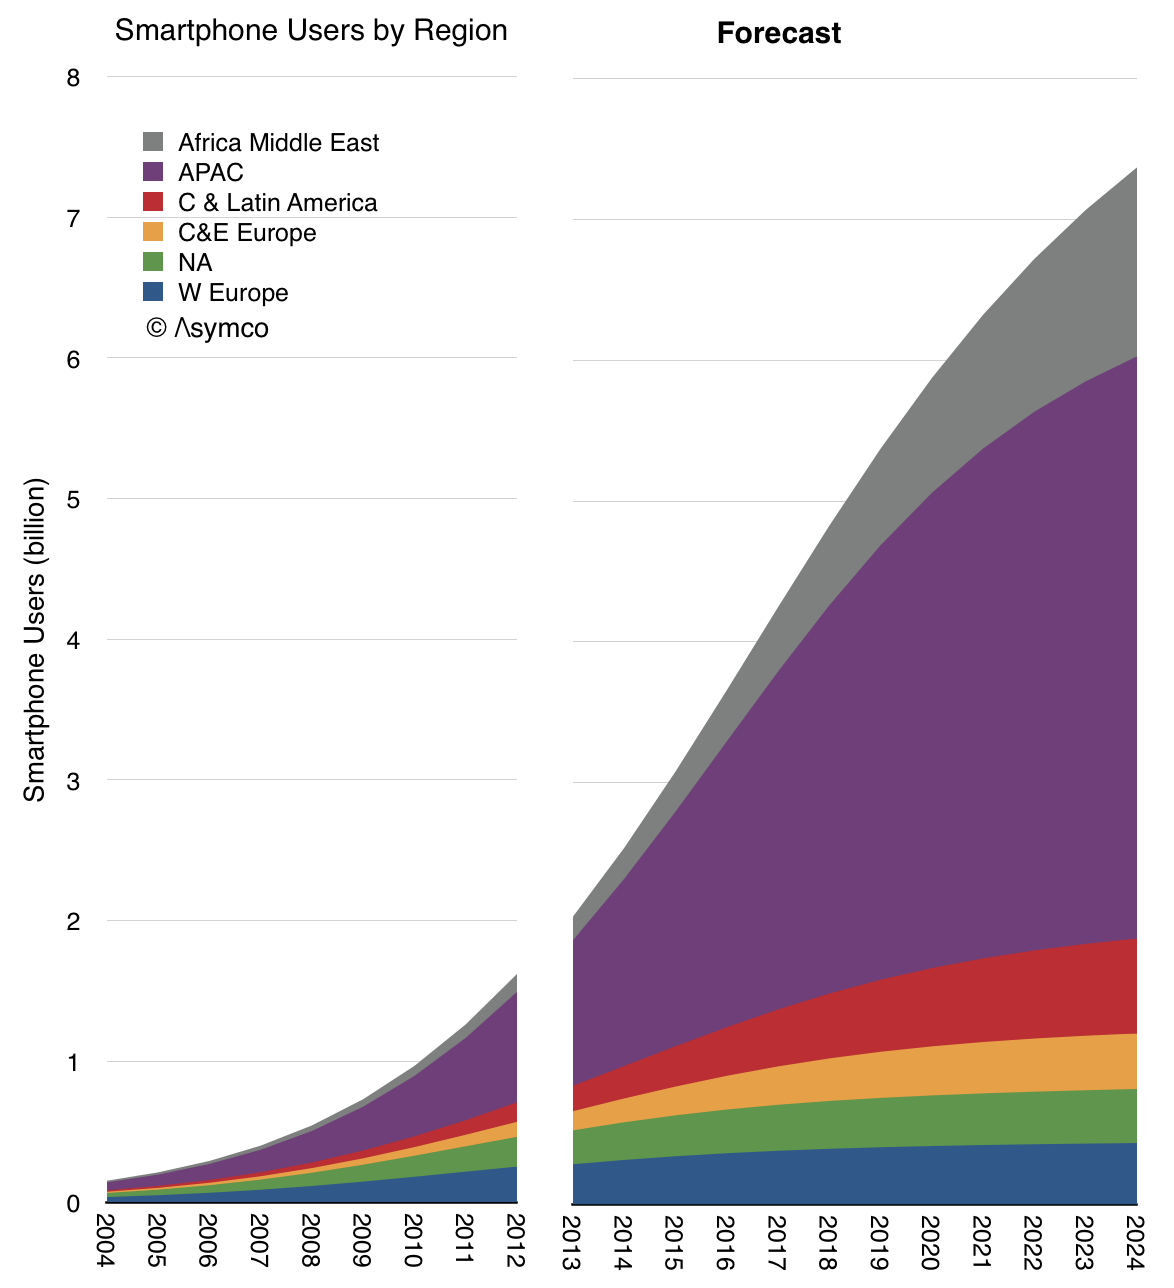
    This yields the following forecast for smartphone usage world-wide.

     alt=

    Three years ago the notion of smartphones becoming as ubiquitous as toothbrushes seemed far fetched but it's now gradually being accepted. The smartphone is well on its way to becoming the most successful technology in history.

    So what?

    What will the smartphone do for us? Does smartphone ubiquity change anything? Besides increasing ARPU slightly in a $1.2 trillion industry? Besides doubling the size of the device business? ((

    Screen Shot 2014-04-07 at 8.17.26 AM

    ))

    Besides creating a $20 billion app industry? How do we assess the impact of having a connected computer in one's pocket? In everyone's pockets? With us all day. Every day.

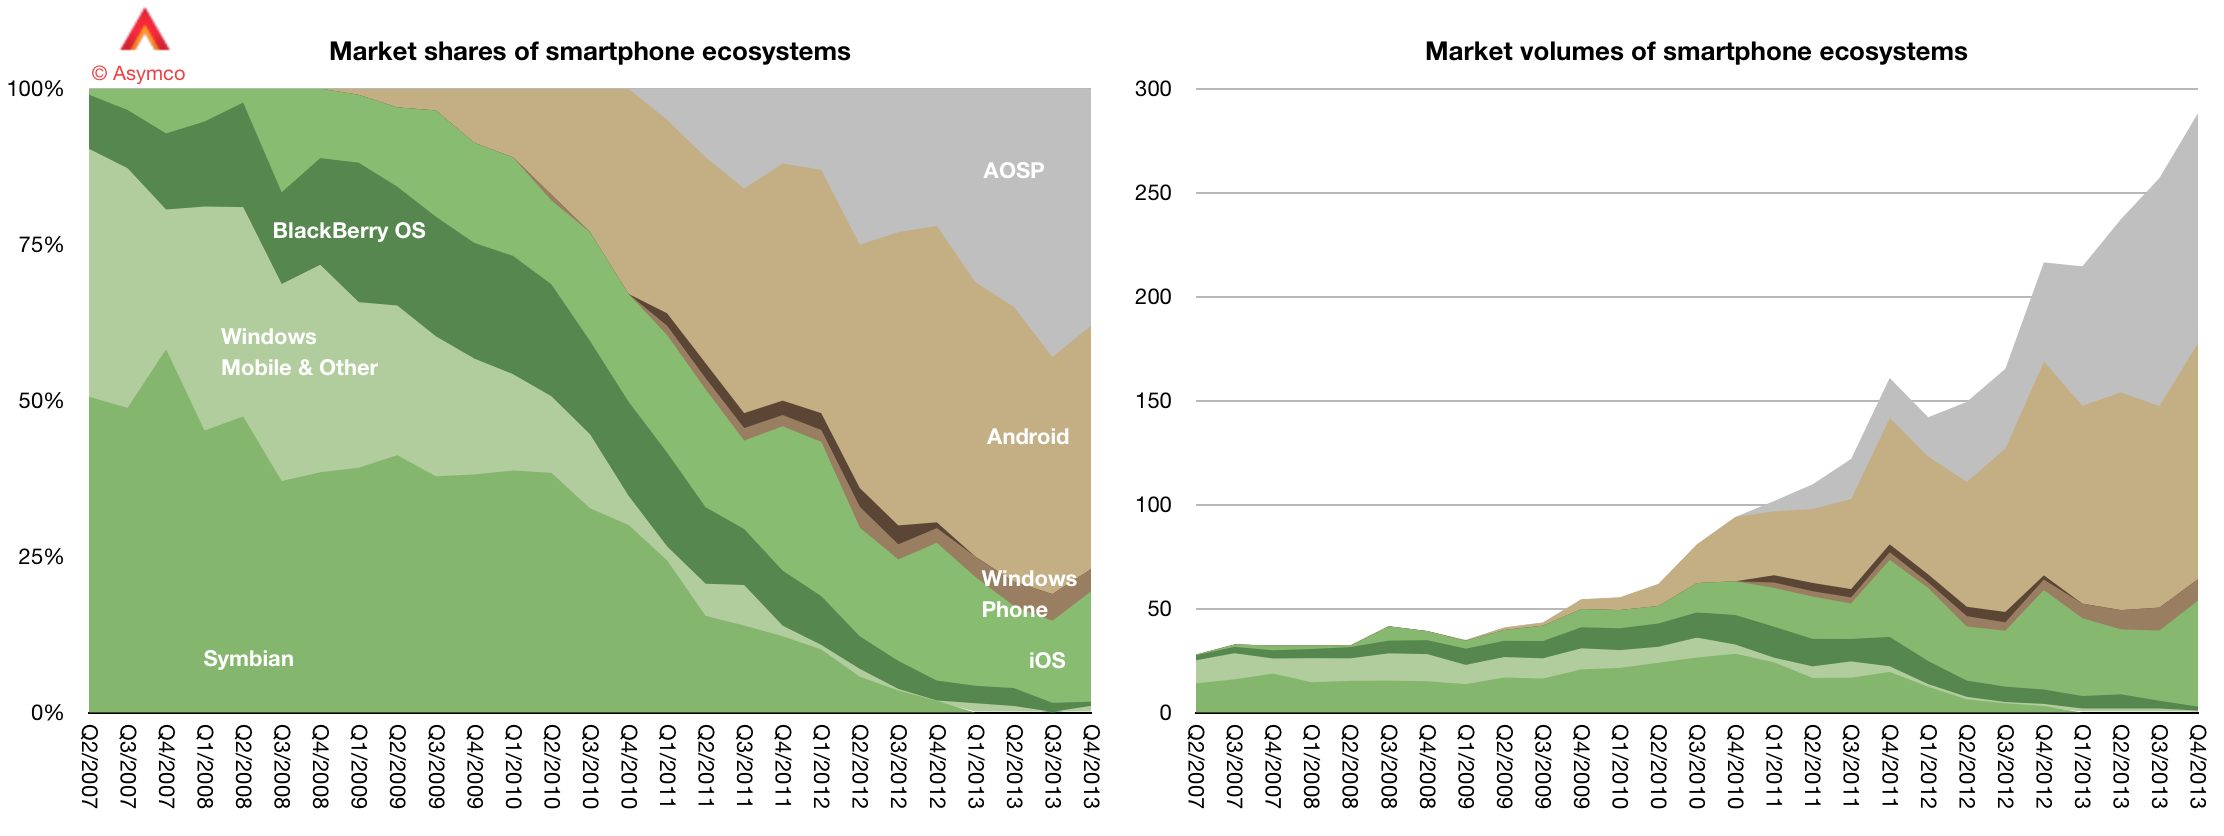
    Before we answer, we have to realize that the smartphone has been disruptive. Which means it has that special quality of not affecting the world in a predictable way. Its growth has been largely unforeseen and has affected the fortunes of the incumbents. As big and ubiquitous as it has become, the companies which were most intimately aware of it, its very own creators, were cursed by it.

    The evidence is in this graph:

    Screen Shot 2014-04-07 at 8.32.19 AM


    As the market exploded, the incumbent platforms all but disappeared. The innovators fell into the trap of treating the complex new product as a niche whose appeal was for selected "segments" described by the coarse data they were able to gather. Ubiquity itself was asymmetric to the basis of competition they established.

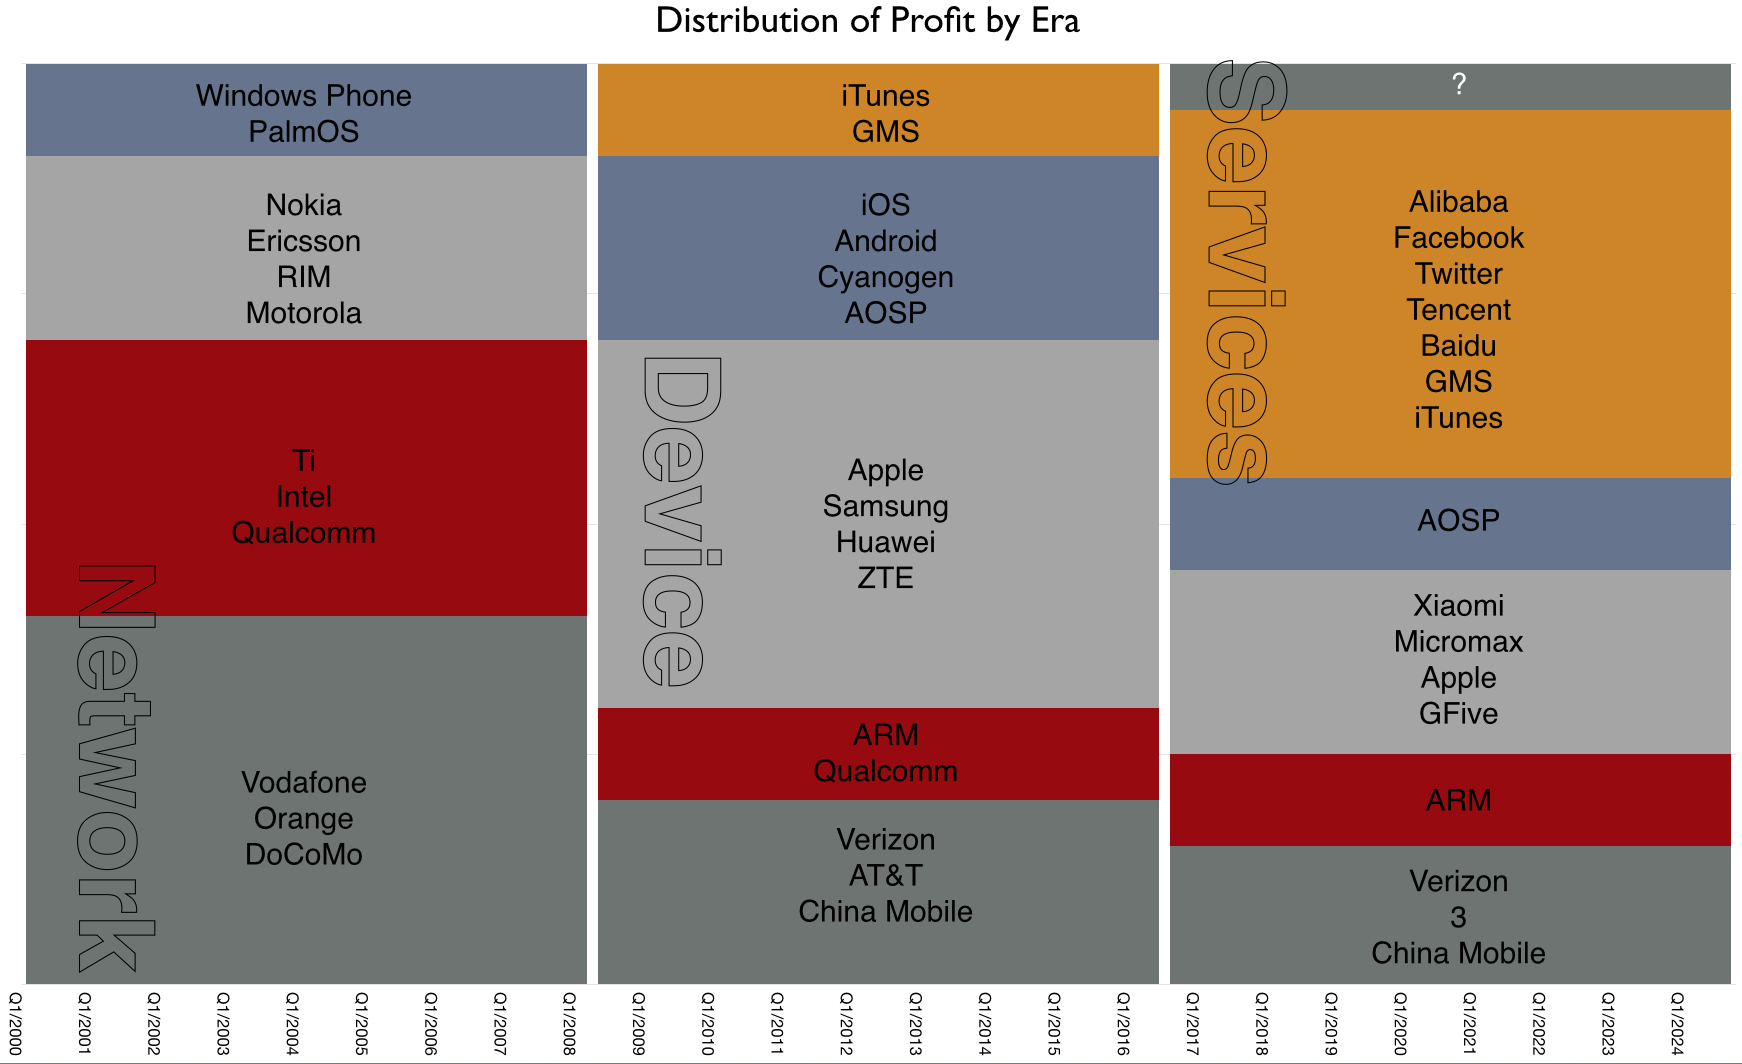
    Today we can note how even the usurpers iOS and GMS Android are being swamped by the more modular alternative AOSP. Indeed, if we squint a bit we might notice that the OS/platform churn we see is part of a trend where the value is migrating up the stack from Components and Networks, through Devices and Operating Systems and on to Services and Experiences.

    I call these the three mobile eras: (Firm names used are representative of a cohort and are not a complete list of participants.)

    Screen Shot 2014-04-07 at 8.51.45 AM

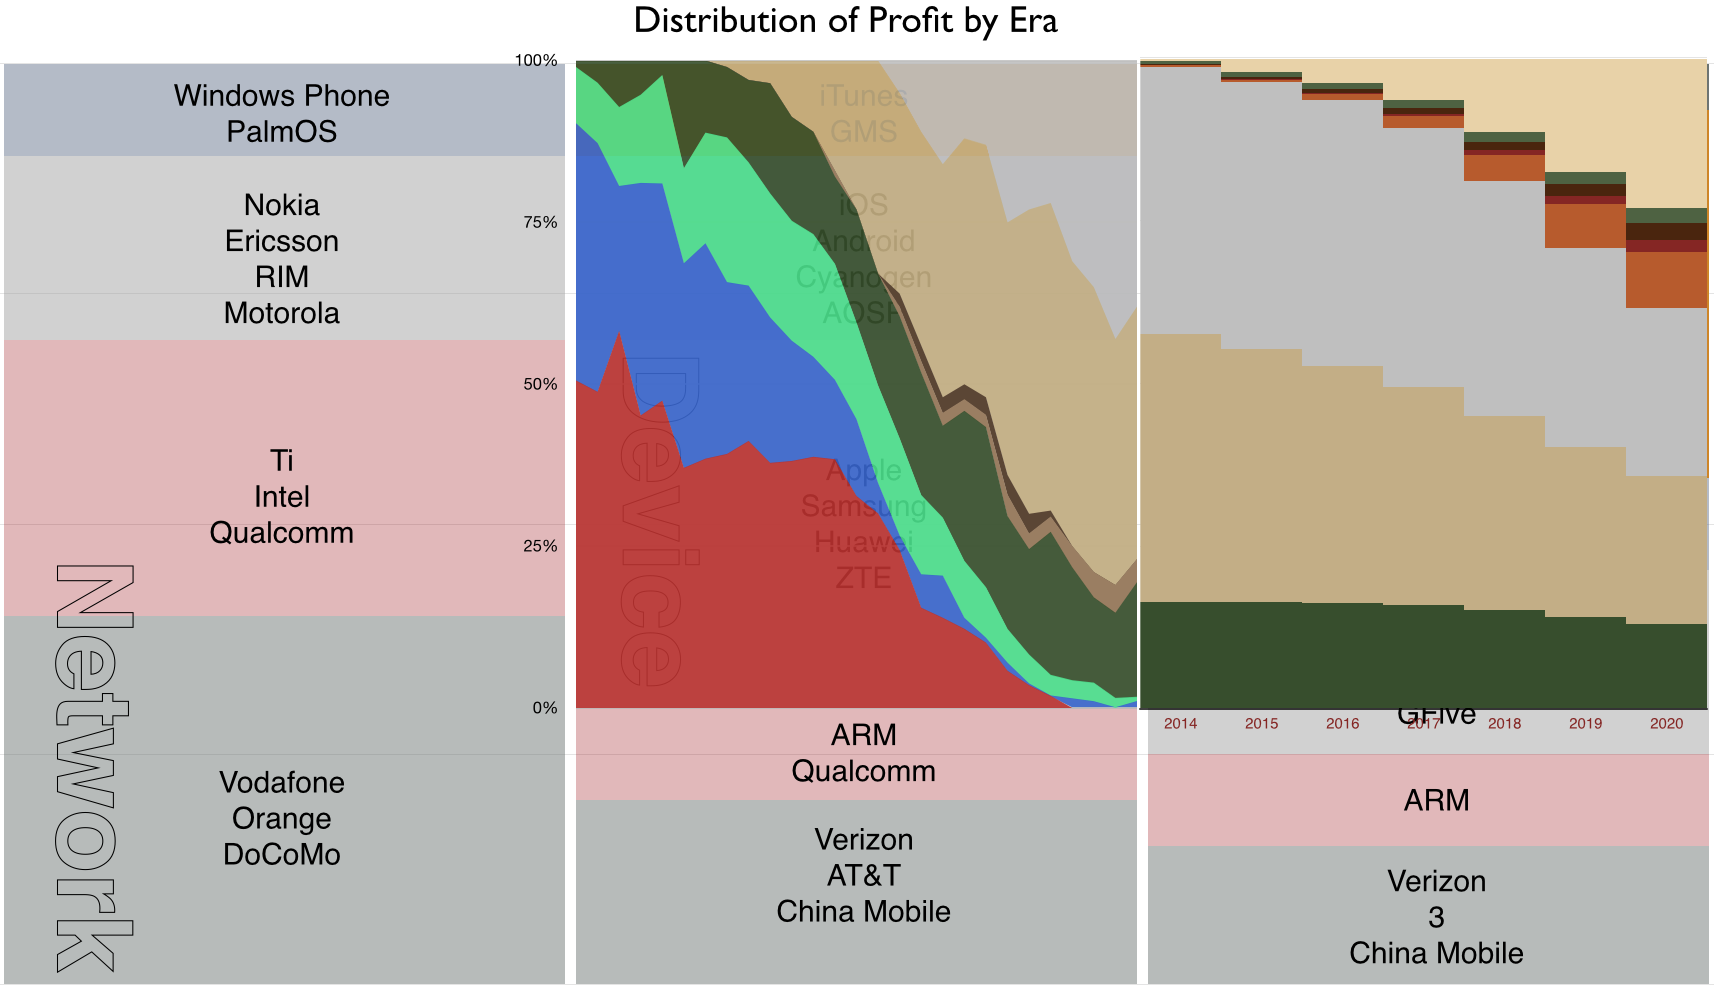
    The thesis is based on Value Chain Evolution Theory which states that disruptions cause profits to evaporate from commoditized segments and condense in adjacent spaces, usually toward more modular, more convenient or lower cost innovations.

    Note that the eras have specific time spans. If the pattern holds then we can overlay the time frame of smartphone penetration on these eras and even plot ecosystem entrants.

    Screen Shot 2014-04-07 at 9.06.55 AM


    Disruption suggests that we are likely to see yet more shifting of fortunes. It means enabling new ecosystems to take advantage of the modularization of platforms. But how can it happen given the entrenched nature of the incumbent duopolists?

    The clue lies in the first graph in this post: It suggests a geographic segmentation. The largest markets are large enough to sustain independent ecosystems. Note that China and Russia have already established alternative local service ecosystems. We may dismiss the possibility of localized Google and Facebooks in emerging markets but China and India are universes in and of themselves. But there are another 10 markets of more than 100 million users. That's another billion users among them.

    Screen Shot 2014-04-07 at 9.31.22 AM

    But it's not just the availability of a vast pool of new users. The rapidity of growth of services like WhatsApp and SnapChat and Tencent shows that barriers to entry are low. We see increasing indigenous innovation in payments, logistics and business models in the newest markets. We see no shortage of talent and capital to start these businesses. We see increasing language and culture clustering in social media. We see political resistance to hegemony.

    Focusing on the established, highly penetrated markets as an indicator of opportunity would be a mistake. Those markets foretell the rate of adoption but not the evolution of the value chain. Apple and Google will continue to anchor in those markets but there is no reason for the remaining two thirds of the world to follow. Indeed, there are incentives not to.

    Incentives exist to localize services. Indeed, service businesses have always been local businesses. There are few global service brands. This has been true in retail, transportation, banking, hospitality, media and communications. Why should we believe that ecosystems can overcome the advantages of localization? Services are local because they are delivered by individuals and have high "touch" with the user.

    Fundamentally, ecosystems are social systems and social systems have cultural and political dependencies. ((Post-modernism is a typological world view which  sees truth as socially constructed and a rejection of 'totality')) Technology does not homogenize unless it is centrally controlled. The control of mobile computing has already been abdicated by its creators.

  8. Invaluable

    Research · 323 comments

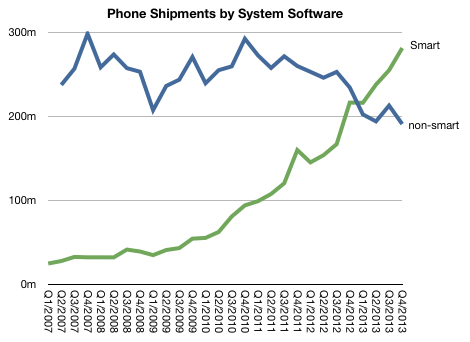
    The smartphone market continues to grow. 2013 saw total shipment of around one billion units (up from 683 million in 2012). In contrast, non-smartphone shipments continue to decline, with shipments around 800 million (down from 987 million in 2012).

    This pattern is shown below:

    Screen Shot 2014-03-18 at 3-18-12.45.12 PM

    Note that prior to 2012 the non-smart market seemed to be holding steady in spite of the growth in smartphones. The notion that smartphones would become universal was widely dismissed. I certainly heard many objections to my 2010 hypothesis that not only would smartphones become ubiquitous but that it would become increasingly difficult to find anything else to buy. (This in spite of the clearly evident demand for "low-end" non-smart devices.) ((The analogy I used was that of the black-and-white TV market as color TV became increasingly popular. There probably was a market for monochrome screens for a long time after they were discontinued but that is beside the point: the old technology becomes increasingly scarce because of economies of scale))

    I also suggested that the notion of distinguishing phones with the"smart" tag would become irrelevant and that we would just call these devices "phones". That is coming to pass, at least among the conversations I'm privy to.

    So if the conversation is about "phones" and the expectation that all phones will be smart, what can we observe about the market? The following graphs provide the picture of shipments, revenues and operating margin in absolute and relative measure for the most significant brands.

    Screen Shot 2014-03-18 at 3-18-12.42.08 PM

    This arrangement shows the disruptive effect of adding "smart" to phones. In only a few short years ((Six shown but the effect was pronounced already in four)) profits have dramatically shifted in the industry.

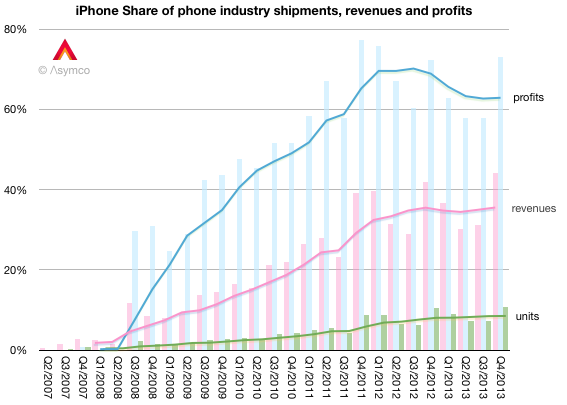
    Indeed, since the launch of the iPhone ((Which I consider to be the start of the current epoch of the industry)) the net profits earned by the collection of protagonists shown was $215 billion (($234 billion of positive operating earnings, offset by $19 billion of operating losses)).  60% has been earned by Apple, a newcomer to the market. That figure is also consistent on an ongoing basis, having reached 60% as early as 2011 and remained in a band around that figure since.

    Screen Shot 2014-03-18 at 3-18-1.23.52 PM

    The fact that this happened without corresponding dominance in units shipped shows evidence of something startling: Consistent value creation.

    To earn profit is hard, to do so in an outsized way is very hard and to do so with consistency shows a defensibility of market access that is rarest of all. The only cases where this typical is in a monopoly or protected market situation (aka cronyism.) Apple's lack of market monopoly coupled with a (near-) monopoly in profits can only be explained by disproportionate value creation.

    The mystery then is how is it possible to build a monopoly in value creation.

  9. When will smartphones saturate?

    Research · 45 comments

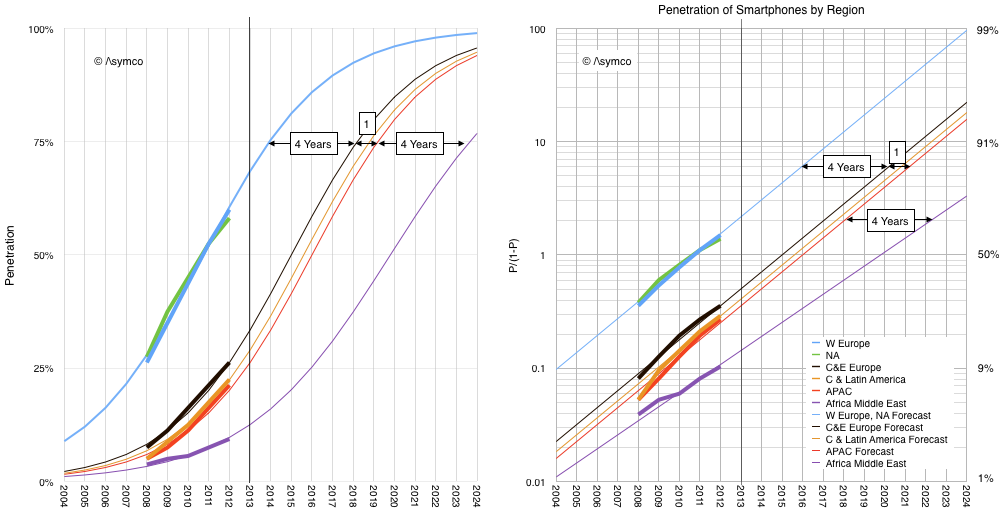
    GSMA Intelligence reports provide valuable statistics on the growth of mobile networks. One in particular shows the history of regional smartphone penetration.

    I took the historic data and plotted it as follows:

    Screen Shot 2014-01-07 at 1-7-1.43.56 PM

    Note that I chose to model using the same logistic function that I have used to describe the US market (as measured by comScore) and the global Internet user market (as measured by the ITU) and the stove, landline phone, Electricity, automobile, consumer radios, washing machines, refrigerators, TVs, dryers, air conditioning, dishwashers, microwaves, VCRs, PCs, cellphones.

    It's also the same model used to show the rise and fall of energy sources, canals, railroads, roads and air travel.

    If we believe that smartphones in parts other than US and Europe will behave the same way as all the other technologies listed above then the forecast penetration is likely to follow the thin lines in the graphs above. ((This is a big if, and, judging by their forecast, one which the GSMA Intelligence team seems not to believe will happen.))

    With the exception of Africa and Middle East, note that the primary difference between regions is not the rate of growth in penetration but rather the delay in adoption. I marked this delay as 4 years between US/EU and Central & Eastern Europe. An additional one year delay to Asia Pacific region and 4 years more to Africa/Middle East adoption.

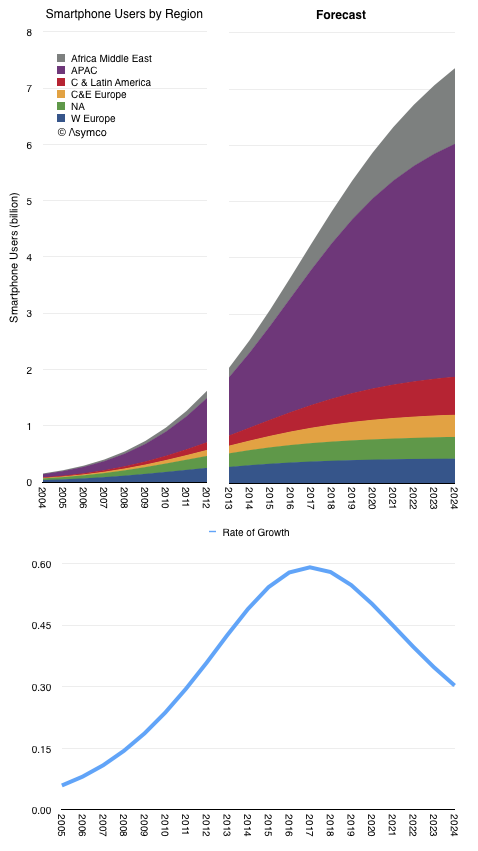
    The resulting smartphone user forecast is shown below.

    Screen Shot 2014-01-07 at 1-7-1.36.39 PM

    Although 2013 was often cited as the year when smartphones saturated ("everybody that wants one has one"), the total population of users will likely take another decade to reach maximum. The point of inflection in global growth could be expected in 2017.

    What most observers sensed was the point of inflection in growth in North America and Western Europe. Those regions are 11% of the world's population.

  10. How many Americans will be using an iPhone when the US smartphone market saturates?

    Research · 201 comments

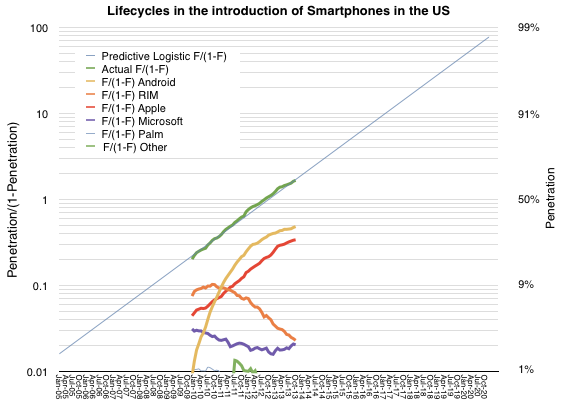
    As previously noted, the US smartphone market has followed an almost perfectly logistic growth. The measured data (via comScore, in green below) follows a predictive logistic function (thin blue whose formula is discussed here).

    Screen Shot 2013-12-13 at 12-13-11.30.54 AM

    The other notable market observation is how closely the iPhone follows the same pattern as the market. The red line representing the iPhone above is almost perfectly parallel to the green and blue lines which represent the overall market. The reason for this seems to be that consumers are absorbing the product in similar way to how they are absorbing the technology. ((Note that this pattern of adoption has happened even though the product has been at least partially unavailable to the entire market until quite recently.)) The "learning model" which underpins logistic models could offer clues as to the cause. It suggests that there is a direct communication that happens between the product and the consumer.

    Incidentally, the reason other platforms do not follow this pattern is that they are not communicating value with the consumer but with manufacturers or distributors of the product. These alternative communications could create faster or slower growth than the overall market as they are not subject to the same large population imitation/learning models.

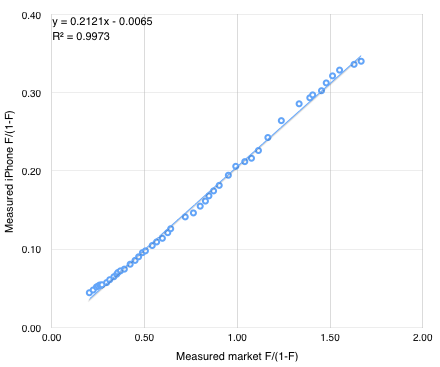
    If we believe that the iPhone can be modeled behaviorally then it may be possible to forecast its growth. One can simply draw a line extending the existing red segment above and read the F/(1-F) figure at any point in time. Solving for F results in a measure of penetration and hence number of users (if population is known.)

    An alternative is to use the following formula derived from the linear interpolation of the two measured market shares. iPhone market share is y/(1+y) where y=0.21x and x = F/(1-F) and F is the expected market penetration of smartphones.

    Screen Shot 2013-12-13 at 12-13-11.29.59 AM

    So if F = 91%, x = 10, y = 2.11 and therefore the iPhone market share =  68%.

    We also know from the plot of the market that F = .91 is reached around February 2017. So we can suggest that at 90% penetration (approximately saturation) the iPhone will have 68% market share of users in the US. Forecasting the addressable market (US population aged older than 13) at about 266 million that implies 180 million US users of the iPhone by early 2017.

  11. Updated US Smartphone Saturation Forecast

    Research · 37 comments

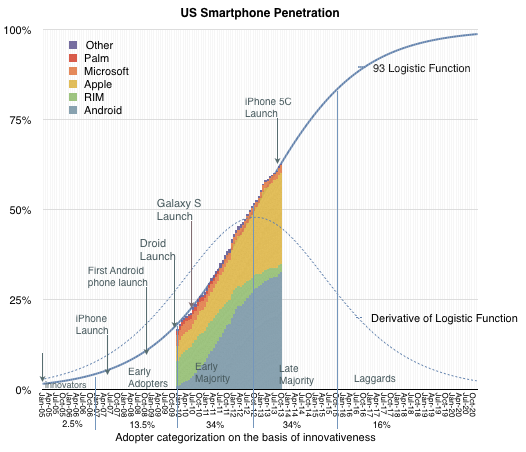
    The latest comScore US smartphone survey showing three months' ending October data has been released and there were no surprises. Smartphone penetration grew to 62.5% representing 149.2 million users. I made a slight adjustment to the predictive logistic function parameters (p1 = 93, p2 = 22.5).

    Logistic

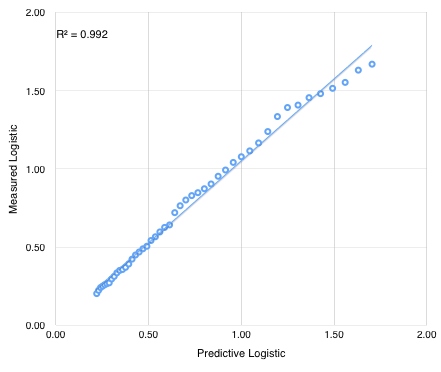
    The correlation between predictive and actual logistic function (P/(1-P)) is shown below.

    Screen Shot 2013-12-10 at 12-10-10.31.29 AM

    90% penetration (P/(1-P) = 9.23) is now expected by December 2016 when about 230 million users will be using smartphones in the US.

    Screen Shot 2013-12-10 at 12-10-10.32.13 AM


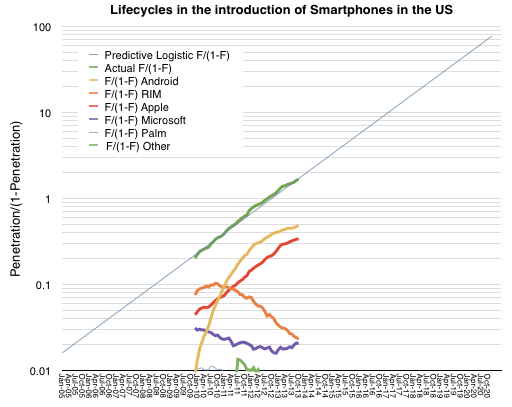
    Individual platforms adoption curves are shown as colored areas above and as lines on a logistic plot below:

    Screen Shot 2013-12-10 at 12-10-10.34.45 AM


    The parallel behavior of iPhone and the overall market remains unchanged.