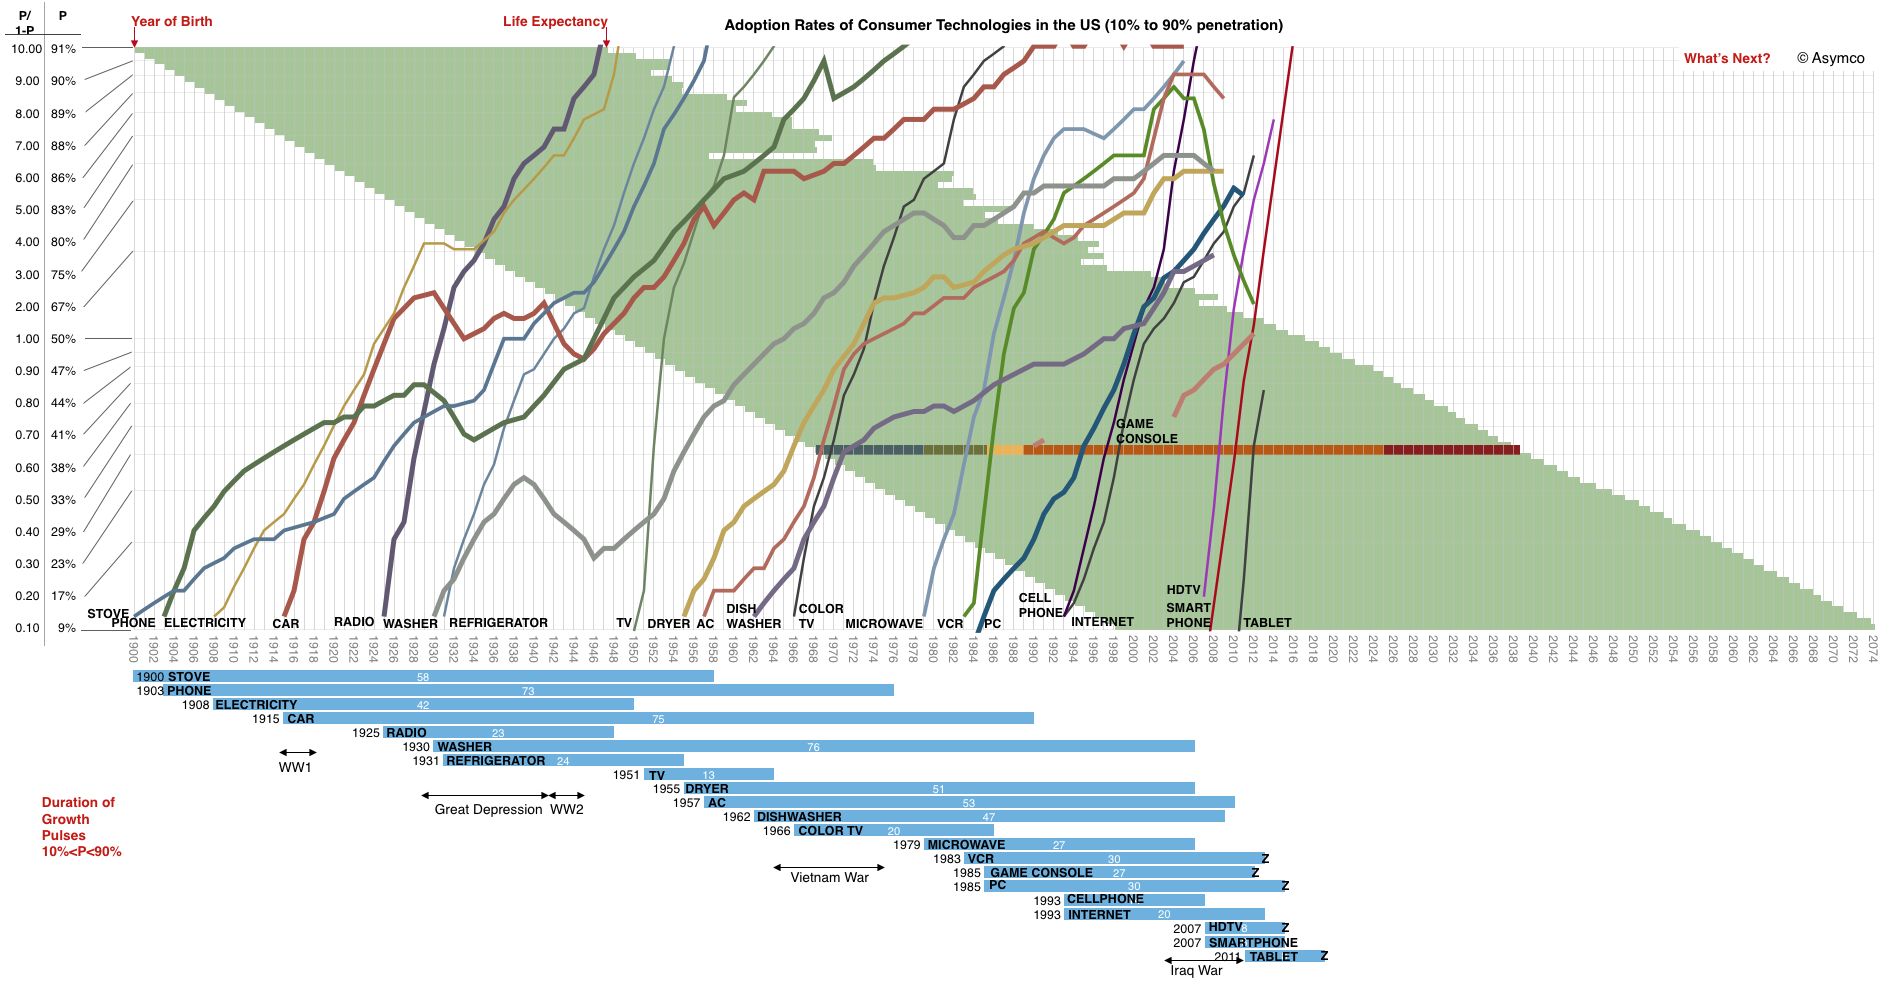
The adoption of smartphones in the US is on track for reaching 90% of the available audience by August 2016. This is a mere eight years after smartphones reached 10% penetration. As far as technologies go, that's pretty fast. To get an idea of how rapid, I plotted a few other technologies and the time they took to grow within the US market.
A few things to note:
The time scale has a yearly resolution spanning 1900 to 2074
The penetration scale is logarithmic and shows the ratio of Penetration/(1-Penetration) allowing a linear view of logistic growth.
The blue bars summarize the growth pulses and give a starting year and duration in years.
Note some traumatic events are marked on the time frame. They partly explain innovation gaps or decreases in adoption.
The life expectancy of Americans born from 1900 to 1998 is also shown as green bars. This allows the reader to trace which technologies emerged during the lifetimes of people they might have living memories of. I overlaid one specific lifetime beginning in 1968 and color coded with Childhood, Adolescence, Higher Education, Work live and Retirement as a guide. You can note how the PC emerged when that person would have been in college.
Some technologies have not yet saturated and may never do so. They are marked with a "Z" on the bar graph. It might be instructive to understand why.
You'll also note that the time frame does not end today but that the technology curves do. The time frame includes the expected lifespan of someone born in 1998.
What will they see?
There is a lack of visibility or certainty among observers that anything worthy of inclusion on this graph will ever emerge.
And yet, when glancing at this graph, it would seem that the addressable market, the rate of introduction of new technologies and the speed of adoption have all increased. The area to the right of 2013 looks inviting to a plot of many lines.
Indeed, for the canvas to remain blank would be the riskiest of bets.
All theoretical and empirical diffusion studies agree that an innovation diffuses along a S-shaped trajectory. Indeed, the S-shaped pattern of diffusion appears to be a basic anthropologic phenomenon.
This observation dates as far back as 1895 when the French sociologist Gabriel Tarde first described the process of social change by an imitative "group-think" mechanism and a S-shaped pattern. ((Tarde was probably influenced by mathematician Pierre François Verhulst who first published the logistic function in 1845)) In 1983 Everett Rogers, developed a more complete four stage model of the innovation decision process consisting of: (1) knowledge, (2) persuasion, (3) decision and implementation, and (4) confirmation.
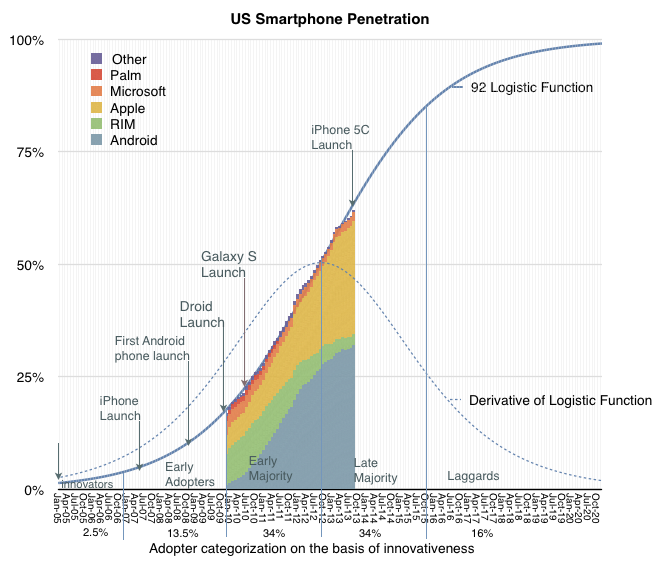
Consequently, Rogers divided the population of potential adopters according to their adoption date and categorized them in terms of their standard deviation from the mean adoption date. He presented extensive empirical evidence to suggest a symmetric bell shaped curve for the distribution of adopters over time. This curve matches in shape the first derivative of the logistic growth and substitution curve as shown below.
In the graph above I applied the Rogers adopter characterization to the data we have on the adoption of smartphones in the US. The latest data covering September is included.
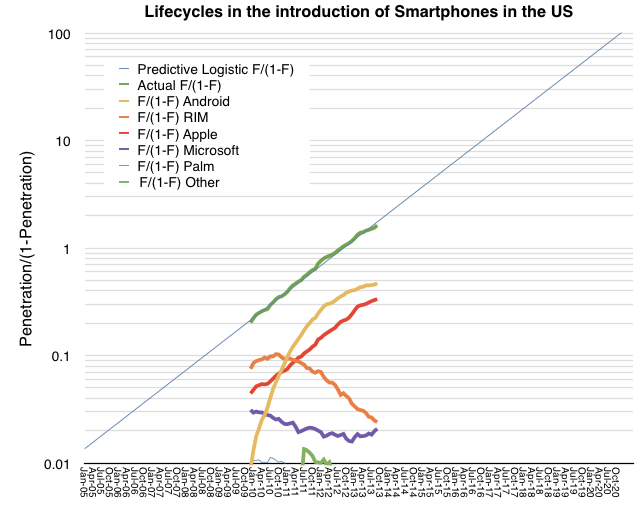
The fact that smartphones in the US follow the theory is exciting, but what can we conclude about the adoption of specific platforms? There has been quite a bit of turnover in the leadership of the market in the first half of the time frame given. You can see this more clearly in the following fractional market share transformation.
Note that, with the exception of the iPhone, if each platform is studied individually, it would not follow a logistic (i.e. linear) pattern even though, as a whole, the technology does.
This then is the big puzzle: while we might be able to predict how smartphones will diffuse into society, we can't seem to predict how any single firm will fare. This means that an investor cannot make a credible "bet" on the technology ((Indeed investors often get burned when new technologies emerge. While the technology booms, individual firms supplying it often fail. See the history of transportation, communication, computing and energy.)). If they choose a single company as proxy, chances are they will lose. If they bet on a basket of companies then, again, chances are they will lose. There is usually one unforeseeably clear winner.
Before we get further into the question of picking winners or predicting the future division of share among rivals, we should understand the underlying causes for this pattern of adoption.
Rogers concluded that the learning behavior of individuals is the underlying cause of the symmetry of the diffusion process.
At the beginning, when an individual is confronted with a new (learning) situation they make many mistakes. These mistakes are gradually reduced (by learning) over time because more and more information is received and acts as a stimulus. The gain in learning per trial is proportional to the product of the amount already learned and the amount remaining to be learned before the limit of learning is reached.
Arnulf Grübler ((The Rise and Fall of Infrastructures, Physica-Verlag 1990)) explains:
This is exactly equivalent to the F(1-F) transformation of the logistic curve. It should be emphasized that these properties of the learning process were found in real learning situations and are confirmed by a large number of laboratory and field experiments. Thus each adoption of an innovation in a social system is equivalent to a learning trial by an individual. Thus, the symmetric diffusion pattern results from the way messages about an innovation are emitted and processed by social learning.
So these observers of the process assign learning behavior as the cause for adoption of a technology. Can the learning behavior be applied to individual platforms? It's tempting.
The hypothesis would go as follows: adopters are not only processing messages about the new technology but they are also trying different platforms as they enter and as they upgrade their phones. If we see platform choice as a learning process then if one platform has a natural advantage, it settles into a dominant position as users "learn" of its advantage. Conversely, if no platform has an advantage then platform "churn" repeats as rivals gain/lose positions of leverage in the market.
The pattern shown so far seems to point to Apple's iPhone having a logistic pattern indicating that it might be benefiting from a learning pattern. The alternative platforms may simply be jockeying for temporary advantage.
It's an interesting hypothesis. To be developed further we need to answer what any learnable advantage might be. I suspect it has to do with the ability to solve unmet and unarticulated needs. In other words, that the winning product solves a set of "jobs to be done" which are difficult to pin down and are perceived rather than defined.
Using logistic curves to measure diffusion of innovations is a powerful method of analysis. However there are limits to what can be learned. The methodology helps in understanding how quickly a pervasive technology is adopted. It assumes that the technology "fills all available space" within a market. It therefore also assumes that whatever problems the technology solves are universal problems.
Put another way, if a technology is not universally useful, it tends to peak before a market saturates. This "universality" condition is in evidence when observing that pervasive technologies are adopted not only by all members of one national market but also all nations and through all means of government and regulation. In other words that the jobs that the technologies are hired to do are so important that they bulldoze any and all obstacles placed in the path of adoption.
The only difference is one of timing. Some regions are quicker than others. Institutionalized obstacles essentially defer rather than deter adoption. They impede rather than block.
And I am pretty sure that smartphones solve universal needs and their adoption will be nearly 100%. They also have fairly low impedance given the speed of adoption (50% penetration in most large markets seems to come in less than 5 years.)
That's the story for the technology, but how value is captured is another story.
Who captures and how it's captured are questions of commerce not economics. They are informed by competitive advantage and business models. The puzzle seems to be that individual companies don't capture value in the patterns of Logistic curves. Or at least I don't think they do.
Consider the graph below.
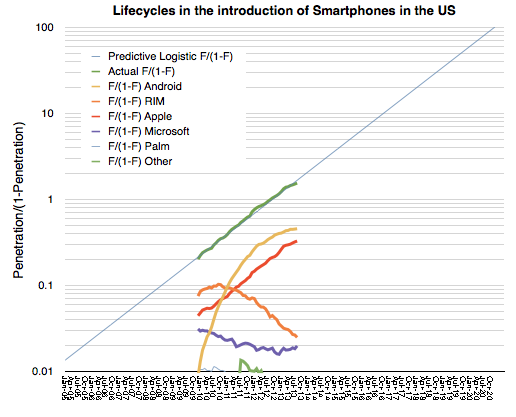
It shows the transformation of a logistic curve into a linear representation. It's a log-scale graph of fractional shares of smartphones in general (Blue/green Lines) and individual platforms in the US.
The individual platforms are shown as (Platform x share of all phones/share of all others). This is a "logistic substitution trajectory". ((Fisher and Pry, 1971, proposed a similar model to study the replacement of old by new technologies. The basic assumptions of the Fisher-Pry model are: (1) The substitution process is competitive. (2) Once substitution by the new technology has progressed as far as a few percent (i.e., "lock-in"), it will proceed until a complete takeover occurs. (3) the rate of fractional substitution F1 is proportional to the remaining substitution 1- F1 possible. Source: Grübler, The Rise and Fall of Infrastructures Physica-Verlag 1990.))
The problem is that whereas the overall category (smartphones) reaches saturation, it's not at all clear that any individual platform does. At least from the data we have so far, there is far too much volatility in platforms to see a clear pattern of monopoly emerging.
I'm not sure if this is "proof" enough to convince anyone that this market supports any number of platforms, but it certainly disproves that there will be only one. ((The odd pattern here seems to be Apple's consistent (i.e. parallel) adoption. One hypothesis could be that Apple is different in solving the prevailing job to be done while rivals jockey for positional advantage.)) We're too far along for churn to convert existing users before saturation sets in.
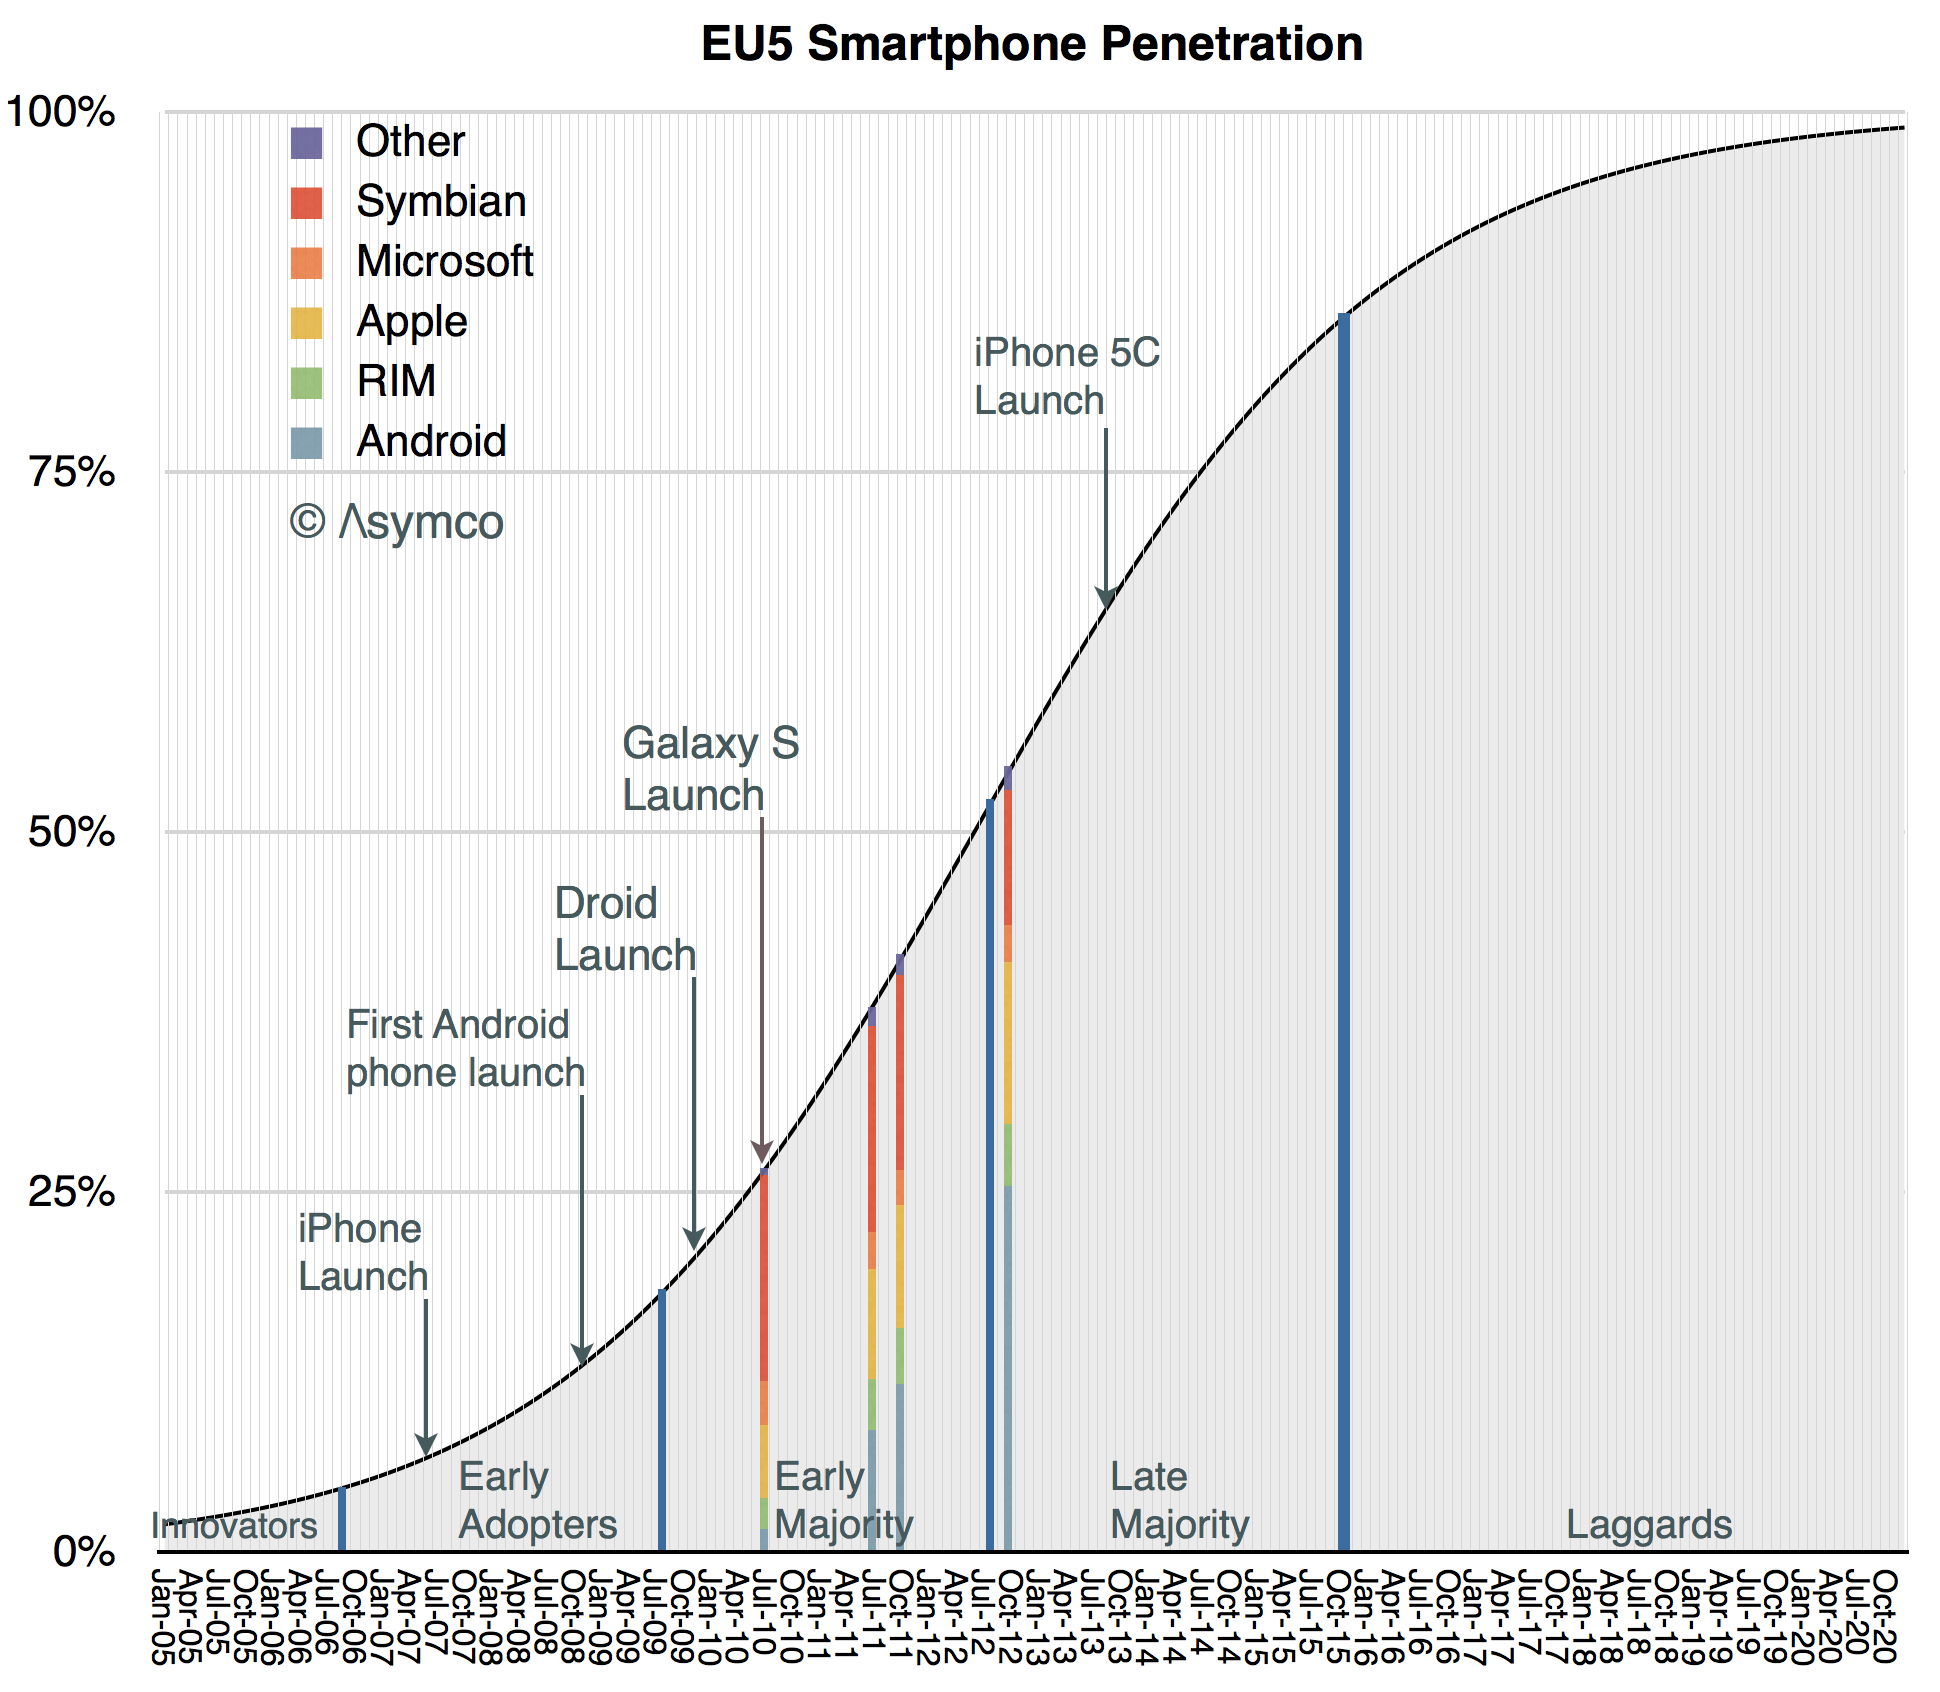
Thanks to Symbian, the EU5 countries (France, Germany, Italy, Spain and the UK) had an earlier start in the conversion of phone usage from non-smart to smart devices. According to published comScore data, in July 2010 the EU5 were at 26.6% penetration of smartphones and the US was at 22.8% ((The population is defined as adults using phones for themselves. Meaning it excludes children and phones purchased by companies.)).
However, with the aid of mobile operator subsidies, by the beginning of this year, the US caught up. According to comScore EU5 reached 57% penetration in March 2013 while the equivalent figure for the US was 58%.
Using the logistic curve model introduced last week, it's possible to get an approximate categorization of the adopters of the technology:
As with the previous analysis, the graph identifies the following dates:
The Innovators' period ended in the EU5 approximately in September 2006. (The equivalent period ended in the US in February 2007.)
The Early Adoption period ended in the EU5 in August 2009. (US: December 2009).
The Early Majority period ended in the EU5 in August 2012. (US: September 2012)
Late Majority will end in the EU5 in November 2015 (US: November 2015)
Therefore if we want to suggest that saturation happens near 100% then the answer to the question in the headline is "the end of 2020." If we want to suggest that saturation is the end of the Late Majority then the answer is "two years from now."
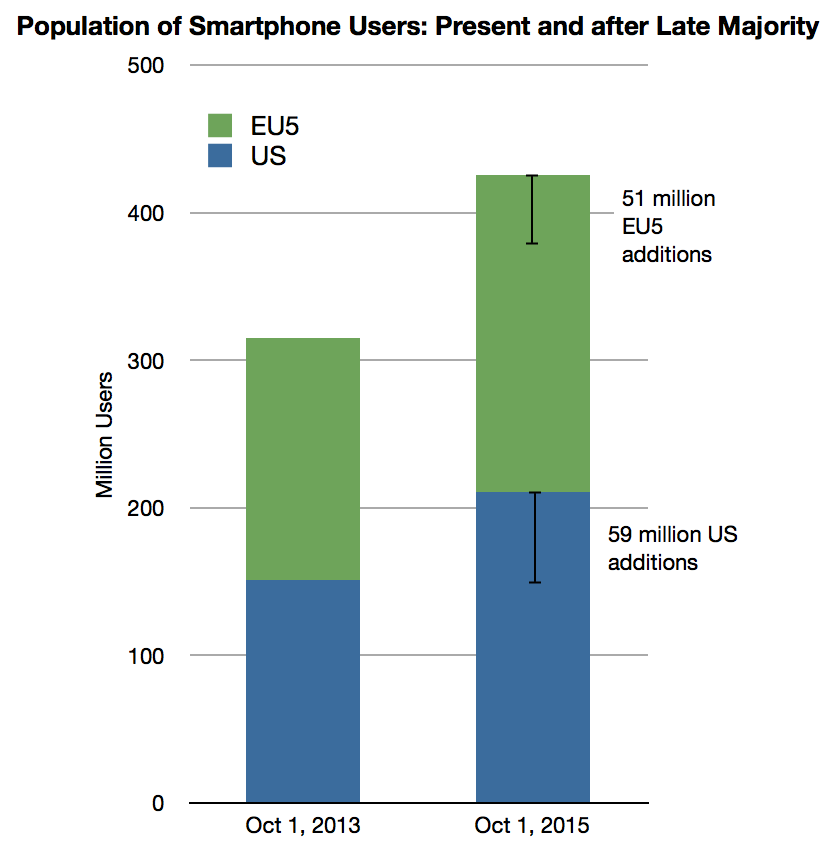
One final observation: the two markets appear to be converging thus placing the analyst in the comfortable position of forecasting the adoption of smartphones for a total population of 425 million people ((see previous note)).
If we define saturation as the end of the "Late Majority" period then the number of new-to-smartphone users remaining for the combined EU5 + USA markets is 110 million of which 59 million will adopt in the US and 51 million in Europe. They will all join ecosystems in the next two years.
In yesterday's post forecasting smartphone penetration I neglected to mention the exact subset of the US population being sampled. The analysis is based on comScore's sampling which covers only those devices which are the "primary phone" for users over 13 years old and not provided by an employer.
In other words, the population being sampled is not meant to identify how many phones will be in use but rather what is the primary phone for those non-children who choose their own phones.
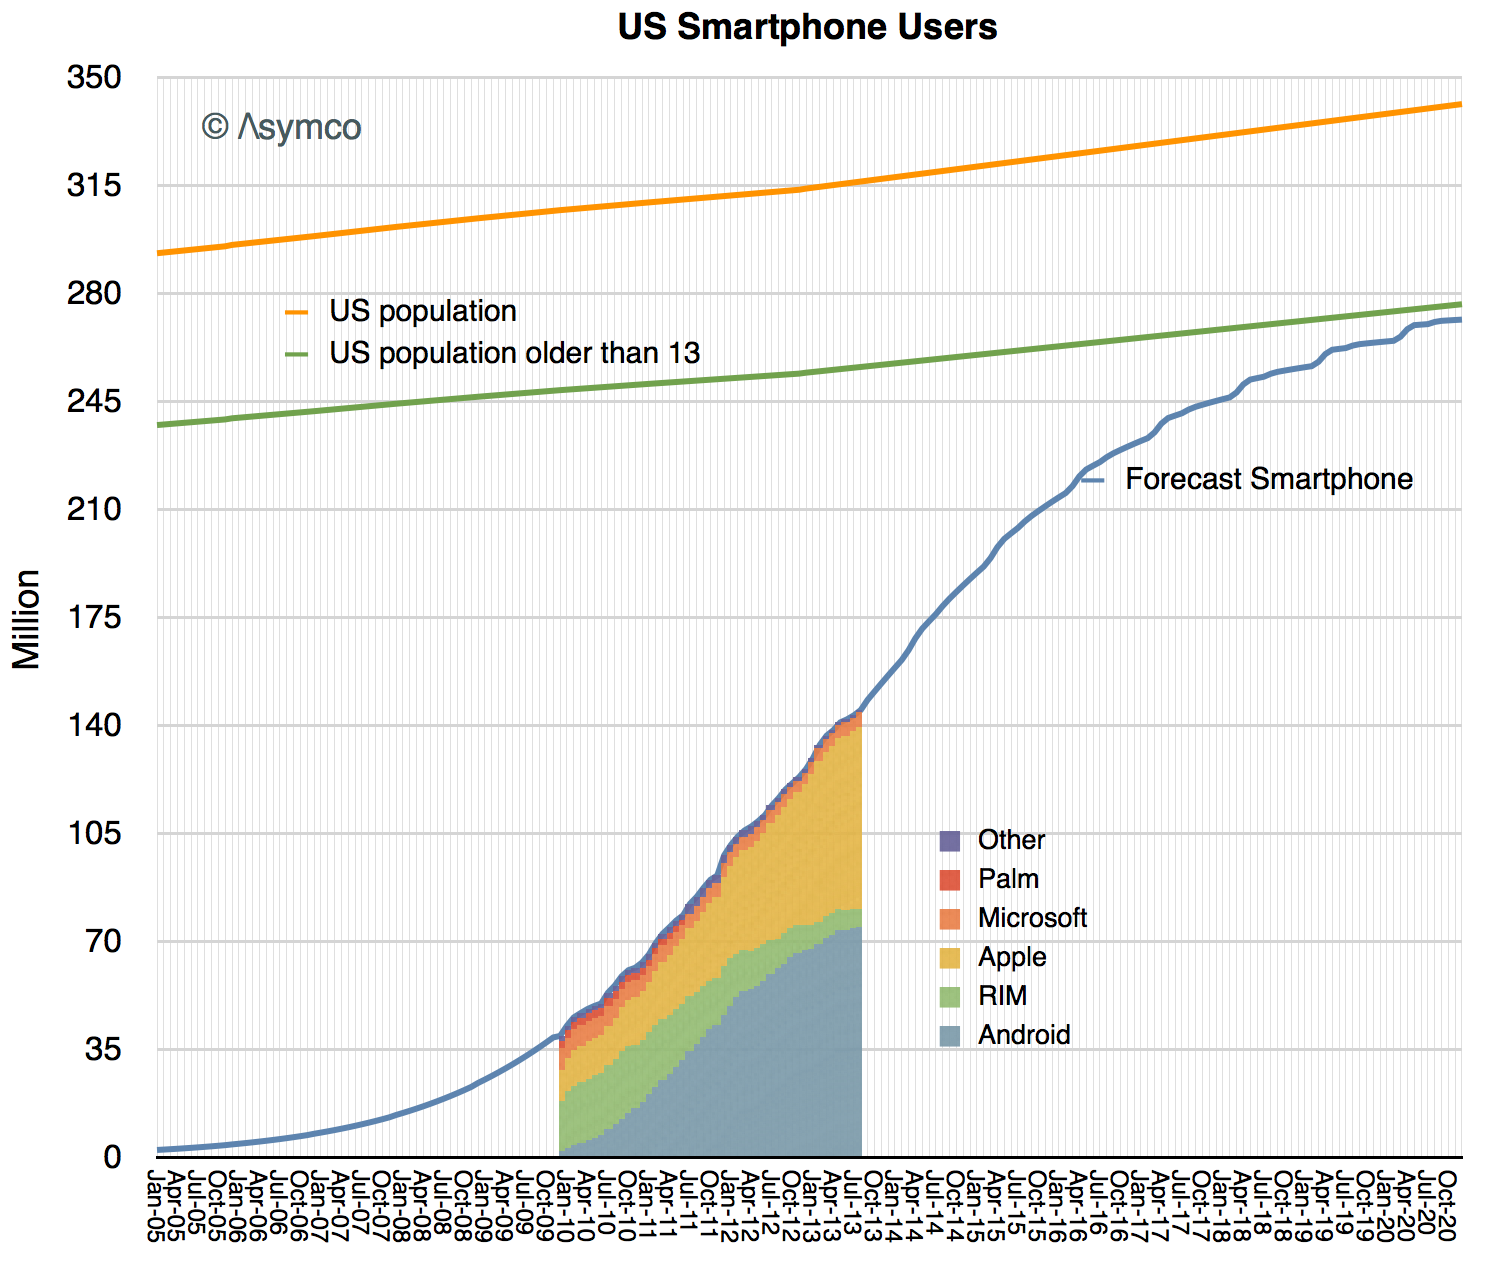
So the measurement that can be obtained from the S curve analysis is a subset of all phone users and will not identify exactly how many phones will be in use. Given that, this is what that subset looks like:
I drew a line showing the census data (and projection) for the US population and estimated what percent of that population might be older than 13 years ((I estimate 19% of the population is 0 to 13 years of age.))
Of the remaining population, I expect smartphones will be used by nearly all by end of 2020.
That means about 270 million users. It also means that about 125 million more than are using smartphones today. Note also that a significant number of those under 13 will also use smartphones and that the metric is "primary phone" and insofar as there are more than one phone for some users they are a multiplicative factor. Finally this measure does not account for company assigned devices.
So although this measures how many users will use smartphones, the total number of such phones in use is likely to be significantly higher.
Finally, when considering the market's potential size it's important to have an accurate estimate of how frequently these phones are replaced. So, for instance, if we guess that 300 million smartphones will be in use and that they get replaced every 2 years then it follows that the US market for smartphones would be about 150 million units per year in 2020.
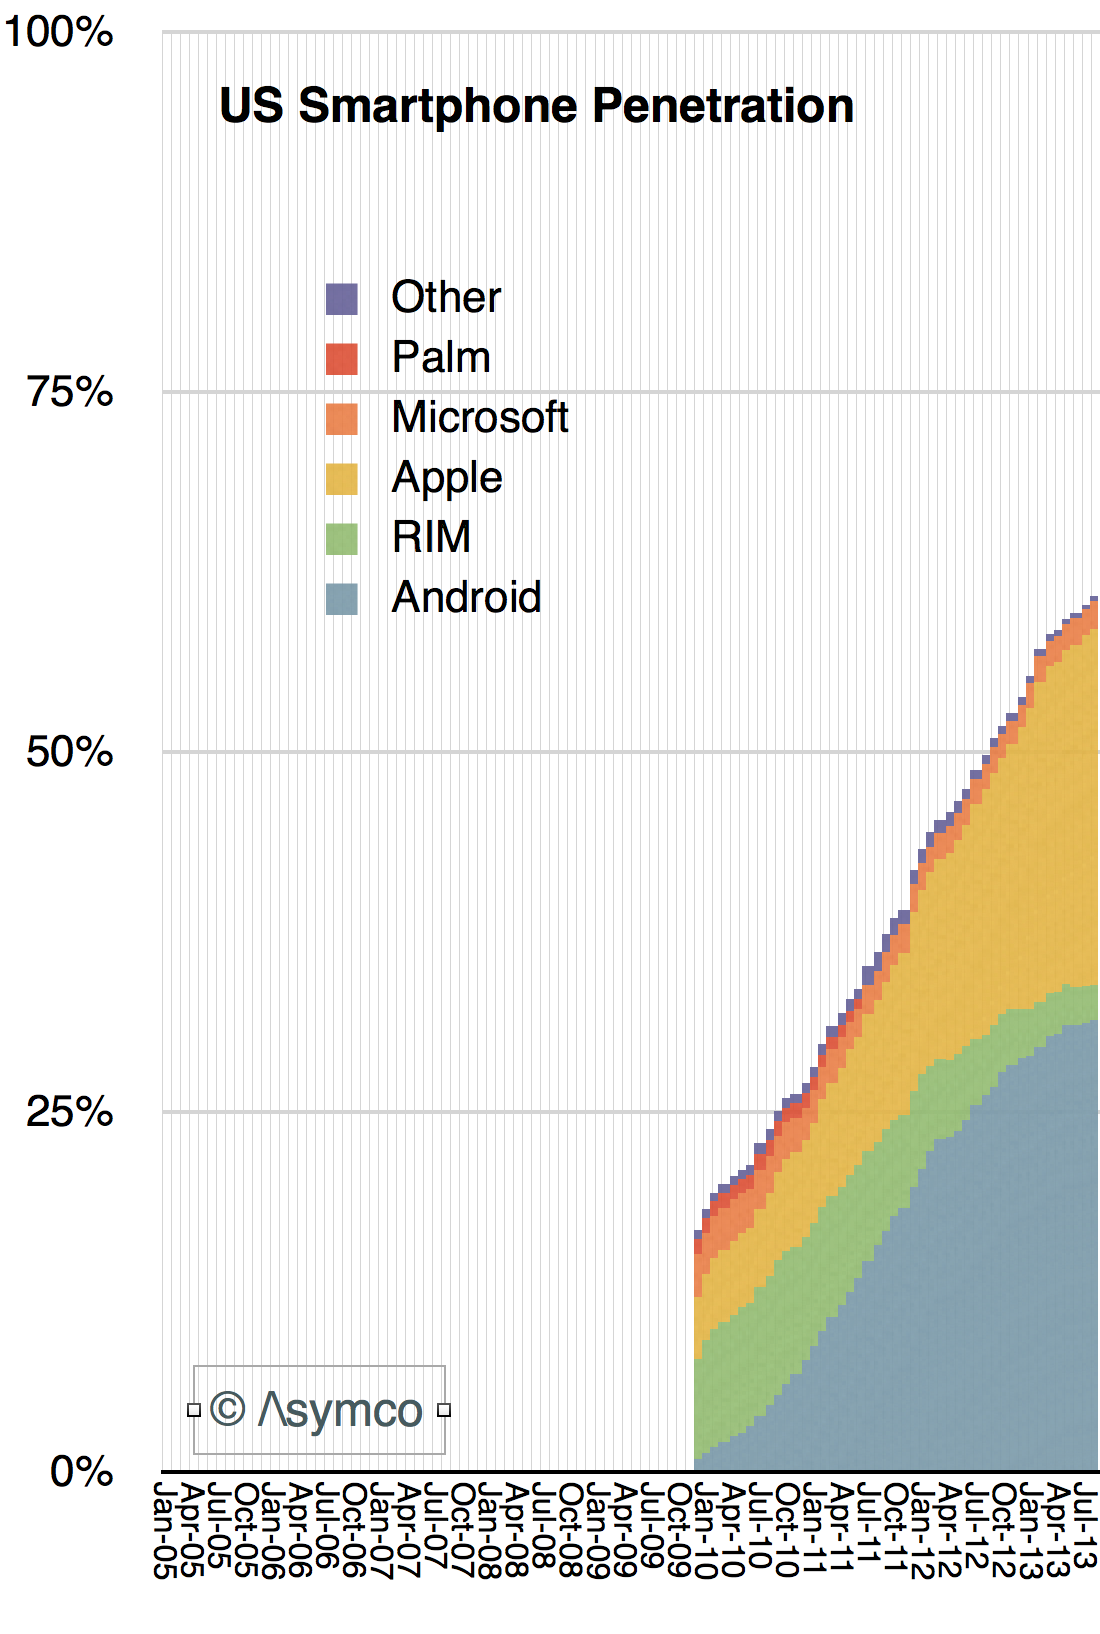
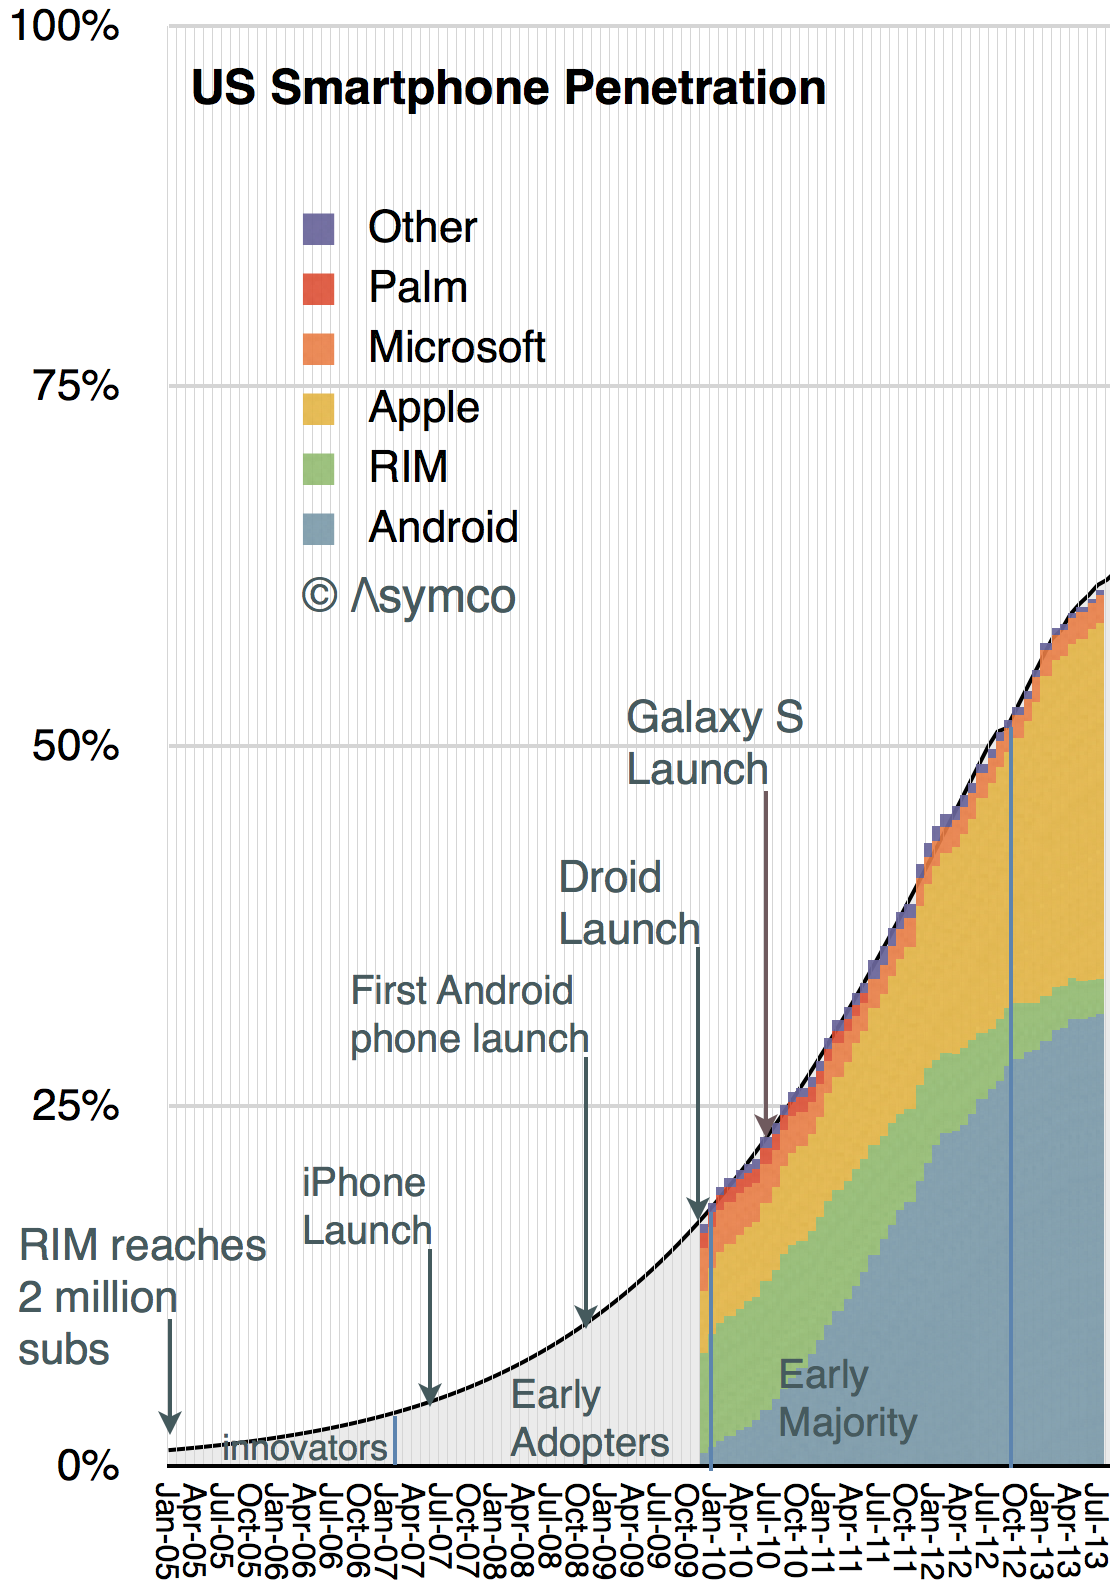
The latest comScore data places penetration at about 61%, up over 10 percentage points from the same time last year. The 50% last year is itself up nearly 14 percentage points from the same time in 2011. This progress in the diffusion of smartphones is shown the following graph:
I set the time frame for the graph to start in 2005 because there was still a market at the time. We can estimate the number of users from data supplied by RIM. They had about 2 million subs in 2005, the majority of whom were in the US.
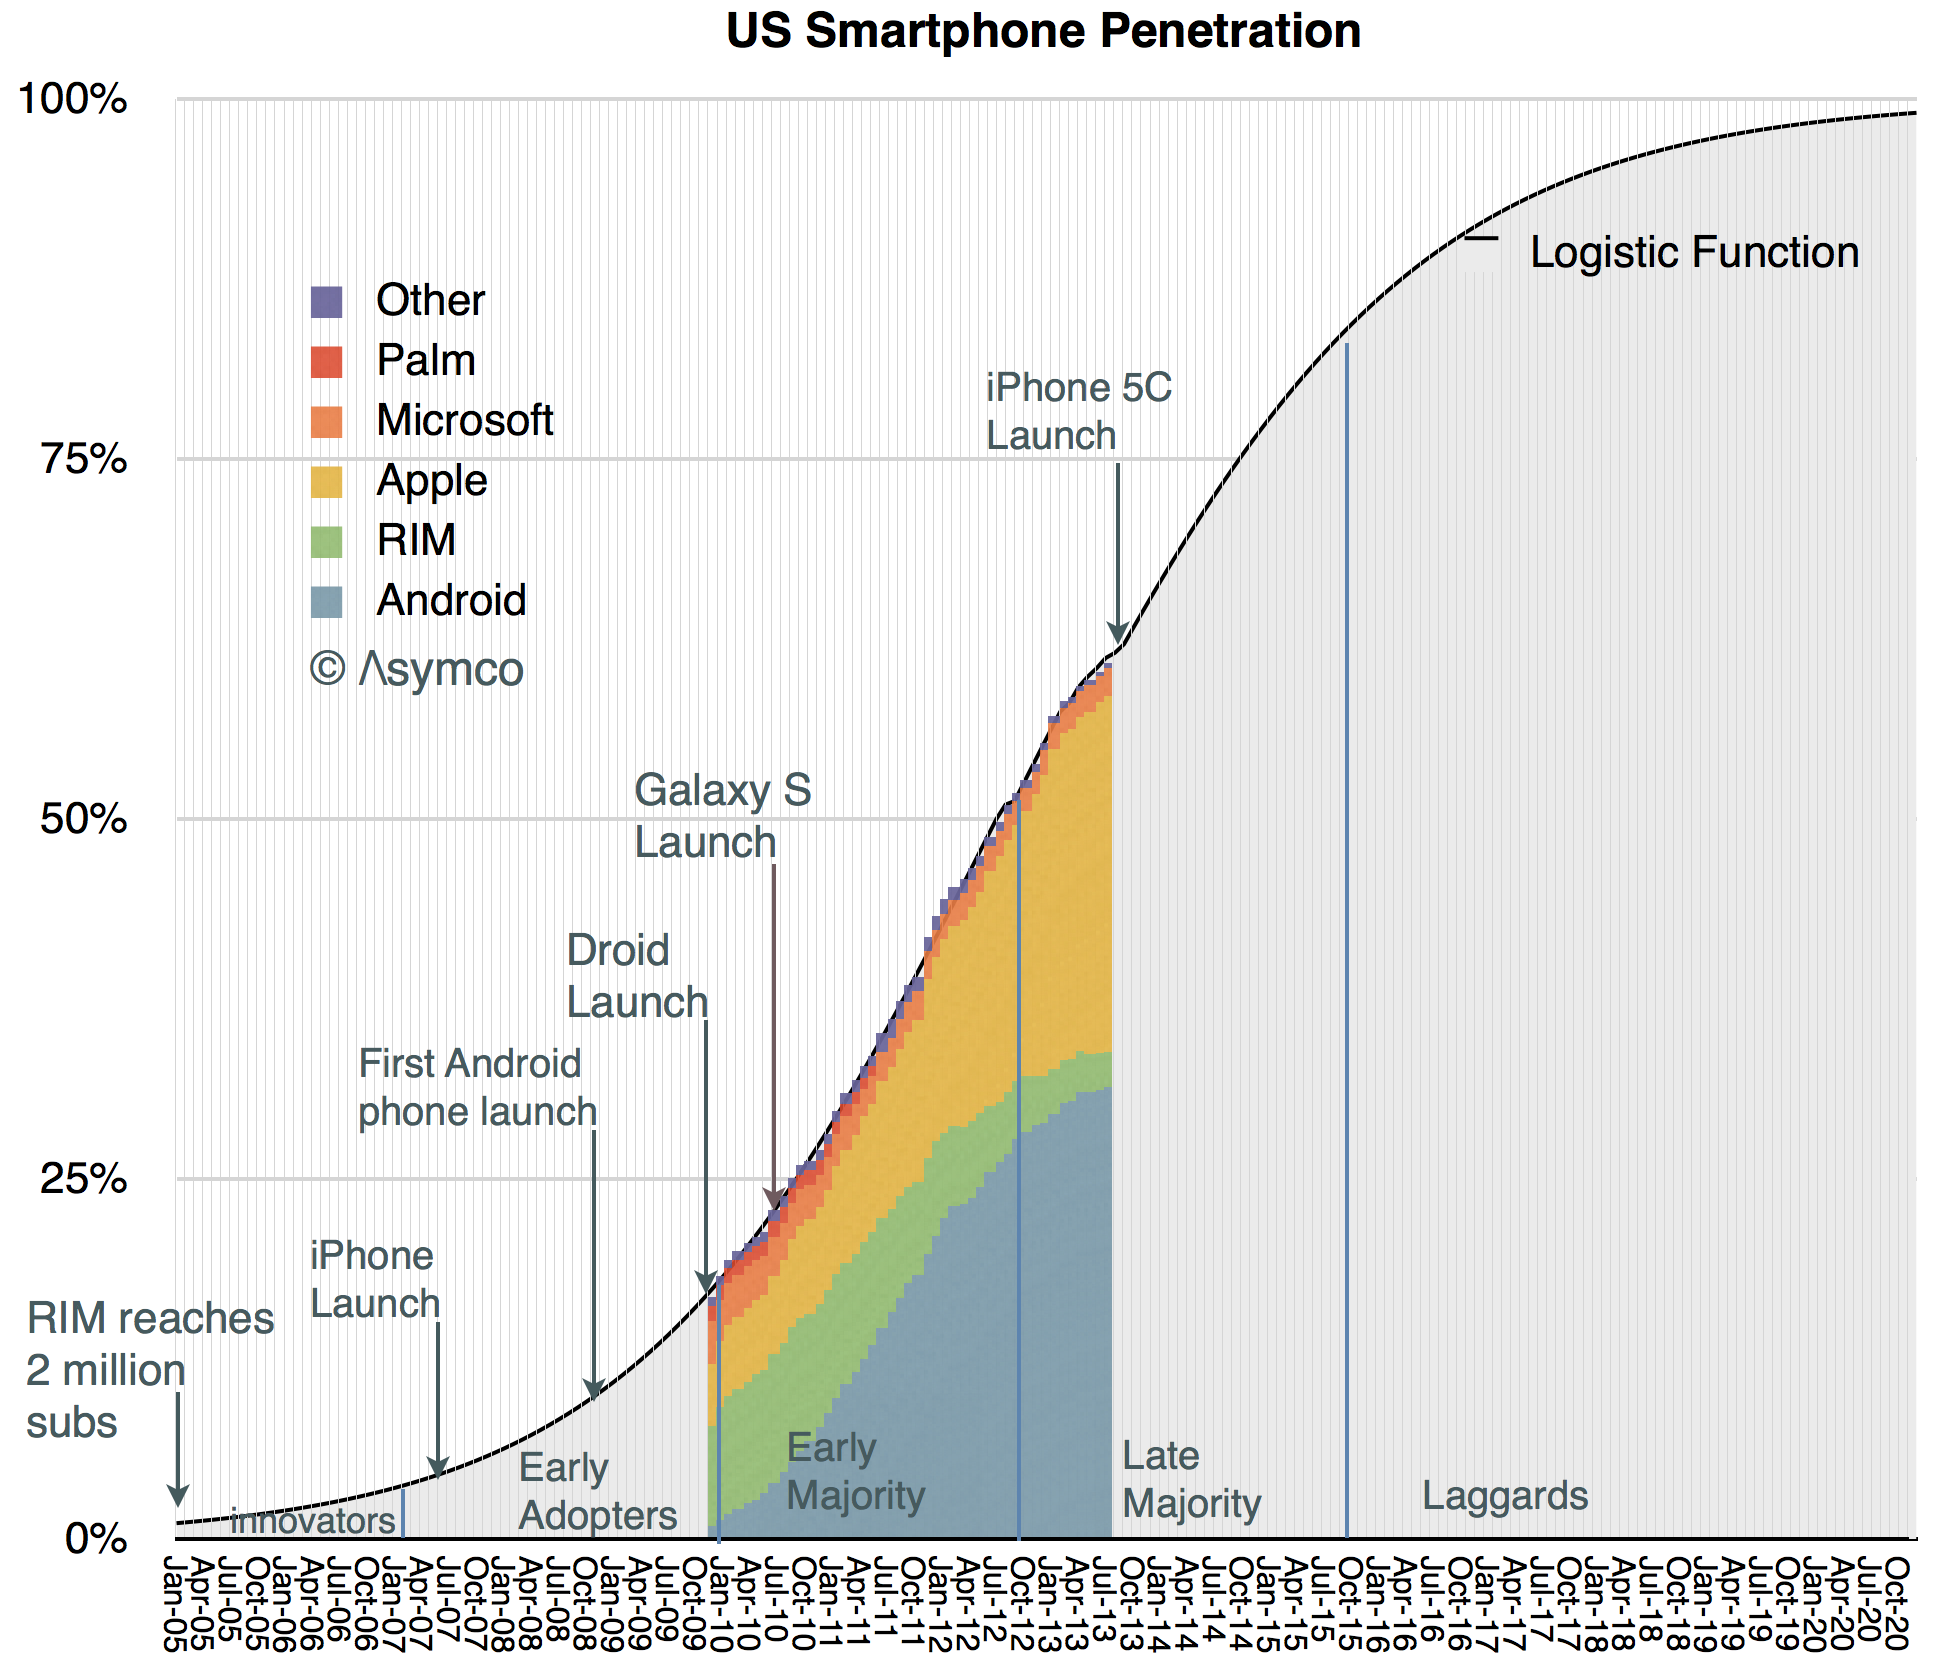
Given these data points we can draw a new penetration graph extrapolating to the complete date range.
I added a few events that mark some of the product launched during this period.
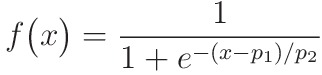
The penetration curve shown happens to be defined as the "Logistic Function" whose equation is well known:
p1 is the number of periods (in months) that it took for the market to reach 50% penetration and p2 is an index of which can be adjusted for this market.
Note that I also identified successive groups of consumers adopting smartphones as defined by Rogers in his Diffusion of Innovations. This is easily done since the formula for penetration gives us the answer (as the integral):
The Innovators (first 2.5% of the market) were recruited by February 2007, one month after the iPhone was announced. They were almost all BlackBerry users
The Early Adopters (the 13.5% which followed the innovators) were all using smartphones by the beginning of 2010. They were served mainly by iPhone 3GS and BlackBerries
The Early Majority were on board by October 2012, just in time for iPhone 4, Droid, Galaxy.
We are now in the Late majority which will run out by November 2015. The iPhone 5S came out about one third of the way through this period.
The next few years are shown in the following extrapolation.
The laggards will adopt smartphones from late 2015 until late 2020.
As this is the diffusion curve for the US, most other large regions are going to be shifted to the right and the global total can probably be estimated.
What remains to be done is to estimate the way the platform colors will fill in over this time frame for the US and to do the same analysis on a global level.
The most interesting juxtaposition in market data happened this week.
Apple announced 9 million units of the iPhone 5s/c sold in their opening weekend while BlackBerry recognized 3.7 million smartphones sold in the three months ended August 31.
I will state these data points with a different emphasis: while Apple explicitly reported, both in a press release and in an SEC filing, Sales of 9 million units, BlackBerry reported recognition of revenues on 3.7 million units. At the same time BlackBerry also reported sales to end users of 5.9 million units.
So, did Apple sell 9 million iPhones in three days? What about units ordered and not delivered? Which of these units will show up in the company's income statement? Conversely, did BlackBerry sell 3.7 million or did it sell 5.9 million smartphones in three months?
The answer is dependent on what constitutes a sale. I suggest re-reading the Sold and Shipped: A Brief Introduction post from last year. Understanding is complicated by many factors, not least of which could be intentional signaling by management. We may never come to a perfectly matched comparison of the two companies' situations but our job as analysts is to see through the signals and obfuscating language and interpret a pattern. A pattern that extends over a time and helps us learn.
My observation is one of contrast. The juxtaposition this time is that Apple emphasized sold and not shipped while BlackBerry sold more units to end users than it recognized revenue. These signals reflect precisely the inverted fortunes of the two companies.
For BlackBerry the higher sold than shipped recognition was due to a product launch failure. Units which were shipped (and recognized as revenue) last quarter did not sell and the company is not only writing off the inventory but has drastically reduced its deliveries of new units in order to drain inventory. The company explains:
During the second quarter the company recognized hardware revenue on approximately 3.7 million BlackBerry smartphones. Most of the units recognized are BlackBerry 7 devices, in part because certain BlackBerry 10 devices that were shipped in the second quarter of fiscal 2014 will not be recognized until those devices are sold through to end customers. During the quarter, approximately 5.9 million BlackBerry smartphones were sold through to end customers, which included shipments made prior to the second quarter and which reduced the Company's inventory in the channel.
The company is essentially saying that due to the unusual circumstances of a product launch failure, they will change how they account for their business. They don't have the confidence that units shipped will actually sell and will not recognize them since they fear they will have to write some off. They are signaling: They are being far more conservative, not reporting shipments alone because those shipments could essentially be value free.
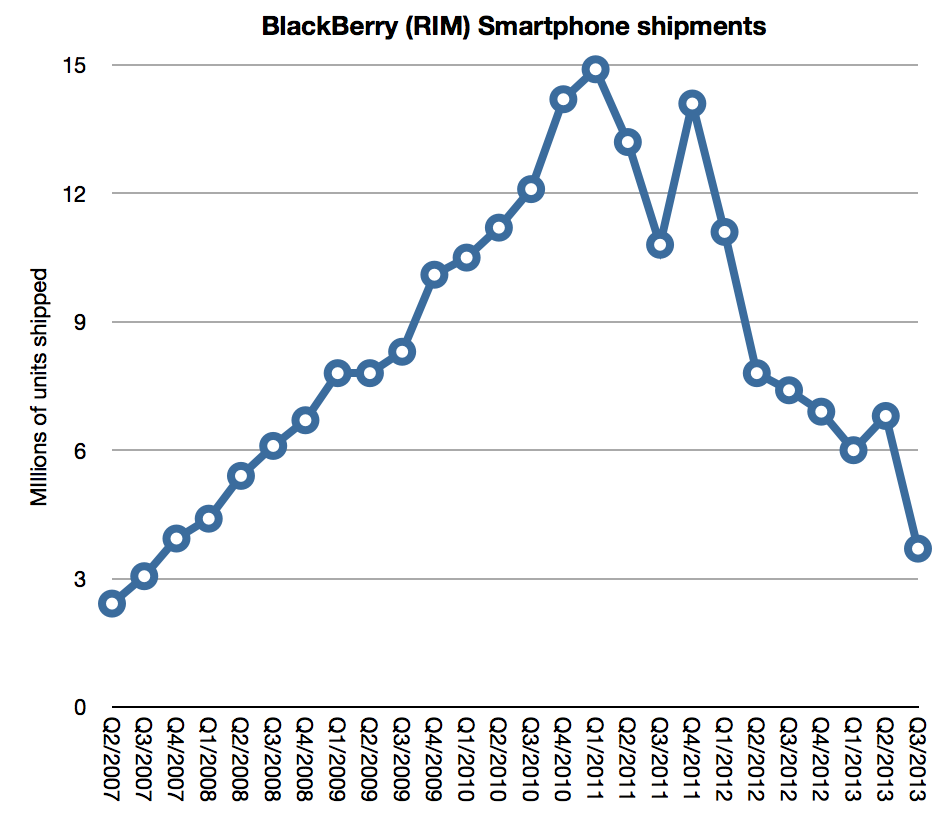
When seen as a pattern, the new figure on recognized revenue units needs to be shown relative to the history of recognized revenue units.
You can see the instability in volume recognition in the graph as a clue. Product launches cause erratic changes in what was previously a seasonally stable business. This is, essentially, the company being thrown onto its back foot. It is staggering from an unexpected blow and resetting expectations.
Now note the contrast with Apple. Apple provides every quarter shipment data on all its products. This is consistent with generally accepted accounting principles and consistent with reporting from other companies. ((Though many, e.g. Samsung, Google, refrain from reporting shipments any shipment data at all.))
Apple also offers "channel inventory" data on select products. This inventory data, when coupled with shipment data, offers insight into how many units are actually purchased by end users. If Apple runs a tight ship then its inventory is relatively low but if it has a reliable customer base that of its channel is also low. Moreover, if it can predict sales well then it avoids overfilling the channel and having to take a hit while draining it.
In that context the way the company reported the 5c/s launch is signaling optimism:
On September 23, 2013, Apple Inc. […] announced that it has sold over nine million new iPhone 5s and iPhone 5c models, just three days after the launch of the new iPhones on September 20.
Apple expects total company revenue for the fourth fiscal quarter to be near the high end of the previously provided range of $34 billion to $37 billion, and expects gross margin to be near the high end of the previously provided range of 36% to 37%.
The SEC filing language above refers to the following press release:
Apple® today announced it has sold a record-breaking nine million new iPhone® 5s and iPhone 5c models, just three days after the launch of the new iPhones on September 20
“This is our best iPhone launch yet―more than nine million new iPhones sold―a new record for first weekend sales,” said Tim Cook, Apple’s CEO. “The demand for the new iPhones has been incredible, and while we’ve sold out of our initial supply of iPhone 5s, stores continue to receive new iPhone shipments regularly. We appreciate everyone’s patience and are working hard to build enough new iPhones for everyone.”
The reporting of sales after a launch weekend has been a staple of Apple's communications about product for a long time. Therefore the evaluation of this performance should be made in comparison with previous launches.
But it's not necessarily a statement of end user purchases. Nor is it a statement purely of shipments. The term "sold" as used in a press release is not an accounting term and it is not something which is meant to be audited.
However, none of that matters. The signal is what should be observed. By deliberately and repeatedly using the word "sold" Apple is expressing confidence that demand for its products is strong. Sure, there is channel inventory in that 9 million unit number but there are also ordered devices which have not been shipped and thus are not counted as sales. There are also depleted store shelves and people angry about not getting their desired phone model. Apple knows this, Tim Cook is making it clear they know this. They have excellent visibility into the distribution of their products. They have excellent inventory management. They are typically conservative in their financial reporting.
So why would anyone interpret Apple's release as a negative signal? If you want an example of a negative signal, look at how BlackBerry reported its launch performance.
When interpretation of a signal is very different from the literal statement, it says more about the interpreter than about the company.
One of the curiosities of the mobile phone market is how vast it is but also how heterogeneous it has always been. I wrote about this in 2010: Smartphone parochialism: How operator policies prevent or promote platform adoption. This observation was influenced by my time at Nokia where I became amazed at how differently users behaved in different countries.
There were many causes. Some cultural, some historical, some economic and some policy-driven. The result was that it presented a challenge to any company with global ambitions and indeed it was rare to see the same company do well in every market. Japanese companies did well in Japan, European companies did well in Europe and US (and Korean) companies did well in the US. Nokia was most successful because it was able to apply an European model more broadly (but not in the US). Samsung succeeded by simply adapting to each and every market with hundreds of products. But it was a particularly "provincial" market.
My assumption was that when smartphones would become the majority of phones in use there would be a normalization of behavior and thus a homogeneity of preferences. This is, after all, what happened in other platform games. PC form factors are globally consistent, PC operating systems are equally preferred around the world, FaceBook, Google and Twitter are also, unless censored, uniformly popular. Apple's iPod eventually also became a global phenomenon with no material difference in preference by market. Likewise for game consoles. ((Although Japanese do seem to prefer Japanese platforms more.))
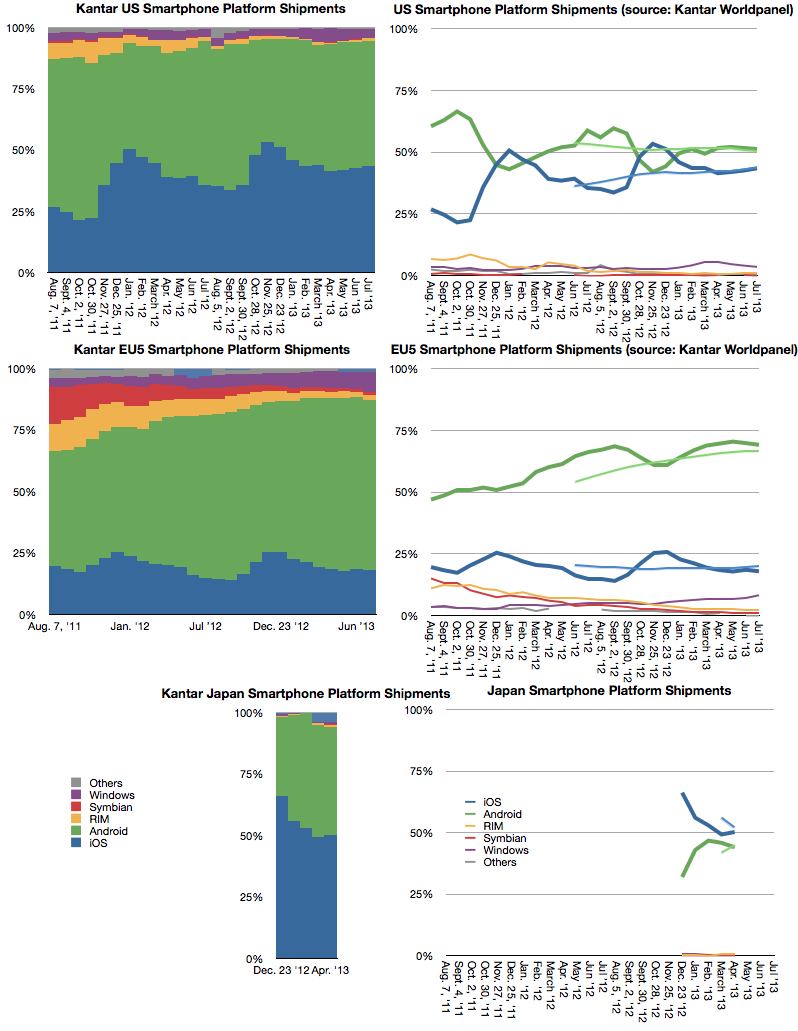
However, a decade after the broad adoption of smartphones, the relative popularity of various platforms is still unevenly distributed. Prior to the iPhone, Symbian was strong everywhere but the US and BlackBerry was very strong in the US but weak elsewhere. Windows Mobile had footholds in some markets but little traction in others. Today the picture has changed but it's still a patchwork of preferences. Consider the following graphs.
They are the most detailed sets of data on platform phone purchases but they not the only data: We also know that Android is vastly more popular in India from web usage statistics. We know that BlackBerry is sensationally popular in Latin America and the Middle East. We know that within Europe there is a gap between North and South in iOS vs. Android and even more pronounced between East and West. We know that whereas iPhone was a huge hit in Korea upon its launch there, Samsung and LG swamped it in the last two years.
But the data shown above is the story of iOS being very popular in Japan and increasing its share in the US while being flat in EU5. Again these three markets are different but each contradicts the global picture.
Note the differences in trend not just absolute performance. This is what is puzzling. There seems to be a divergence between markets: Markets are become more islands onto themselves rather than one whole. This contradicts all the theories of how computing markets should behave (network effects, ecosystems, monopoly power, etc.) It implies that there is still a great deal of friction in the market; friction which I suspect to be due to the peculiar nature of telecom economics.
I wonder if this observation is, as usual, late on my part and that Apple's iPhone product marketing has seen it years ago.
My thanks to Kirk Burgess for providing this transcript:
Horace Dediu interview on CNBC Asia Cash Flow show - 10th September 2013
Chloe Cho (CNBC): Take us through what Apple is exactly trying to do?
Horace Dediu: Well, this is the first time in the six years of this competition in the smartphone market that Apple has broadened its portfolio. We have seen only a single product launch every year--this is very unorthodox in the industry. Normally each competitor [ranges] dozens of devices. Apple's entry has been asymmetric from the start, and now in its sixth year we are expecting to see, finally, a broadening perhaps into two separate products. The question will be whether [there will be] a significantly lower price point for the so-called 5C and whether that will change the average selling price overall for the portfolio. The average selling price has been remarkably steady, and remarkably high, typically around $600 for the duration of this products life. Something, again, unprecedented. My expectation is the new price point will be quite a bit lower than $600, starting with about $450, it might drop a bit further, [which] would cause the overall price range to come down as we have seen with the iPad; [where we] also had a price erosion happen as the smaller version came out.
Q: Horace, do you think they have got the timing right? Should they have done this a little bit earlier when the market wasn't so saturated and filled with cutthroat competition?
A: Indeed, I think. As I said, as a product with six years in the market it's a bit late; I expected this to happen last year. I think a lot of the momentum that has been lost in the past year in terms of sales growth has been because of the lack of low end. To note also will be whether they indeed expand their carrier footprint. We are expecting something new in Japan and possibly China Mobile. There is a second announcement happening with a few hours delay in China. This is again the first time that has ever happened.
Q: Horace, do you think they didn’t move down the value chain fast enough largely because they didn’t have a deal with China Mobile?
A: Well that's always a good question whether they are driven more by carrier channels or are they driven more by consumer market expectations. I think it's a bit of both. We do have this hybrid approach where they continue selling this older product for one or two years after the new product is launched--so the 4 and 4S are still available while the 5 is being ranged. This strategy is hybrid I say because this isn't truly a low end product, it is a stale product that is being put out there. This [strategy] may be driven more by consumer demand, not so much what operators are asking for. With the 5C we might be looking at a solution for operators in particular.
Q: Horace, how much do some these incumbents like Apple and Samsung need to be worried about Microsoft approaching their space?
A: I believe Microsoft will not be competitive in the near term. I don't think [during] the next year we are going to see a very impactful entry from Microsoft. What Microsoft is likely do is lower prices significantly on Nokia's portfolio and their pipeline as it is. That might cause more pressure on the pricing, but the problem has been that consumers have not really been taking up the Windows Phone platform very aggressively. It has been somewhat successful in Europe but not taking off elsewhere. I think Microsoft will be in an integration mode with the Nokia assets into 2014, but I would expect in a year from now we might see some new entry product that would be exciting. I think 2-3 years down the road we might see something from Microsoft that would excite consumers as well.
Q: There has been a lot of focus on which companies have a more integrated house, Apple or Samsung. In light of the fact that they are having to move into lower price points, in your view which is doing the better Job, Apple or Samsung?
A: Well Samsung is a great industrial enterprise and they are doing very well by broadening as much as possible their portfolio, even before the smartphone race started for them, which was in 2010, they were known for being one of the most prolific product creators out there. They actually had over 100 different mobile phones, not smartphones, just regular mobile phones that they would range, and Nokia were extremely concerned by this pressure they were getting from Samsung.
What they have seen since 2010 is the same thing, except with smartphones, and so they’ve been really prolific and covering the spectrum of price and screen and every other possible variant that could be made. I think however that Samsung hasn’t got a software platform under its belt. They could become a software player by taking over some of the control of Android as we have seen Amazon do, and thus really establish themselves as a platform player. They are doing so to some degree with the "Gear" product, and they might be doing something like this by launching their development conference this year.
But they aren't yet a platform player whereas Apple is, but then again we just don’t know what the politics of Android are with respect to forking it by an OEM as large as Samsung.
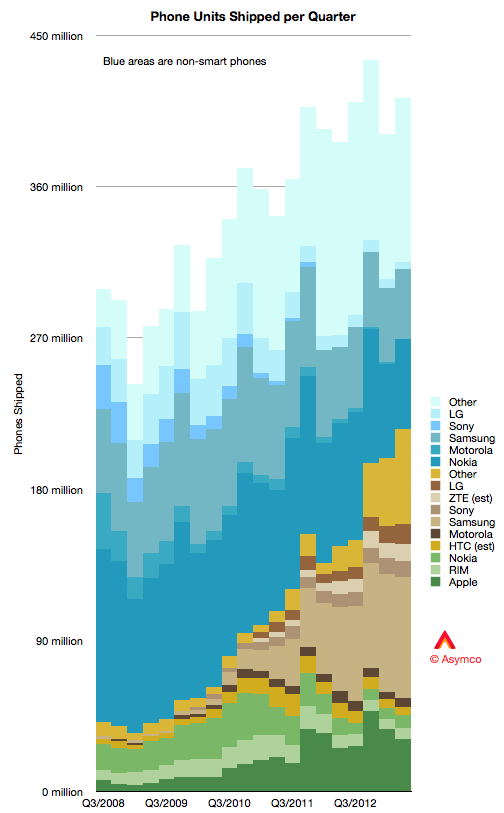
Tracking the mobile phone market hasn't been getting any easier. The lack of published data from many incumbents (including the largest) is compounded by the lack of visibility into entrants. It's not just ZTE and Huawei which are up-and-coming, but companies such as Lenovo, Xiaomi and Yulong make up an increasingly large part of the overall market. (Not to mention BBK, Meizu, OPPO and TCL).
Canalys suggests that China's top five vendors make up 20% of the world's smartphone shipments. This is mostly due to the rapid rise of the category in China and the advantages local vendors have in that market. Absent this large segment, a complete picture of the market is simply not possible. Nevertheless a fuzzy picture of the entire market can be still be painted.
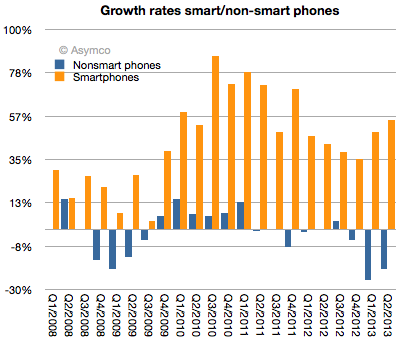
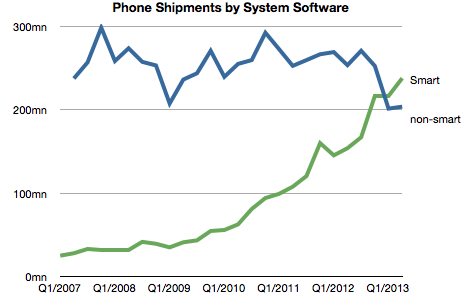
What I see in this graph is that competition with smartphone non-consumption is still fierce. Non-smart phones are still shipping at the rate of about 200 million per quarter. Not as many as the smartphone units, which are nearly 225 million, but their numbers have not so much plummeted as not risen. Smartphones meanwhile have expanded greatly.
The other observation is that these non-smart units are increasingly being made by no-name brands and sell in emerging markets through grey markets. Nokia's non-smart business is contracting and Samsung, the only other branded vendor with any material non-smart volumes is fleeing upmarket.
Consider that India, a market of 700 million users purchased barely 9 million smartphones last quarter. Contrast that with the Chinese market where 1.1 billion users purchased 88 million. The preference in India is for super low cost products of dubious progeny.
In other words, the preference in India is about what it used to be in China two years ago.
Will India follow China out of non-consumption? It's hard to say. There are many factors beyond market forces at work. Although that's true in most phone markets, India is particularly byzantine. Not only is distribution different (retail only and very fragmented and multi-level distributed) but there are few 3G users and networks are notoriously difficult to scale. For a vendor trying to apply a global strategy in India the odds are very poor indeed. And there are few vendors more uniform in their approach than Apple.
The Indian market is not yet "cracked" as Tim Cook would say. One wonders if it ever will be.
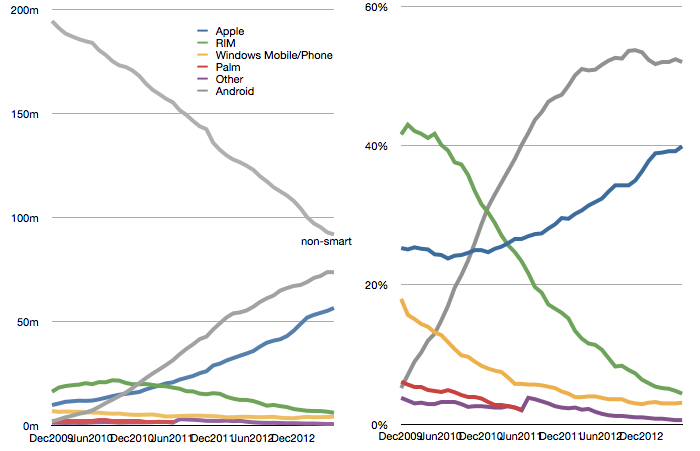
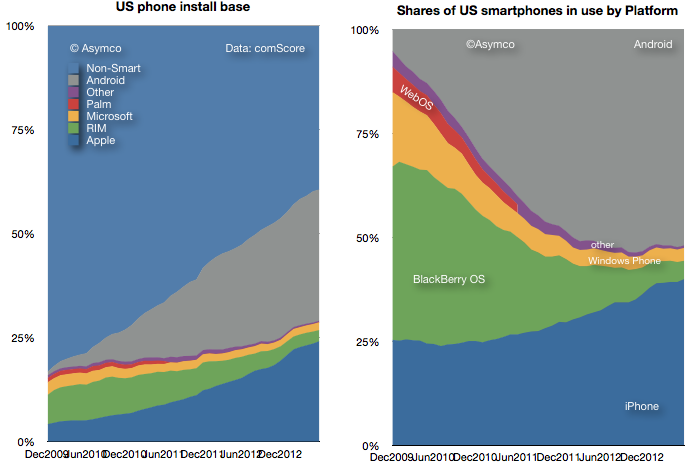
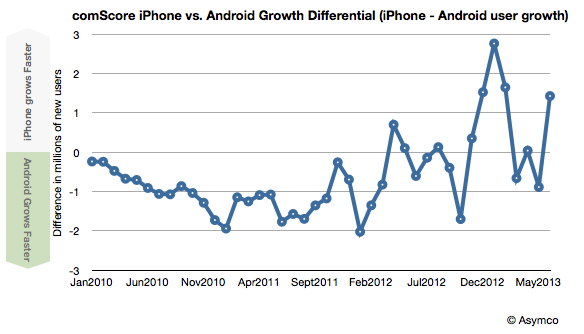
ComScore's latest survey for US smartphone users showed that Android had 52% share of about 142 million users. That amounts to 73.84 million Android devices in use.
ComScore's previous such survey showed that Android had 52.4% of about 141 million users. This amounts to 73.88 million Android devices in use. It also means that Android usage in the US went down for the first time.
The difference is surely within a margin of error so it's not something to declare definitively, but the pattern of Android "peaking" has been evident for some time.
Even though share stopped growing about a year ago, Android continued to gain users as overall smartphone consumption increased. The last few months however have shown a slowing of new smartphone users and therefore we have this first instance of Android appearing to lose usage.
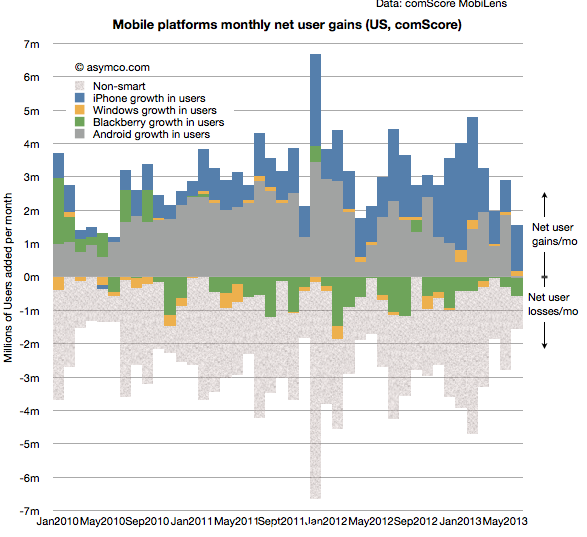
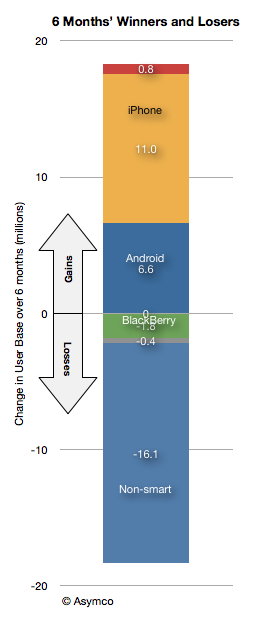
Note that this has not been the case for iPhone as usage over the last six months is up by 11 million users vs. 6.6 million for Android.
Indeed, iPhone gained more users than Android for the last 6 out of 8 months.