Asymco

Asymmetric Intelligence

Horace Dediu

  1. If Cash is King, Apple's is an Emperor [Updated]

    Research · 84 comments

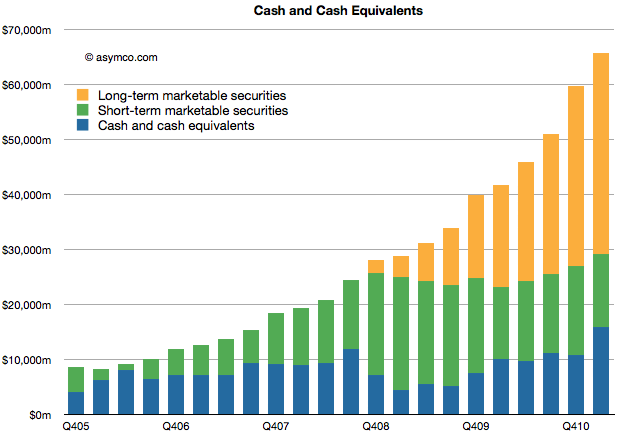
    Apple's cash for short-term and long-term marketable securities totaled $65.8 billion at the end of the March quarter. Cash increased by $6.1 billion.

    The increase in cash is net of approximately $900 million for prepayments and capital expenditures related to the strategic supply agreements that Apple announced last quarter.

    The following chart shows the historic cash, short-term and long-term liquid assets Apple holds.

    As in previous quarters, the securities Apple holds are:

    • Cash
    • Money market funds
    • U.S. Treasury securities
    • U.S. agency securities
    • Non-U.S. government securities
    • Certificates of deposit and time deposits
    • Commercial paper
    • Corporate securitiesMunicipal securities

    Although the asset classes are all liquid, those with longer maturity dates are classified as "long-term" securities (orange area in chart above) and are often not counted as "cash" in many financial databases.

    The enormity of the overall size of this cash can be put into several perspectives:

    • The funds are big enough to place Apple's CFO office in the top 100 largest fund managers in the world and larger than any hedge fund manager.
    • Cash growth in one quarter was higher than the market cap of many companies. For example, if pre-payments were added back, the cash increased by about the market cap of Motorola Mobility.
    • Current cash is worth more than Nokia, RIM and Motorola Mobility's market caps, put together.
    • Apple's cash is worth half of Google's enterprise value.
    • About two years ago, in January 2009 the stock traded at a price of $78 with at least one analyst placing a target of $70 on the stock. Today Apple's cash is worth $67 70/share.
    • If you owned $100,000 of Apple stock, $19,000 of that would be cash and only about $80,000 would be "at risk" capital.
    • If Apple had no revenues, the current cash would sustain operations (SG&A and R&D) for over 7 years or until the middle of 2018.

    When analysts cite limits to the rate of Apple's growth on the basis of the "law of large numbers" I wonder if there is an implied limit to how big this cash pile can grow. By looking at the chart its size seems to be growing faster all the time.


    [Updated] The cash per share figure was wrong. It is $70/share.

  2. The iPad slowdown and impact from the Japanese disaster

    Research · 41 comments

    Tim Cook explains that there was no material impact from the Japanese disaster:

    "Regarding our global supply chain, as a result of outstanding teamwork and unprecedented resilience of our partners, we did not have any supply or cost impact in our fiscal Q2 as a result of the tragedy, and we currently do not anticipate any material supply or cost impact in our fiscal Q3. To provide a bit more color on this, we sourced hundreds, literally hundreds of items from Japan, and they range from components such as LCDs, optical drives, NAND Flash and DRAM to base materials such as resins, coatings and foil that are part of the production process at several layers back in the supply chain. The earthquake and subsequent tsunami and the associated nuclear crisis caused disruption for many of these suppliers, and many unaffected suppliers have been impacted by power interruptions.

    But since the disaster, Apple employees have literally been working around the clock with our supplier partners in Japan, and have been able to implement a number of contingency plans. Our preference from the beginning of this tragedy has been to remain with our long-term partners in Japan. And I have to say, they have displayed an incredible resilience that I personally never seen before in the aftermath of this disaster. So while we do not anticipate -- currently anticipate any material impact to our component supply or cost in our fiscal Q3, we do need to caution everyone that the situation remains unpredictable"

    via Apple Management Discusses Q2 2011 Results - Earnings Call Transcript - Seeking Alpha.

    Still, the message did not get through to everyone:

    However, the supply chain impact on Apple from Japan’s earthquake, tsunami and nuclear power crisis is the culprit behind the only product line that came in below expectations – iPad. Apple sold 4.7 million units of iPad, vs. analysts’ expectation of 6 million.

    The Rise and Rise of Apple: Time For A Split? - Seeking Alpha

    The shortfall in iPad units was explained by Tim Cook as ramp-up challenges:

    "Let me mention a few things for you to consider, Toni. First off, product transitions are never simple. And as you can probably appreciate, we are in a position that we have to call them for many, many weeks in advance in terms of how many of the current product we want to produce and the dates at which we will announce the new product. We drew the channel down on the current product or the original iPad, I should say, by 570,000 units during the quarter. And we added at the end of the quarter 170,000 of the new iPad 2s although most of that was in transit at the end of the quarter. And so the net reduction was 400,000. And so our sell-through was above 5 million for the quarter. And again, this has to be planned quite a ways in the future. I think the key point here is --

    [also the dates, just to remind you, we set out an invitation to the event toward the end of February. We had the event in early March. We placed the unit on sale in the United States on March 11 and our quarter ended about 2 weeks thereafter. And so there was some expectation of a new product, and we would have obviously factored that into our thinking about the product transition as we plan the number of the original unit to build.]

    And so I think the key point here is that I'm extremely pleased with the progress that we were making on the manufacturing ramp. We have gotten off to a materially better start and produced a lot more units than we did on the original ramp of the first iPad. And when we're so confident with our ability to supply that we've already put on 25 additional countries at the end of March, and we'll be placing on 13 more next week and we'll do even more as we stepped through the quarter."

  3. Estimates for Apple's third fiscal quarter (ending June)

    Research · 42 comments

    Apple's CFO guidance statement:

    We expect revenue to be about $23 billion compared to $15.7 billion in the June quarter last year. We expect gross margin to be about 38%, reflecting approximately $55 million related to stock-based compensation expense. We expect OpEx to be about $2.5 billion, including about $255 million related to stock-based compensation expense. We expect OI&E to be about $70 million and we expect the tax rate to be about 25%. We are targeting EPS of about $5.03.

    Apple Management Discusses Q2 2011 Results - Earnings Call Transcript - Seeking Alpha

    Last quarter Apple guided revenue growth at an aggressive 63% with an EPS growth of 47%. They delivered 83% and 93% respectively.

    They are now guiding about 47% revenue growth and 43% EPS growth and my current estimates are 65% and 72% respectively based on the following:

    • iPhone units: 14.7 million (75%)
    • Macs: 4.3 million (25%)
    • iPads: 9.8 million (200%)
    • iPods: 8.0 million (-15%)
    • Music (incl. app) rev. growth: 25%
    • Peripherals rev. growth: 25%
    • Software rev. growth: 25%
    • Total sales: $25.8 billion (65%)
    • GM: 38.5%
    • EPS: $6.02 (72%)

    The biggest uncertainty remains iPad growth. This will be the first quarter where we can dial in a y/y growth rate. I'm being bullish with 200% because I believe the ramp for the iPad 2 may get sorted out. There are also more countries being opened up this quarter (13 this week).

    Apple's stock price to earnings ratio has dropped to 16.72. Ex-cash it's 13.5. On a forward basis (my estimates) it's 8.3. Apple's valuation is now a case for business historians to discuss because I don't think there are modern precedents.


  4. A new era is only a new state of mind

    Research · 51 comments

    The following interview was conducted by Bruno Ferrari a writer about technology for EPOCA, the weekly magazine of Organizações GLOBO, the largest Brazilian media company on March 30 2011. The article (published in Portuguese here) is an edited subset of the following exchange.

    Q: In your analyses, you mention tablets as part of a new era, the “Post PC era”. Why do you think the PCs will be replaced by tablets?

    This is not quite correct. Post PC does not mean the end of the microcomputer. The way to think about it is this: The stone age did not end because we stopped using stones. Same with the iron age and the industrial era. The era of jet travel did not end automobile or even ship travel (though that changed to recreation rather than transportation for passengers.) Each phase of technology does not fully replace its predecessor. It offers a new set of solutions and perhaps a slightly different way of solving old problems. We'll still have PCs but we will use a new type of computer, an even more personal computer. The world still uses the microcomputer's technological ancestors.

    In terms of what new jobs will we hire the tablets to solve, they will vary greatly from what we used PCs for. Just like we used microcomputers for different things than we used time-shared minicomputers and mainframe computers. I expect social interaction, media consumption and entertainment will move from a PC to a tablet. New uses will emerge from the vast experiment that is the app phenomenon.

    Q: What are the new ways to interact with machines? With gestures? How will this change the market?

    Each major disruption of computing came from a new generation of input and/or output methods. Terminals (vs. punch cards) enabled minicomputers. The GUI enabled the rise of the microcomputer and touch is enabling the rise of the tablet. Perhaps this era will last decades perhaps only years, but there will be new input and output methods available. The world's research laboratories are filled with ideas from projection screens (from high brightness LEDs) to motion sensing (as implemented partly by Kinect) and even novel voice control methods. I believe that each major innovation will create a new wave of growth and, if coupled with a new business model, a new set of companies and platforms.

    Q: What are the main differences between PC and Post PC era?

    The main difference will be in the context in which the product will be used. Tablets and smartphones allow "computing" to be done in previously non-consuming contexts: while standing, while in the active company of others, while commuting or while lying back and relaxing. It will also allow more individual use. Like the transistor radio allowed teenagers to listen to rock-and-roll out of hearing range of their parents who had control over the family stereo, a truly personal computer will allow people to "escape" into a world of more intimate consumption and communication.

    Q: Do you think physical keyboards and mouse will be extinct?

    Even physical keyboards have been evolving dramatically. If you look back to the earliest IBM PC keyboards, they were mechanically complex and had a rich feel. Modern laptop keyboards are flimsy things with barely any feedback. Early PC keyboards were patterned after the needs of professional typists (aka secretaries). Current keyboards are designed around space constraints. Same with mice. They went from two to three to one to no buttons. With laptops we ended up with track balls,  little knobs in the middle of the keyboard or with trackpads. Users adjusted over time.

    What changed with tablets is the removal of an on-screen pointer. The pointer was there because the mouse/touchpad was one layer of abstraction for controlling what was on screen. Without a pointer you have direct manipulation. I'm sure many people who never used a mouse would find the direct method more intuitive and in a generation people will wonder how we put up with mice. Conversely, those who are used to a mouse will find it uncomfortable at first. Remember that in the 80s many keyboard experts found mice something that slowed them down.

    So I believe that people will adjust to a world without mouse pointers. I suspect children born today will grow up without ever using a mouse (or a phone with a wire permanently attached to the bottom).

    Q:  Apple has more than 90% of tablet market worldwide. Do you think Apple will be the leader of technology market in the next few years?

    The challenge for Apple is that they cannot serve the whole world. They can only grow so fast. On one hand we have their inability to meet demand and on the other we have alternative products which can. Market leadership may not be sustainable just because the market is so big and no single company can supply it. I do believe that Apple is not sitting on its hands however. Their culture promotes pushing forward.

    Q: At smartphone market, do you believe on a risk of a new duopoly, Apple-Google? Some analysis says that they’ll control the channel sales of software, content and hardware. The conclusion is companies like RIM, Nokia and HP (Palm) will not be able to keep up.

    Analysts differ in their opinions. IDC just released a forecast that shows Microsoft growing beyond iOS in four years. I don't try to make this type of prediction. At least not to a high degree of precision. I do believe that there will be more than two platforms. This is because the market is so large and so diverse and there are so many ways to reach customers (through operators, through retail stores, through online).

    Q: Can we compare the beginning of the tablets with PCs? Apple developed the interface and made ​​the first computers nice and easy to use. But Windows has allowed hardware manufacturers to invade the market, popularizing it. This will be repeated with Android? Or with other systems?

    Innovations are always copied. Even when protected by all sorts of laws or patents. What makes a company successful with innovation long term is to always keep innovating. Often coming up with the next big thing means damaging the old thing. That's hard to do for many companies so they don't do it and somebody else does. This is why great companies end up as formerly-great companies. As I pointed out above in the discussion about input methods, innovations are always bubbling up. As long as Apple takes these ideas and polishes them and brings them to market, they'll do all right.

    Q; How about Microsoft? Do you think the company will lose the podium in Post PC era?

    Microsoft already has lost its position as leader in personal technology. The end actually came in about 2000. Once Windows became "good enough" and did not crash so much, they have had a hard time finding something to improve. If you go back and watch every CES keynote that Microsoft presented since then it's been a litany of dead end ideas.

    Every major innovation since 2000 has been in consumer technology and that's never been an attractive business for Microsoft (with the exception of XBox which was really aimed at Sony and Nintendo without the intention of creating a new market.) Microsoft struggles not because they lack talent (engineering or management) but rather because their business model is relatively rigid. They make money through software licensing. You can see how that's a hard thing to sell to consumers ("I'm buying what?") Consumers tend to pay Microsoft through the purchase of another product. If the market demands hardware/software integration (like in a phone or tablet) or making money by giving software away (like Google), they struggle. This business model rigidity is present in almost all companies, so Microsoft is not uniquely troubled.

    Q: Most of the tablets will use mobile networks to connect to the internet. Do you think the world is ready with an infrastructure that supports this growth in access via mobile networks?

    This is a good question because the growth of mobile broadband is a major enabler (or constraint) on growth. Fortunately, the roll-out of mobile broadband is fairly predictable and it looks good. There are some challenges for operators long term in paying for the infrastructure, but they don't lack for financing today and the business case for more infrastructure seems to be very attractive. It will take time and it won't be even globally, but the incentives are clearly there. A lot of value is being created with mobile computing and much of that value will end up paying for the bandwidth.

    Q: How about the App Market. You posted recently a chart showing how fast developers are buying thickets for both Google and Apple developer events. You said that it is one signal of the Post PC Era. What will be the importance of apps on the next years. Do you think Apps market will be more important than hardware, content and OS market?

    Developers are one more sign that something big is happening. It's not the only sign and may not be the cause of the change, but it's yet another signal. But apps are a phenomenon that will result in something bigger than we can imagine. The way to think about apps is as a new medium, similar to the emergence of radio, television, cinema and even books. The app is a new art form as well as something that provides functional value. We don't know whether the app phenomenon will be tied to one platform or will evolve to something like HTML5, a common standard. But the value of having an app for everything is plainly evident. The economics, creative energy and dynamism of apps cannot be overestimated. I will write more about this subject as I think it's one of the most important consequences of the post-PC era.

    Q: What’s the destiny of the PC? Are they on their last years?

    Again, it's not so much that PCs will disappear any more than mainframes or servers have disappeared. What is more likely is that they will be used for isolated, focused jobs. The "end of an era" is the end of growth, not the end of existence. The PC has arguably reached end of growth in most developed markets. There is still strong growth in emerging economies but even there, much of that growth will probably be replaced with smart devices growth.

    Q: We had the Mainframe Era, the Terminal Era, the MiniPC Era, The PC Era and now we starting the PostPC Era. Do you imagine what Era we'll se after the tablets? When do you think is it going to happen?

    I don't try to be a futurist who can see with clarity technological change. I try to see the patterns of markets through the motivation of companies. With that in mind, my answer will be that large companies will acquire promising new technologies from start-up companies and implement products with global distribution. To see the future you therefore need to look at what small companies are doing today. I note that there is a lot of innovation in new communication methods (social media) and new input methods around gestures and display technology. I am skeptical about the power of voice controls.

    I'm most confident that there will be a re-definition of television, a "socialization" of almost all media. So I'll abstain from answering directly what happens after the Tablet Era. Perhaps something more personal and more of a companion than a tool.

  5. Is Android responsible for Apple's deep market discount?

    Research · 96 comments

    At last night's closing price Apple was trading at a P/E of 16.3. Excluding cash that ratio was at 13. On a conservative forward basis (my estimates) the stock is priced at less than 10 times next twelve months' earnings.

    These figures show a remarkable pessimism that has persisted around Apple for years. It was slightly, but not much, worse during the great recession. It persisted whether the company was growing at 30% of, as now, 95%.

    There are many hypotheses about why Apple's earnings and growth are considered worthless. They come and go with the whims of the age: recession, elitist, luxury branding, health issues, macro "headwinds", earthquakes, phantom competition.

    Lately it's become fashionable to blame Android. That's a curious thing to me, because Android has been discussed at length here and it has been shown to be, for the time being, benign. Apple has not "lost sales" to Android as it has been selling all it can produce. In some ways it's been a boon as a co-belligerent against non-consumption.

    The argument that the discount is in effect because of the future of Android has one first strike against it: the fact that the market does not often discount the distant future. Capital markets are notoriously incompetent in spotting disruptions and often reward those who are failing right up until the bitter end.

    But let's take the "Android hypothesis" (i.e. that Android is causal to Apple's share price) seriously and analyze it. How could the impact be measured?

    Since Apple is trading at a fraction of (a) historic multiple (b) multiple based on growth (c) comparable companies' multiples then we can assume that a "normal" valuation would be twice the current (i.e. a multiple of about 32). That would still be a discount to growth and history but it would begin to match some of the comparables. A doubling of the P/E would be a good start.

    But a multiple of 32 would imply a doubling of market cap, which means that the Android hypothesis is causing the evaporation of about $300 billion in future profits. So it stands to reason that it's responsible for a $300 billion destruction of Apple shareholder value.

    That's an interesting number since Google itself is only worth about $169 billion.

    The measurement then presents a remedy: If Apple bought Google (it already has a third of its value in cash) and it shut down Android, it could create $300 billion in value. If could even throw away all of Google and still walk out with a profit.

    Seems like a great bargain.

  6. Apple Earnings: Evaluating my performance

    Research · 24 comments

    As chronicled here, this quarter I went through three sets of estimates. This is a departure from my standard practice of sticking with one forecast made three months in advance. I felt last quarter was filled with materially important developments which deserved updating.

    So how did I do?

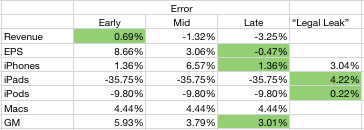
    I wanted to see if the additional information helped or hindered predictability so I put my three predictions side-by-side and measured the errors. I also added the "legal leak" from April 15th (published April 19th) to see whether it was an accurate predictor. The table below shows the error rates with the lowest error highlighted.

    It's clear that my error rate decreased as new information was used. It's also clear that the "legal leak" was very accurate. What follows is a discussion of each line item.

    The iPhone forecast was very accurate both early and late in the quarter. At 1.36% error it was even lower than what was leaked by Apple. I used the information about China and Verizon to boost sell-in and increased the growth rate to 110%. That proved to be the right call. I did not pay any attention to talk of component shortages as I did not consider them to affect Apple whose market share of devices is so low. I would score my "late" estimate as an "A".

    Even though I disclaimed it, my iPad forecast was very inaccurate. In contrast, the leak was very accurate. Although mitigated by the higher sell-through (5.1 million) shipments were constrained by the change in product. Details like the date of shipment, the date of announcement and the ramps made this a particularly difficult transition to predict. At 36% error, I score it as an "F".

    The iPod error was about 10%. That's mediocre. The product dropped in sales by 17% (vs. 10% expected). Again, the mitigating factors, like higher mix of iPod touch and thus increased prices helped to keep the financial performance decent. I score this as a B-.

    The Mac prediction was accurate. The error was less than 5%. I will discuss the Mac business in a separate posting but it suffices to say that the growth was excellent but predictable. I score my prediction as an "A-".

    Revenues were reasonably predictable however pricing seems to have been affected by exchange rate volatility. The iPhone turned out to have a huge average selling price ($660) which made up for the lower revenues from iPad. The error of 3.25% is acceptable. I score it as an "A".

    The Earnings number was very accurate. The error for the late estimate was less than one half of one percent. This bottom line number is a function of all the other numbers so it's the most encompassing. You have to account for factors like interest income, changes in the number of outstanding shares and tax rates. None of these are predictable. However, I was lucky. With an error below 1%, I rate this as an "A+".

    My overall performance as a grade point average would be 3.43 or B.

  7. Review of Apple's unit numbers released in legal filing prior to earnings

    Podcast · 48 comments

    Thanks to Nilay Patel at This is My Next for posting the complaint filed on April 15th against Samsung by Apple which revealed some potentially material data about its performance in the last quarter (which won't be public until the 20th).

    On page 4:

    "As of March 2011, more than 108 million iPhones had been sold worldwide"
    "By March 2011, Apple had sold over 60 million (iPod touch) units."

    On page 5:

    "By March 2011, Apple sold over 19 million iPads".

    These numbers are material because we know units sold prior to CQ1 and can derive the minimum units sold for these three product lines during Q1.

    Namely:

    • Total iPhones sold before Q1: 89,971,000 implying a minimum of 18.1 million sold during the quarter (my estimate is 18.4)
    • Total iPod touch sold before Q1 (estimated): 55.5 million implying a minimum of 4.5 million iPod touch sold during the quarter (my estimate 5 million)
    • Total iPads sold before Q1: 14,789,000 implying a minimum of 4.2 million iPads sold during the quarter (my estimate is 7.3 million).

    The only outlier in terms of delta to my estimates is the iPad units which has always been the wildcard.

    Apple published lower bound figures but it's a matter of speculation as to how far below actuals they are. Nevertheless, I would treat the iPad numbers with extreme caution.

  8. iOS vs. Android: the tale as told by Wall Street

    Research · 90 comments

    Yesterday I wrote about the growth in Android vs. iOS. The two platforms' can be said to be enjoying healthy growth, though in markedly different patterns.

    The consequences of this growth are being felt across the telecom and computing industries. There are almost 300 million platform devices in use today that were not even dreamed of three years ago. Operators are transporting petabytes more data and dozens of phone vendors are scrambling to meet demand. There are tens of billions of app downloads and hundreds of thousands of apps being sold by tens of thousands of new app publishers. There is a lot of hay being made while the sun shines.

    But what about the poor saps that are funding the development? What about the shareholders of the companies behind these platforms. Are they being rewarded or punished?

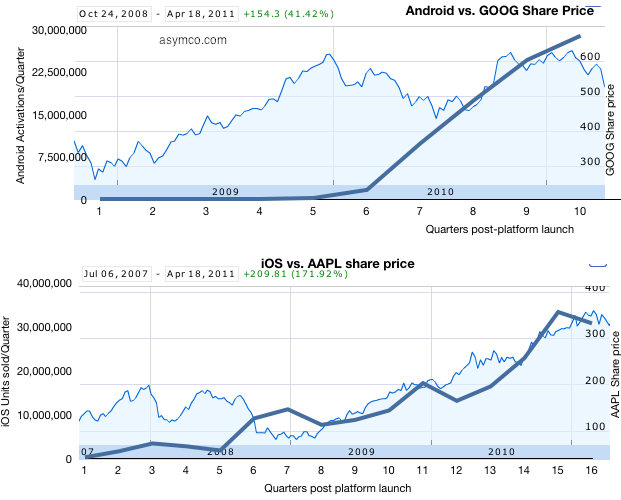
    The following charts tell the story:

    I took the platform growth data published yesterday and overlaid it on the share price data (source: Google finance). Each plot begins at the point in time when the respective platform was available in the market and ends today. There are two vertical axes: the left side axis shows "activations" or units sold and corresponds to the thick blue line; the right side axis shows share price and corresponds to the area chart. Overall date range and growth in share price is shown in the upper left corner.

    What can we interpret from this superimposition?

    1. Both Apple and Google shareholders saw share price appreciation during the two platforms' histories. Apple shareholders benefited more (+172% vs. +41%)
    2. Apple's share price appreciation seems highly correlated to iOS growth but Google's doesn't. Google share price had dramatic growth during 2009 while Android was moribund and was flat to down during 2010 when Android growth was explosive.
    3. We can also interpret the difference as Google's fortunes being far less dependent on mobile platforms than Apple's. Google has been subject to selling pressure this year due to corroding cost structures irrespective to platforms growth. Conversely, Google may not benefit from mobile computing as handsomely as Apple.

    Correlation is not causation and clearly there are many factors at work in share price changes but I think it's fair to say that Apple is obtaining fuel for growth with iOS while Google is in a more precarious situation with mobility--partly benefiting but partly threatened. The market behaves in bizarre ways in the short term but in the long term one can see logic and reason.

  9. The Android step function

    Research · 40 comments

    There is precious little data on Android units sold. There are estimates but no actual summary. Google themselves don't seem to know as they don't report sales, preferring to report "activations."

    Assuming that activations means "unique activations of new devices" then we can draw some equivalency between Google's reports and the reported units of iOS sold. There is some uncertainty with respect to iPod touch units, but that is not very big (estimates are drawn from Apple's reporting of overall iOS units at several points in time.)

    To estimate Android, I took the download rates currently available and placed them in the month when they were published. I then interpolated the data monthly and quarterly.

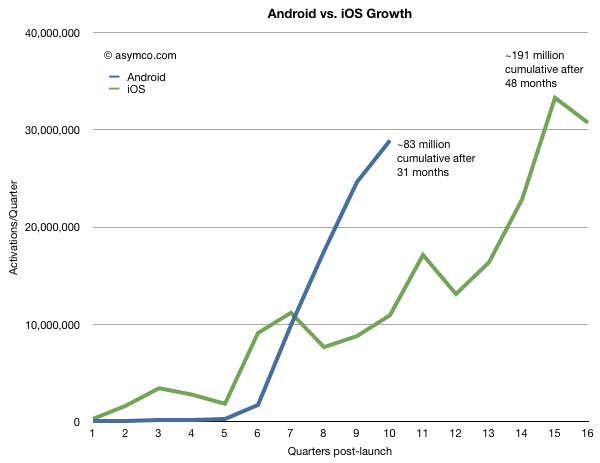
    To make the comparison more valuable, I chose to index the starting point at the launch of each respective platform and plot quarterly units (or activations). This way we can observe how the platforms ramped in growth and where they were at similar points in their lifetimes.

    The following graph results.

    There is likely to be more seasonality in Android data than is shown, but the impressive thing is that Android is running at three times the equivalent adoption rate for iOS at similar points in time. In fact Android is being "sold" as rapidly as iOS today even though iOS has been in the market about 15 months longer.

    Overall, cumulative units sold for iOS are still about twice as many but if Android will continue to grow as rapidly as it does now, it will likely overtake iOS in installed base in less than a year.

    One should be careful about drawing conclusions that this implies effective competition. Both platforms are growing very quickly. iOS is growing at at least 100%/yr and Android's second year was 65x bigger than its first. iOS growth is limited by the ramp rates of a limited portfolio of products. Android growth is limited by how quickly vendors can bring out products. Neither platform is demand constrained and hence they are competing for share of growth not for share of a fixed pie.

    Extrapolation is a dangerous game, but the chart above shows some predictability in Apple's curve whereas Android has a "step function" or discontinuous feel to it and that's a curious thing.

    Not so much for its lack of predictability but because it's so asymmetric to iOS.

    A dictum of classical physics states that in nature everything is continuous. However, in quantum physics everything is discontinuous. Both models of the physical universe have their uses.

    It should be noted that both business models represented above can also co-exist, at least for the foreseeable future.

  10. Revisiting Estimates for Apple’s second quarter earnings (ended March)

    Research · 29 comments

    Estimates for Apple’s second quarter earnings ending March | asymco.

    Since making the original estimates In January,

    • Revenue: $24.5 billion
    • EPS: 5.89
    • iPhone unit sales: 18.4m
    • iPod unit sales: 10m
    • Mac unit sales: 3.6m
    • iPad unit sales: 7.3m
    • Gross margin percentage: 38.8%

    I revised them at the end of March to the following:

    • Revenue: $25 billion
    • EPS: 6.21
    • iPhone unit sales: 17.5m
    • iPod unit sales: 10m
    • Mac unit sales: 3.6m
    • iPad unit sales: 7.3m
    • Gross margin percentage: 39.6%

    In the past I was comfortable keeping untouched estimates made three months in advance. This quarter however there have been several developments during the quarter which were unforeseen and cause me to revisit my estimates.

    1. The Verizon iPhone launch. Observations of the event focused on line lengths and buying activity. However, Apple reports shipments not sell-through. I believe the deal structure was such that Apple obtained a very large order as condition to the relationship. The January and March update analysis did not consider this order size. We have also more data on sales from HTC and RIM and there is no letup in the market's growth. As a result I am revising the growth for the iPhone back up to 110% y/y and 18.4 million units.
    2. Crucially, I'm increasing iPhone ASP to $625 on the basis of this new demand and the likely delay of iPhone 5 launch.
    3. The iPad 2 launch. This product is still too young to see production and sales patterns. However, demand for the second version seems higher than for the first. Distribution is broader too. The unknown is production. I am keeping the unit number at 7.3 million which is the same as the level of CQ4.
    4. China is booming. The Chinese New Year occurred in the quarter and since last year that has meant a sequential increase in device sales for Apple. But it's a double edged-sword. Almost all production activity is shut down during the holiday period. Apple depends on China exclusively for manufacturing so they will certainly be affected. So whereas it's likely that we'll see increased demand from China this year due to even better distribution, macroeconomics and brand value I'm unsure if supply rose to match. Overall, I'm not changing unit growth due to his increased demand but I'm cautioning that there could be downside bias in my estimates.
    5. The tsunami disaster in Japan will affect some demand in Japan and some of the supply chain will be disrupted. However, the effect will be felt more by weaker competitors. It's possible that the event will amplify the shortages that Apple's pre-purchase agreements already created. The consequences are bad news for Apple's competitors but I rate it as neutral for Apple.

    Given these new facts coming to light, I would update my estimates as follows:

    • Revenue: $25.5 billion
    • EPS: 6.43
    • iPhone unit sales: 18.4m
    • iPod unit sales: 10m
    • Mac unit sales: 3.6m
    • iPad unit sales: 7.3m
    • Gross margin percentage: 39.9%

    Resulting EPS growth would thus be 93%.

    For the record, I value my January estimates since they are based on long-term pattern recognition rather than transient events and thus are more useful in forming a market theory.

    However, these transient events cannot be ignored and analysis needs to be informed by both theory and events. I will be watching to see which set of predictions (early, mid or late) will be more accurate.

  11. First quarter PC forecast: Windows down 2%, Mac+iPad up 250%

    Research · 100 comments

    Charles Arthur of The Guardian writes that PC sales "may have passed their peak".  That's a powerful, concise statement. It's backed up by a quote from Gartner's Mikako Kitagawa:

    "This was the third consecutive quarter of mobile PC shipment declines in the US"

    IDC even lays part of the blame to something called "media tablets"[1]:

    "While it's tempting to blame [PC] decline completely on the growth of media tablets we believe other factors [...] played equally significant roles."

    But there are several problems with both IDC and Gartner's analysis of the market. It's hard to make out causality from their data. There is separation by vendor but not by operating system and there is exclusion of devices hired to do the same jobs as PCs.

    For this reason, I need to do my own analysis. I retrieved Gartner's public statements on the overall market and layered actual Mac and iPad units sold. I also added my estimates for the Q1 2011 quarter just ended to complete the picture.

    We can now get an understanding of how the industry behaves with and without various platforms. The chart at the left gives the various growth rates of the market with platforms isolated from each other. I apologize for the shape of the chart but the scale does not permit a concise visual.

    Including the iPad, the total PC growth is shown by the blue line. It shows that the market peaked during the recovery but is now slowing considerably.

    The green line shows the PC industry excluding both the Mac and the iPad. Although it might include Linux or computers sold without an OS, the label "Windows PC" is a fairly close approximation. It shows that the market excluding Apple entered contraction this quarter and is out of sync with overall economic recovery and growth.

    The red line shows the behavior of the Mac franchise. It's well ahead of the overall market with 2x to 3x the growth. This has been a pattern for over 18 quarters.  I had some thoughts on this in a November 2010 hypothesis.

    But the most telling line is the orange line which includes both the Mac and the iPad. In an industry where growth is usually measured in single digits, the iPad business brings growth in three digits.

    This near tripling of unit sales is symptomatic of fundamental change that cannot be ignored. Although some analysts contend that the iPad is not causal to the decline in other PC sales, teasing out platforms data seems to show a divergent view.

    The bottom line is that Windows-only computer units are down 2.0% while OSX-based computer units are up 272% (this excludes both the iPhone and iPod touch).

    Correlation is not causation but tests or surveys where substitution can be proven do exist. For example, a recent survey shows that 77% of users reported that their PC usage decreased after getting a tablet. It also showed that 28% considered their iPad as their primary computer.

    So coupling the sales data with the usage data does point an accusatory finger for the decline on the iPad.

    In addition, some vendors are being hit harder than others which also hints at where substitution is happening. For example, IDC reports that Acer US unit shipments fell 42% in the first quarter and 16% globally (Gartner's numbers are less dramatic but in the same direction). Since Acer is known for its netbook computers it's another telling sign of possible substitution (Acer's own management has indicated as much.)

    So the weight of evidence is beginning to be conclusive: the iPad is the new PC. It should be clear by now that the iPad moves computing into new contexts so it does not yet substitute the PC market but extends it and increases consumption. Substitution is happening in low-end grazing type of usage, a place where the PC was ill-fitting anyway. Incumbent vendors might actually be relieved that the lower margin netbook is finally being supplanted and they can concentrate on the higher end.

    --

    Notes:

    1. Analysts like to call the iPad a "media tablet" but the same AdMob survey shows media consumption to be one of its least popular uses.