Asymco

Asymmetric Intelligence

Horace Dediu

  1. Reminder: @asymco on Twitter

    Research · 2 comments

    There are many thoughts which are not substantial enough to be posted as blog entries. There are also questions that need to be asked or answered which are not yet 'baked' enough to be cast into a permanently linked posting.

    For these reasons and for the simple fact that it's fun, I am using Twitter more frequently. Since I know not everyone has or wants an account, my twitter feed is now shown in the second (right-most) sidebar. It's limited to the last eight tweets.

    For those who would like to keep the discussion going in this new medium, my Twitter app (from the Mac apps store) is always running.

  2. Apple's Growth Scorecard: 63% average earnings growth over 16 quarters

    Research · 30 comments

    In the last quarter Apple's top line grew by 70% and the bottom line by 75%.

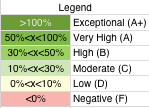
    For a historical perspective, the following table shows year-on-year growth for products[1] and sales/earnings color coded with an arbitrary scoring range.

    The major changes from the last quarter were the acceleration in software sales and the return to growth in iPod sales. iPod benefited from the continuing shift to iOS as the mix is now 50% touch in the portfolio.

    Software growth reached a level not seen since 2008. It's not clear to me yet  which products drove this increase.

    Overall the growth is both wide and deep. I'm most impressed with the iPod as it was a surprise to hear such a high mix of touch.

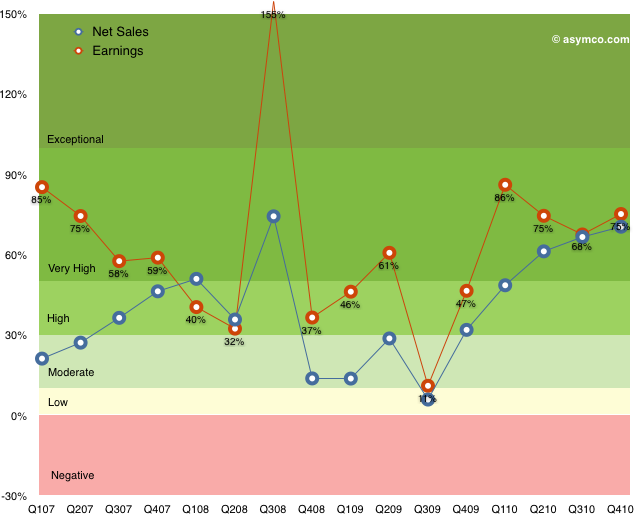
    The following chart shows the top and bottom lines plotted over time with color bands corresponding to the score system in the table above.

    Note how earnings growth has been in the high or very high or exceptional range for all but one quarter over in the last four years[2].

    Apple transcends the mythical "rule of large numbers"[3]. It's not only a mega-cap, but the second largest company in the world by market cap. Not only has this enormously valuable asset just grown in intrinsic value creation by 75% but it has maintained a growth of 70% for the last five quarters.

    If that weren't enough, the average earnings growth has been 63% for the last sixteen quarters.

    ------------

    Notes:

    1. The iPad is not included since we don't have more than one year of sales and this is year-on-year not sequential growth.
    2. The low growth for Q3 '09 was due to the corresponding spike the year before when the iPhone 3G was launched. That launch quarter in 2008 was a seminal turning point in the history of the phone industry when it became clear that the iPhone was not a passing fad. Steve Jobs famously participated in the conference call calling attention to the data which was obfuscated by subscription accounting. Alas, the news was lost in a sea of credit crunch panic.
    3. I have an aversion to this rule as "large" is never defined except in relative terms. For example a $1 trillion market cap may be large because it's unprecedented, but it may be a trifle if the company is priced at book value.
  3. A new era in financial analysis is dawning

    Research · 43 comments

    The story of amateur out-performance has been getting more attention lately and that's a good thing. Success emboldens more amateurs to try their hand at financial analysis. Transparency of methods and data demystifies a practice that is not as complex, and a skill that is not as hard to obtain, as it's often assumed.

    While, quarter after quarter, the gap between the two cohorts is calibrated, what we haven't heard much of is a defense from the professionals.

    That's a bit strange given the negative impact some of the attention must be having on their reputations. This is why I was glad to see that Adam Satariano's well-written piece finally got some reactions from the professionals.

    Professional analysts tend to be more conservative. That’s partly because they’re closely monitored and regulated, said Shaw Wu, an Apple analyst at Kaufman Brothers LP in San Francisco. He and his colleagues must pass a series of tests administered by the Financial Industry Regulatory Authority before becoming certified.

    “I have to be careful of everything that I do because it’s scrutinized,” said Wu, who has recommended buying Apple shares since joining Kaufman in 2008.

    Alexander Peterc, an analyst for Exane-BNP, said professionals are “very wary” of putting out aggressive estimates because of institutional memory of past technology booms and potential backlash from clients if they’re wrong.

    “They got it right on the way up, but we’ll see what happens after that,” Peterc said. “Often bloggers and amateur investors are very good in bull markets, but get lost in bear markets. If some of these guys call the moment at which Apple’s fortunes begin to turn I will be impressed.”

    via Apple's `Underdog' Analysts Outperform Wall Street From Helsinki, Caracas - Bloomberg.

    However, neither answer satisfies.

    Wu cites regulation and scrutiny but that does not prevent one from being intellectually honest. What matters is not avoidance of conservatism or exuberance. What matters is rigor; being impartial to everything but the data. One must keep one's convictions in proportion to one's valid evidence not to regulatory oversight (which is there to prevent abuse, not balance).

    Peterc cites pressure from clients (hence the obligations of employment). That implies that professionals are under pressure to say something other than what they believe, which is a sinister form of self-censorship. Not only is that less valuable as an opinion, but it's likely to be less accurate as well.

    But more fundamentally, the issue for the pros is that the institution of analysis risks becoming de-professionalized. In the same way many jobs that took specialized skills became commoditized by the use of new tools or access to information, the era of DIY financial analysis is dawning.

    The difference between professionalism and amateurism isn't whether one is well paid or not or whether one is anointed with credentials. It's whether one is consistently out-performing randomness (note emphasis on the consistency).

    Amateurs can get lucky and pros can get unlucky. But in the end it's about hitting that home run over and over again.

    So the question remains why, in bull markets or bear markets, the professionals are consistently wrong on Apple. The evidence has always been anecdotal and data was fragmented, but now the data is being diligently compiled and it will serve as testament to a shift that I think will be permanent.

    Stay tuned.

  4. Unforeseeable growth: Analyst failure on iPad as indicator of disruptive change

    Research · 156 comments

    Professional analysts' first year iPad unit forecasts (sourced from TMO Finance Board)

    • Brian Marshall, Broadpoint AmTech   7.0
    • David Bailey, Goldman Sachs           6.2
    • Kathryn Huberty, Morgan Stanley     6.0
    • Shaw Wu, Kauffman Bros.              5.0
    • Mike Abramsky, RBC Capital Markets   5.0
    • Gene Munster, Piper Jaffray           3.5
    • Ben Reitzes, Barclays Capital           2.9
    • Keith Bachman, BMO Capital         2.5
    • Jeff Fidacaro, Susquehanna           2.1
    • Chris Whitmore, Deutsche Bank       2.0
    • Scott Craig, Merrill Lynch               1.2
    • Peter Misek, Canaccord Adams       1.2
    • Doug Reid, Thomas Weisel             1.1
    • Yair Reiner, Oppenheimer             1.1

    Here are the predictions from Tech Bloggers:

    • Clayton Morris: 9
    • John Gruber: 8
    • Horace Dediu: 6
    • Natali Del Conte: 5
    • Ross Rubin: 5
    • Mike Rose: 4.5-5
    • Jason Snell: 3
    • Andy Ihnatko: 3

    Apple sold 14.8 million iPads in 2010.

    I sometimes use the phrase "unforeseeable growth" to describe the kind of growth that not even the most knowledgeable observers of a market can predict. It's usually an indicator that fundamentally transformational change is taking place.

    It's not a sufficient condition, but it's clear that "nobody saw it coming" is a common refrain when disruptions are seen in the rear-view mirror.

    If analysts, to a man, fail, you can be sure that competitors are no wiser. This collective shrug amounts to the greatest competitive advantage any entrant could ever hope to obtain.

  5. Having added $20 billion last year, Apple's cash growth suggests total could top $100 billion next year

    Research · 42 comments

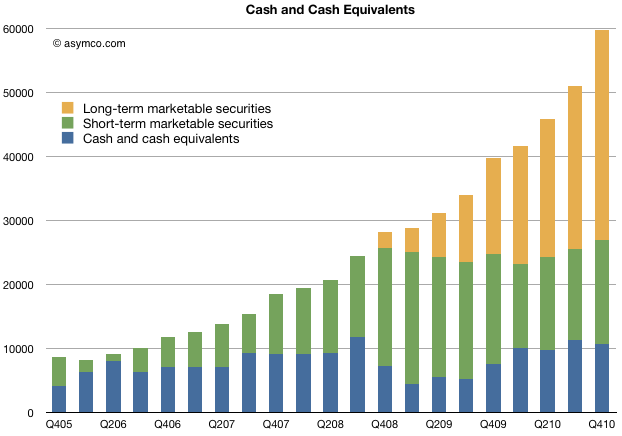
    The following chart shows the value of Apple's cash and cash equivalents for end of 2010:

    This represents $64/share (current price per share is about $340, making the enterprise value about $276).

    The company was trading at $64 per share in July 2006.

    Here is a list of iconic companies whose market cap is less than Apple's cash.

    • Visa Inc. $59.63b
    • American Express Company $55.8b
    • The Boeing Company $53.16b
    • Morgan Stanley $43.5b
    • The Dow Chemical Company $41.8b
    • NIKE, Inc. 40.22b
    • Eli Lilly & Co. $40.12b
    • Texas Instruments Inc. $40.92b
    • Nokia $39.92b
    • News Corporation 37.72b

    I would also make note of the trajectory of the cash. Growth is accelerating. The last quarter Apple added $8.7 billion in cash. A year earlier it added 5.8 billion and the year before that $3.6 billion.

    The amount of cash added is more than the amount of cash the company had five years ago.

    In 2010 the company added $20 billion to its cash reserves. In 2009 the company added about half that amount.

    If the trend continues, Apple could see $100 billion in cash by this time next year. That's about what HP is worth now.

  6. iOS users download about 5 apps every month

    Research · 9 comments

    Thanks to a reader for asking this question: "Wouldn’t it be more telling to look at the monthly rate of downloads / device at any given time?"

    Yes it would.

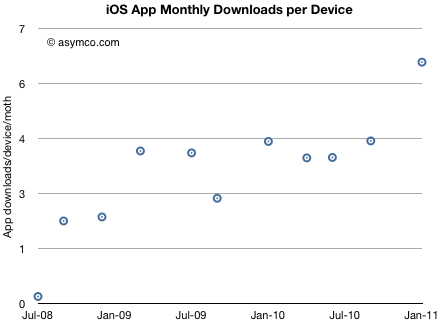
    Here's what can be derived based on download rates and installed base of devices.

    Please note that I am assuming that the number of devices put out of use is negligible. In defense of this, I would argue that the vast majority of iOS devices sold are still serviceable and are re-sold. However, the estimate should be rounded down.

    The data shows that there's been a slight trend upward in download rate/user but it's been fairly steady.

    The implications are interesting: if you know the number of iOS devices in use, you can determine the app economy turnover with reasonable accuracy. If you also know app ASP, you know sales, and even margin.

    Conversely, if you know the app download rate you can derive the device installed base.

    So in September I looked forward to an iOS user base of 500 million. It could be reached by 2013. Assuming each user downloads 5 apps per month that would mean 2.5 billion downloads per month.

    That's two years away.

  7. The Cook Doctrine

    Research · 51 comments

    We believe that we're on the face of the Earth to make great products, and that's not changing.

    We're constantly focusing on innovating.

    We believe in the simple, not the complex.

    We believe that we need to own and control the primary technologies behind the products we make, and participate only in markets where we can make a significant contribution.

    We believe in saying no to thousands of projects so that we can really focus on the few that are truly important and meaningful to us.

    We believe in deep collaboration and cross-pollination of our groups, which allow us to innovate in a way that others cannot.

    And frankly, we don't settle for anything less than excellence in every group in the company, and we have the self-honesty to admit when we're wrong and the courage to change.

    And I think, regardless of who is in what job, those values are so embedded in this company that Apple will do extremely well.

    - Tim Cook, Acting Apple CEO, January 2009 FQ1 2009 Earnings Call

    See also: Apple vs. Exxon-Mobil

  8. How long before apps overtake physical video game content sales?

    Research · 28 comments

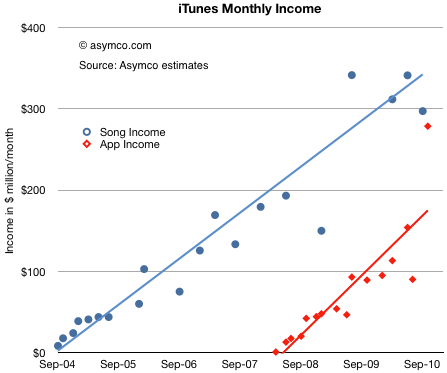
    After reviewing the payments to suppliers, we can look at the store's revenue generation rate. With the same assumptions, we have the following chart:

    We will have to wait for another report to see whether the recent burst of volume from apps is sustained[1], but the trend shows income from apps narrowing the gap to music. In the last few months apps may have been generating $300 million/month[2].

    The blue line above can be interpreted as an arrow aimed at the music industry. We know how that turned out. The red line above can also be interpreted as an arrow aimed at the gaming industry. What are the chances it will play out the same way?

    According to NPD, U.S. retail sales of new physical video game content, which includes portable, console and PC game software, generated revenues of $10.1 billion in 2010. That's $840 million per month. A big number compared to the app business. The trouble is that the figure is going down (-5% from the year before).

    If you look at the red line above and its slope, it would indicate that, given time, the App store will overtake the entire physical media gaming industry. The time when that happens will depend a lot on the growth or decline of the physical game media business, but another four years seems a safe bet.

    Would this cause the same effect to the industry as digital music had when it replaced physical media? I would say yes. The main reason is that physical media has associated with it a different sales cycle and margin. These factors determine the processes and cost structures of incumbents. Such changes are very difficult to absorb and adapt to.

    ----

    Notes:

    1. App sales are highly seasonal as there is a burst of downloads post-holidays.
    2. Apple reports iTunes income in financial reports. In the third quarter it reported $1.2 billion in revenues. This is roughly consistent with the data above given that the analysis excludes iBooks, Movie and TV Show sales and rentals.
  9. iTunes has paid over $2 billion to app developers and $12 billion to record labels

    Research · 13 comments

    The last analysis of the iTunes content store showed amazing acceleration in download rates. Since we know something about the pricing of apps in aggregate, we can make some guesses about the income from apps for both Apple and suppliers.

    The key assumptions are:

    1. Average selling price per app $0.29 (as reported in June 2010 here).
    2. Price per song $.99 increasing to $1.05 over time
    3. Music gross margin 10%
    4. App gross margin 30%

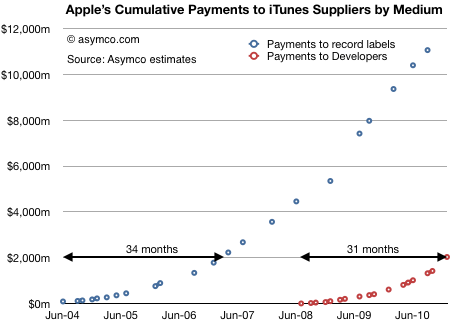
    The first chart shows the accumulated payments made to suppliers of content to the iTunes store over time.

    Although the music suppliers received in aggregate much more than developers, the iTunes store has been open much longer. When comparing sales acceleration, the App store is ramping faster having paid out $2 billion in 31 months vs. 34 months for the first $2 billion paid out for music.

    My guess is that a follow-the-money analysis would show that apps as a medium will absorb talent and capital away from existing mediums and the industries they support.

  10. More than 60 apps have been downloaded for every iOS device sold

    Research · 33 comments

    The iTunes App Store is about to reach 10 billion downloads. That makes this a good time to revisit app growth metrics and compare them with the other digital media store that we have data for: the iTunes Music Store.

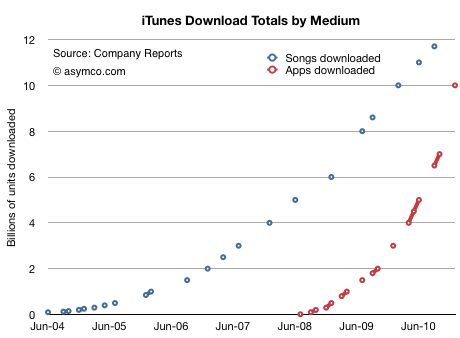
    First, the download totals as time series[1]:

    Assuming that 10 billion will be reached this month, we see how the steepness of the app curve implies that apps will overtake songs within a few months. I suspect by March.

    In September I made the prediction that total apps would overtake total songs sold by the end of 2010. That has not yet happened, but it's close.

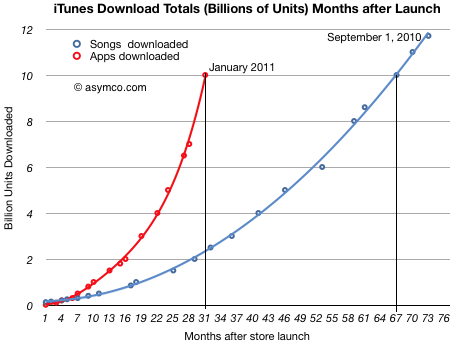
    If we measure downloads as a function of the number of months since store launch, we can see that Apps reached 10 billion downloads in less than half the time it took songs (31 vs 67 months.)

    I used polynomial curve fitting to draw the lines.

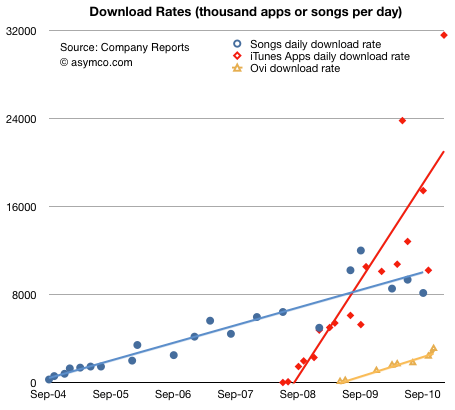
    The other way to look at the data is by measuring the daily download rate. The data is more scattered, but the trend is still clear:

    (The solid lines are linear trendlines. I added the known data from Nokia's Ovi for comparison.)

    The amazing story of this chart is not that apps are running at above 30 million download per day, but that the figure is growing. Growth like this is hard to get one's mind around. Not only are downloads increasing, but the rate of increase is increasing.

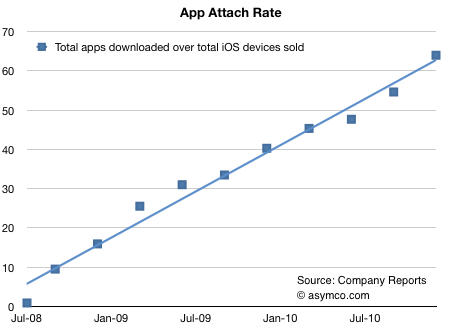
    There is one final piece to put in place on this puzzle. Some might argue that the reason these download rates are increasing is because the installed base of devices is increasing at the same rate. In other words, app consumption could be steady on a per user basis.

    To answer this we need to divide the cumulative apps downloaded by the cumulative devices sold. Using a reliable estimate for iPod touch units sold, we can get a pretty clear picture:

    The number of apps downloaded for iPhone/iPad/iPod touch is running at more than 60[2].

    In the fall of 2008, there were about 10 apps downloaded for every iPhone/iPod touch. Two years later the rate was more than five times higher. There are significant implications for the network effects related to the iOS platform. End user investment in apps is even higher than end user investment in music which created a very tight lock for iPod users.

    I draw three conclusions:

    1. Apps overtaking digital music is a watershed event. Apps are a new medium: they will impact all other media.
    2. As the number of apps attached to any single device continues to increase, apps create increasingly higher switching costs for users.
    3. Apps consumption is increasing at a rate to overtake the PC software market.

    ---

    Notes:

    1. The total apps does not include updates.
    2. The attach rate is actually higher since the figures above assume all devices are still in use.
  11. What Google can learn from John Sculley: How technology companies fail by placing their strategy burden on technology decisions

    Research · 107 comments

    And so we come to the question of Chrome and H.264. First off, it should be clear that video codecs are infrastructural technology[1]. They are commodity algorithms which are generally invisible to users. They are ubiquitous and are "shared" in the sense that they are available for licensing often without much in terms of cost.

    So they don't really offer strategic advantage to the adopter. Some may end up adding slightly more to a cost structure than others, but not in a way that determines strategy.

    Flash on the other hand is not infrastructural. It is not shared, it is not invisible to users, it is a brand, it has a significant business model and market value. It is sustaining to Adobe.

    So the argument I've heard against Google's decision is that they are using an infrastructural technology decision (a new video codec) to placate or sustain Adobe Flash, at the expense of Apple, a potential or perceived rival.

    If this was the plan, it would be a strategic mistake.

    The reason is that Flash will live or die on the basis of whether the business model is sustainable. That is decided by whether an integrated, proprietary technology is over-shooting and unable to adapt to a mobile computing future that demands modularity from components. If Flash is doomed, then its fate is inevitable.

    In other words, you cannot use an infrastructural technology to defend a sustaining, possibly over-serving technology.

    Which is why I don't think this was the motivation.

    I rather think that Google's decision is a misguided emphasis on technical details in lieu of engaging in a deep strategic re-evaluation.

    A RISCY BET

    To illustrate the way technology companies fail by placing their strategy burden on technology decisions, here is how John Sculley made a decision to go with PowerPC and how he lived to regret it.

    [Our best technologists] came back and they said it doesn’t make any difference which  RISC architecture you pick, just pick the one that you think you can get the best business deal with. But don’t use CISC. CISC is complex instructions set. RISC is reduced instruction set.

    So Intel lobbied heavily to get us to stay with them… (but) we went with IBM and Motorola with the PowerPC. And that was a terrible decision in hindsight.

    ...

    we totally missed the boat. Intel would spend 11 billion dollars and evolve the Intel processor to do graphics… and it was a terrible technical decision. I wasn’t technically qualified, unfortunately, so I went along with the recommendation.

    I would argue it wasn't a failure of technical knowledge--the technicians were right about the architectural advantages. It was a failure of strategy and understanding of innovation dynamics[2]. Sculley asked the wrong question. The question to be asked is not "CISC vs. RISC". Rather, it should have been: Is the architecture the relevant decision point or is it the choice of partner? The technologists put the architecture choice above the more strategically important question of whether Intel had the fuel to continue getting better even if saddled with sub-optimal architecture.

    That decision sounds very similar to what is being done today at Google. Increasingly, technology decisions are leading strategy. The question should not be "H.264 vs. WebM" or "HTML5 vs. Flash". Google should be asking itself if mobile computing will allow browsing to remain the predominant interface for internet consumption. If, as I suspect, it won't then no amount of browser tweaking will help. The browser is already infrastructural. It can't be the object of strategic focus.

    To get an idea of how this would work consider Flipboard. Flipboard turns the entire browsing paradigm inside-out. Instead of consuming social media inside a browser, the app presents it in a more natural magazine-like format.

    What will happen when that media becomes predominantly video? Flipboard will be far more influential to content producers and their decision on which codecs to support will lead adoption.

    By focusing on threats and byzantine standards machinations, rather than on broad, experiential learning, Google missed (yet another) next big thing.

    ---

    Notes:

    1. In  IT does not matter. Nicholas Carr introduced the concept of infrastructural technologies. Becoming Infrastructural is what happens after a technology overshoots the market and stabilizes into a commoditized ubiquity. It ends up being "shared" in the sense of being openly and sometimes freely licensed.
    2. To be fair to Sculley, the research on innovation theory that would have helped him had not yet been published.