Apple sales are growing faster than its operating expenses. Although all eyes are on gross margin, the company continues to run a tight ship in fixed costs (costs which do not vary with the output).
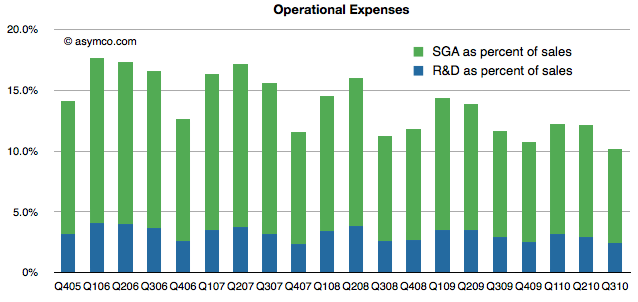
In terms of R&D, spending has dropped to 2.4% of sales, a level seen only once since 2005. Sales, General and Administrative costs also dropped to 7.7% of sales, a new record low.
The total operating expenses as a percent of sales stands at 10.2%. The following chart shows the trend.
Keep in mind that, in many ways, the leadership of Apple in both marketing and product development means are doing the job for all the knockoffs, copycats and ripoff artists in the industry. Including that fat chunk of the industry means that those few engineers and designers and marketers accomplish a feat of efficiency that boggles the mind. Thanks, I say.
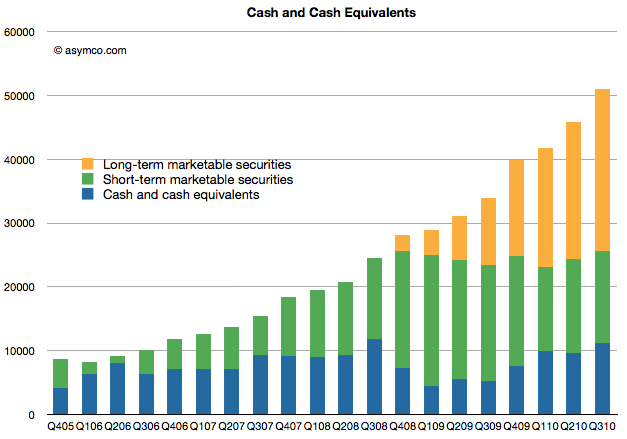
During the last quarter the company added $5.2 billion to its cash, long- and short-term marketable securities accounts for a total of $51 billion. This amounts to about $53 per share vs. $49.43 per share in July (making the share price about $250 ex-cash).
I would caution again that when reading commentary about Apple's cash that many observers exclude long-term securities from the "cash" total.
To see the difference in the total, this chart breaks out the three different accounts over time.
Note that without long-term securities, the cash wold appear to have stayed roughly constant since Q4 2008.
Also note that in the third quarter of 2006 the company had just crossed $10 billion. The cash equivalents are now over five times bigger. The amount also doubled since Q3 2008. It is the largest cash hoard of any technology company.
The question of what this cash will be used for remains open with management repeating that opportunities might arise to do something big.
Following earnings growth of 68%, after hours trading of AAPL at $300/share shows a P/E of 19.8. The company added over $5 billion in cash for a total of $51 billion or $52.9/share.
Excluding cash from the price of $300 leads to an enterprise value of $249 and a trailing twelve months earnings of $15.15. The ex-cash P/E is therefore 16.44.
P/E/trailing Growth is 0.29.
My guess is that this is keeping AAPL cheaper than the S&P 500 on both P/E and P/E/G.
One of the most hotly debated subjects in the mobile phone business is the importance of market share. It's also a topic of lore in the PC industry. Briefly the two arguments are:
Market share matters more because it drives network effects which ultimately drive competition out of the market, creating the opportunity for monopoly rents.
Profit share matters more because profit is the only fuel that can drive innovation. Any macro downturn or shift in strategy can cause a company to cease investing in unprofitable projects.
The old disruptor's adage: "Be hungry for profits and patient for growth" is challenged by the equally disruptive: "Grow share with lower prices in exchange for new revenue sources."
There are many rich anecdotes to support each strategy, but how about some data? Fortunately we have some: the market and profit shares for vendors covering 80% of the world's largest technology market over a three year period. The vendors are a good proxy for the market, the time frame is long enough to cover seasonality and anomalies and the market is very big (over 1.2 billion devices) and very broad (world-wide).
The only question is how to measure success. One measure is how various strategies benefit the asset owners, i.e. the share holders. Benefit to society, employees and consumers are very difficult to measure. But share holder benefit is easily obtained by measuring change in share prices.
So, here are two charts:
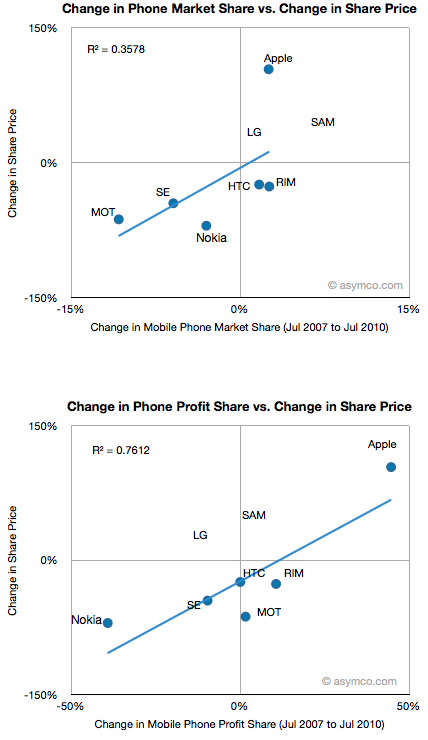
The percent change in market share vs. percent change in share price for the top mobile phone vendors.
The percent change in profit share vs. percent change in share price for the same vendors. (see note 1 for time frame discussion).
I showed the R-squared value of the correlations. (See note 2 regarding LG and Samsung). At r-squared of 0.36 share price is not well correlated to market share while at 0.76 it is rather well correlated to profit share. To a financial analyst this would seem obvious. After all, share price reflects the present value of future cash flows which are clearly coupled to profit and hence to profit share growth. However, as many technology observers would point out, market share determined the success of Microsoft and Google, and to some degree Nokia.
High market share can cause competitors to be starved of components or ecosystem developers. At the same time, high profit share can cause competitors to be starved of capital.
What does this analysis add to the argument? Note that this data covers a hardware business. Is hardware relevant? It does not scale as rapidly and has a short shelf life. It's also notoriously difficult to distribute. However, outside of the service revenues for cellular voice and data, device hardware is the only pool of money that has any material dimension in the industry. It's also the pool of money with the highest margin in the industry. For the time being and the foreseeable future, hardware is the only business model worth anything in mobile computing.
The data shows that in this particular but substantial market profit share is closely correlated to shareholder value creation. It also shows that profit loss is closely correlated with shareholder destruction. The dominant data comes from Apple and Nokia, which appear to be polar opposites in performance on both measures.
In other articles I've shown how profits have shifted from incumbents to entrants in the smartphone disruption. This shift has resulted in direct benefit and loss to the owners of the two asset classes. To suggest that market share alone is a determinant of "success" in the device market must exclude the effect on shareholders and, ultimately, the management and employees of the companies concerned. The virtuous/vicious cycles will be fed by the profit variable more than any other.
I don't think the market share argument holds water in this market and this data supports my belief. It may be that as value shifts over time away from hardware the benefit will shift as well, but business models alternatives to hardware have not emerged after ten years of experimentation. If anything, the idea of selling hardware as a way of capturing service revenue was pioneered by RIM and perfected by Apple. Nothing I've seen so far is challenging this model. Whoever attempts to siphon the device pool of money (which has remained fairly constant over the smartphone disruption) needs to solve system-wide problems like the dependence on the network and the life-cycle of portable electronics.
----
Notes:
The dates when performance was sampled are are July 1 2007 to July 1 2010. The latest quarter (3Q10) has not been included in this data as it has not been fully reported. The data will be updated with the latest quarter as soon as it's possible.
For many competitors the share price is dependent on more than performance in the mobile phone market. In particular, LG, Samsung, Motorola and Apple have diversified product lines which affect their share prices. Two of those companies (LG and Samsung) are conglomerates and their share performance is dominated by businesses other than mobile so I did not include their data in the correlation measure (though their place on the chart is shown). Motorola and Apple's stock prices were, to a very large extent, driven by their mobile phone performance over the same period so their data is included in the correlation analysis. The other vendors have been primarily focused on mobile phones.
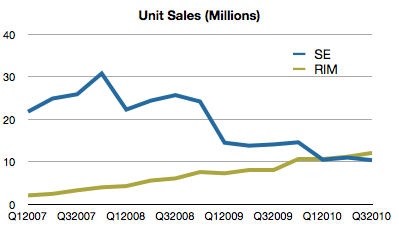
Sony Ericsson is to stop making smartphones featuring Nokia’s Symbian operating system.
The move means that the troubled Finnish mobile maker is likely to be the only significant user of Symbian.
Analysts said Sony Ericsson’s decision confirmed the “failure” of Symbian as an open source platform, given that it was supposed to be used by several large mobile makers.
“Our third consecutive quarter of profitable results illustrates that Sony Ericsson’s overall performance is stabilizing. Our strategy to focus on the smartphone segment is succeeding and smartphones now comprise more than 50% of our total sales,” Chief Executive Bert Nordberg said in a statement.
The Verizon distribution for iPad is an unexpected development. Coupled with distribution through AT&T stores, and rapidly expanding retail points of purchase, it seems that the iPad is destined to be the most widely distributed product Apple sells. The iPod never reached operator points of purchase and the Mac is orders of magnitude more constrained.
What seems to be happening is that Apple is pulling out all the stops and going for unrestricted iPad distribution. This may also foreshadow unrestricted iPhone distribution next year. It may also portend a CDMA iPad (or at least an LTE version) next year.
If it happens all estimates for next year need to be revised sharply. I had been expecting 100% growth for the iPad and 50% growth for the iPhone. These might need to be increased to 150% and 100%.
The consequence could be that total iOS devices sold could top 150 million for calendar 2011.
In the last article on the share of PCs highlighting the unwillingness of market analysts to categorize the disruptive iPad as a PC I imply that Gartner does not "get it".
This is partly willful and partly instinctive. The willful ignorance is due to a belief that their customers (IT managers mostly) do not want to hear about the iPad as a viable technology. Certainly there is a lot of anecdotal evidence that the iPad is unworthy of consideration as a business tool.
However, there is also increasing evidence that IT does in fact get it. I have met several senior IT managers who are whispering that the iPad will change everything. For us to decide which way the wind blows, we need to think harder about the process by which technology gets adopted in large IT organizations. Understanding how the technology is hired by IT managers to improve their career prospects unveils who wins and who loses in IT.
The main hypothesis I put forward is that IT is an example of "rule of man" not "rule of law". The idea that law or "standards" (as doctrine is known by the jargon,) defines the products in use is a conventional myth. Standards change and they change quite dramatically based on who's in charge. The "standard" during the 70's was the Mainframe, the "standard" in the 80's was the DOS PC and the "standard" in the 90's was client-server and in the 2000's it was the web. Each new standard was a violation of the previous standard. So how did this change happen?
Each evolution of technology standards affects the career of the IT manager. The adoption of technology is the primary driver for advancement in the profession. In most cases the technology being adopted is sustaining. In rare cases it's disruptive and can cause unforeseen re-distribution of IT power (and wealth).
As IT is a cost center, naturally, organizational behavior (or, in the vernacular "politics") dominates the decision process. Senior managers look at each technology and ask: how can this help me achieve my career goals? Let's try this exercise with various innovations that have come along in the last few years.
The Web in 1998. As IP based networking was catching on, the new technology offered a new way to tie existing assets together. It was also a completely new communication channel with customers. This was a great opportunity to increase IT consumption. It would lead to more work, more budget, more visibility and even a strong link between the profit centers of the company and the IT world. The web was an opportunity. It led to a firestorm of adoption.
OSX in 2004. As Windows PCs were widespread and, given the support infrastructure behind them, worked well enough, an IT manager would look at a Mac and see no opportunity to increase their value add. They could not offer new software tools with it, and the old tools would probably not work without debugging. They could not move a Mac to new use cases and could not increase headcount to support it. The Mac was not a career opportunity.
The iPad in 2010. As an IT manager looks at the iPad (and smartphones in general), he sees a similar opportunity to the Web ten years ago. The company users love their devices. Top executive love their devices. They see consumerization happening and there is no denying the explosive growth. There are challenges with integration but these devices are not a direct threat. The iPad is an opportunity to migrate to a completely new form factor and increase IT consumption.
What this means politically is that the manager who figures out a way to roll out mobility in the organization will get the same uplift in his career as his predecessors did when they brought in disruptive waves. Those periods have become the stuff of lore and legend. Every IT manager with ambition is looking to create and ride a new wave. If the person is a mid-level manager, they will scramble to be the champion of the new technology and become a rising star. If the person is a high-level manager, they will see it as a way to protect their empire by co-option. Jostling for a vehicle to bring in the technology will begin. These vehicles are typically vendor relationships. Small vendors (example) have a better chance as the traditional vendors (for example SAP) and integrators are not quick enough with product development and don't have the products to sell.
This IT manager's job-to-be-done analysis is crucial to understanding the adoption of IT technology. Sustaining IT products do not sell themselves even if they are superior. Conversely, new products cannot be kept out of an organization even if they violate standards. What matters is whether they help the decision maker to achieve personal goals.
My own intuition, having worked in such an organization (albeit briefly), and after a few conversations, is that the iPad and the mobile devices it represents is going to influence a generation of IT spending.
"Media tablet hype around devices such as the iPad has also affected consumer notebook growth by delaying some PC purchases, especially in the U.S. consumer market. Media tablets don't replace primary PCs, but they affect PC purchases in many ways," Ms. Kitagawa said. "At this stage, hype around media tablets has led consumers and the channels to take a 'wait and see' approach to buying a new device."
Fascinating. I'd love to hear more about the non-iPad "media tablets" that delayed PC purchases last quarter. Maybe I don't get out enough.
But more to the point, let's combine the data from Gartner and the forecast for iPad.
I show below the impact of the iPad on PC vendor sales. I'm using my own estimates of world-wide PC sales (you can see other estimates here (Apple 2.0))
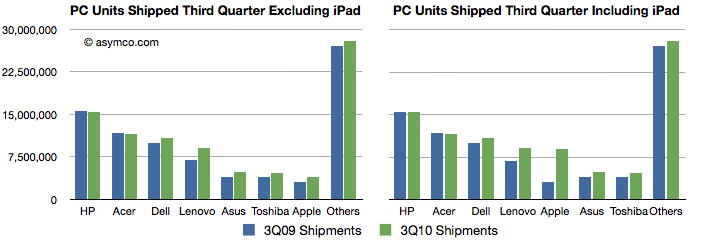
The world-wide PC units shipped without and with iPad:
When including the iPad Apple goes from 7th to 5th ranked, and with 50% growth clearly within shot of top rank next year.
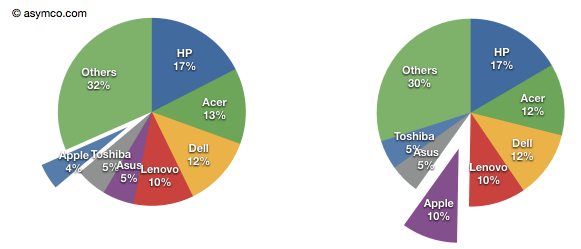
Now I look at PC unit shares:
With the iPad Apple goes from 4% share to 10% share. Again, within striking distance of number one or two in a year.
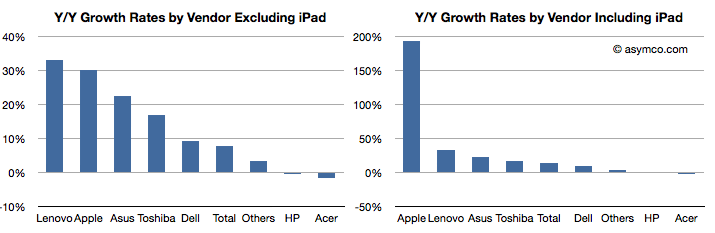
Finally, growth rates:
Apple's share growth goes from second to first but also several times higher than any of the others.
When Gartner spins the iPad as a "Media Tablet" it's clear that the device is disruptive. Reminds me of what Gartner thought about Smartphones four years ago.
I cannot think of a better endorsement for an investment than a snub from Gartner.
only a handful of companies may get into WP7 when it arrives, they added. HTC may end up controlling 70 to 80 percent of the market simply by being one of the initial partners
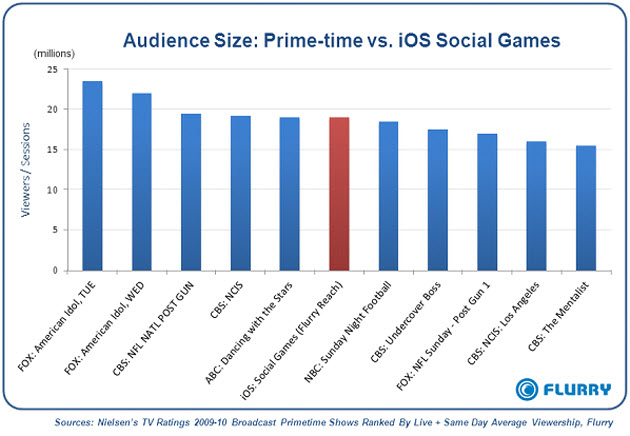
Social games on iPhone, iPad and iPod touch devices are competing for television viewers. In fact, these apps, tracked on the Flurry network alone, comprise of a daily audience of more than 19 million who spend over 22 minutes per day using these apps. Treated as a consumer audience, its size and reach rank somewhere between NBC’s Sunday Night Football and ABC’s Dancing with the Stars, and only 4 million viewers shy from beating the number one prime-time show on television, FOX’s American Idol.
I cannot tell from the original article if the iOS audience is US only and therefore not clear whether the TV shows compete for the same eyeballs, but the data shows just how far apps have come to capturing attention.