Asymco

Asymmetric Intelligence

Horace Dediu

  1. What are the odds of Apple surviving?

    Research · 2 comments

    A tale of two Apples

    What are the odds of it surviving another year, ten years, 50 years?

    Companies don't last long. A recent study that analyzed thousands of European firms yielded a corporate life expectancy figure of 12.5 years. The Boston Consulting Group analyzed the entry, growth, and exit dates of 35,000 publicly listed companies and determined that one in ten of all public companies fail each year, a fourfold increase since 1965.

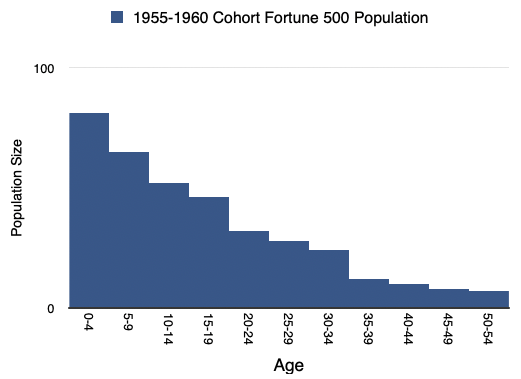
    As I illustrated many years ago in a talk titled "The Unfortunate 500" most companies die not long after adolescence. Of the Fortune 500 1955-1960 cohort, the 81 companies which joined the index in those years, only 7 remain there today. One third of the corporations on the 1970 Fortune 500 list were no longer in existence thirteen years later. Broadly speaking, as a population, large companies that make it to the Fortune 500 listing have life expectancy within that group of 17 years.
    What are the odds of Apple surviving?

    To illustrate further, here is the list of the companies that joined the Fortune 500 In 1976, the year of Apple's birth:

    EntryCompanyExit
    1976SuCrest1976
    1976International Systems & Controls1977
    1976Kewanee Industries1977
    1976Hunt International Resources1979
    1976Peabody Holding1979
    1976Consolidated Aluminum1981
    1976HP Hood1981
    1976Envirotech1982
    1976Peabody International1984
    1976Hughes Tool1987
    1976Cameron Iron Works1990
    1976Foxboro1990
    1976Tektronix1994
    1976Mapco1998
    1976Molson Coors Brewing2009
    1976Baker Hughes2014
    1976Masco2014
    1976Ball2014
    1976Ecolab2014
    1976CF Industries2014

    Not one of those in the 1976 cohort are on the list today. The longest to survive managed to stay on for 38 years.

    Apple joined the Fortune 500 in 1983. Here is a list of all the other companies that joined the index in 1983.

    EntryCompanyExit
    1983North American Coal1983
    1983Datapoint1986
    1983MEI1986
    1983Mobay1986
    1983Coleco Industries1988
    1983Liquid Air1988
    1983AH Robins1989
    1983Sipco1989
    1983Wilson Foods1989
    1983Oxford Industries1991
    1983DR Holdings Inc of Delaware1992
    1983Media General1992
    1983Wisconsin Dairies Cooperative1992
    1983Ametek1994
    1983Hanson Industries NA1994
    1983Meredith1994
    1983Snap On1994
    1983Sun Diamond Growers1994
    1983Universal Foods1994
    1983Worthington Industries1994
    1983AMDAHL1994
    1983Dr Pepper Seven Up1994
    1983Diebold1994
    1983Echlin1998
    1983Stone Container1998
    1983Tyco International1998
    1983Flowers Industries2001
    1983Cooper Tire & Rubber2005
    1983Tribune2008
    1983Holly2011
    1983Apple--

    Apple is the only survivor from that cohort.

    Out of about 2500 companies that existed in the Fortune 500 index since 1955, 50 are still in it. That's a survival rate of only 2%. Approximately 87% of all people born globally between 1955 and 2026 are still alive today. This is why I titled my talk The Unfortunate 500. If this was a human population it would be considered chronically unhealthy.

    However, unlike people, large companies that make it past age 50 tend to stay alive (or independent, as most who exit the index do so because they are merged or acquired--another distinction from biological entities).

    But the way they manage to be resilient is by adapting to a changing world in some fundamental ways. The environment a business lives in (technological, market, economical) changes more rapidly than the biological environment (genetic, radiological, reproduction).

    Companies have to essentially re-define themselves and become something that has little to do with their initial conception.

    In the case of Apple there are clearly two separate entities. The original and the one that was reborn in 1998 when Steve Jobs returned. When you look at the company closely, it's pretty clear that the second Apple was fundamentally different even though the original founder returned.

    In some ways one could argue that Apple 1.0 eventually strayed from its original culture and the reset in 1998 returned it to a core that was resilient but it's more complicated than that.

    To measure "distance" in terms of corporate culture you need to think of culture as a three dimensional vector. it's a composition of resources, processes and priorities (RPP). The combination of these forms what we call the "DNA" or the "culture" or the unwritten constitution of the firm.

    The vector of RPP for Apple changed dramatically in Apple 2.0 in terms of resources (capital, software, silicon), processes (engineering, operations and marketing), and priorities (focus, integration, product/service cohesion)

    I would summarize it as there being a tangible "theory of the firm" for version 2. The first version was very much a theory of the team: a group of great people without a binding operating model.

    Stay tuned as we explore the Theory of Apple.
  2. Valuation in a time of AI

    Research · 1 comment

    Cash flow is a fact, earnings are an opinion and share price is a dream.

    A company's total worth is the number of outstanding shares multiplied by their value. This product is called the market capitalization or Market Cap.

    That's a simplification. If you want to be more accurate, you should take the Market Cap and net out cash and debt--these are not part of the future flows of cash that can benefit shareholders.

    More precisely, there is another measure called the Enterprise Value (EV) which is the total price tag of a company, representing what it would cost to buy the entire business and pay off its debts. EV = Market Cap + Total Debt + Preferred Stock + Minority Interest - Cash and Cash Equivalents.

    This is the precise and complete measure of the firm's value but we use the shortcut of Market Cap since In most cases the Preferred stock and minority interest are negligible and if cash equals debt then the result is EV =~ Market Cap. it's easier to calculate anyways as the shares outstanding and share price are easily available. Not so for EV.

    To get a sense of how much you're paying for the company it makes sense to divide the Market Cap by the company's Earnings so you get an idea of how many years it will take to get back your investment. When dividing both Market Cap and Earnings by the number of shares it becomes the famous P/E ratio or Price per share / Earnings per share.

    But if you want to be fully precise, instead of using Market Cap you should use Enterprise Value. In that case the denominator should be Free Cash Flow or FCF1. The ratio becomes EV/FCF. Free Cash Flow is a better measure than earnings because it takes into consideration depreciation, change in working capital and capital expenditures. It measures the actual cash a company generates after paying for its operating and capital expenditures.

    EV/FCF takes into consideration unusual situations such as huge amounts of cash or debt or capital expenditures which removes shareholder access to what the company "earns" on paper. This why the adage of "earnings are an opinion but cash flow is a fact" exists.

    I used EV/FCF years ago to value Apple because at a time when it held huge amounts of cash. This was before it began aggressively reducing its cash through its capital return program. The P/E ratio at the time was very low but excluding the cash, it was even lower. It was a huge red flag indicating that the company was being priced for liquidation, or as some analyst put it, priced like a steel mill going out of business. If at that time you did not believe that its demise was imminent you would have surely been richly rewarded.

    Today the anomaly that throws the P/E off is not Cash but CapEx. And it's not for Apple but for the other mega caps or AI "hyper scalers". Without worrying who is or isn't in the "Magnificent 7" I compiled the largest 10 market capitalization companies and looked at their P/E and EV/FCF ratios. At time of writing:

    CompanyMarket CapP/E RatioEV/FCF
    NVDA$4,014,456,963,07233.644.4
    AAPL$3,624,949,514,24031.330.3
    GOOG$3,304,174,911,48825.244.3
    MSFT$2,667,926,257,66422.535.0
    AMZN$2,157,182,320,64028.0297.0
    TSM$1,641,528,688,64030.650.0
    TSLA$1,333,163,982,848332.0225.0
    META$1,356,802,949,12022.832.6
    BRK-B$1,023,780,323,32815.344.1
    LLY$793,550,454,78438.6142.3

    As recently as six months ago, there was a lot of talk about an AI bubble. Back then I looked at the data then and by looking at the P/E ratios convinced myself that the valuations were not "bubble" level. They were in the mid-thirties. These were not historical high especially when considering the growth these companies were experiencing (over 30%). Since then prices have come down significantly.

    This is as the CapEx elephant in the room has been making itself known and there is renewed alarm at the scale of capital spending. This is reflected in the EV/FCF number but not in the P/E number.

    The table above shows how much more elevated the EV/FCF ratio is relative to P/E for many of the companies. This "truer" measure of what you are paying as a share buyer is now reflecting in reduced share price and hence reduced P/E.

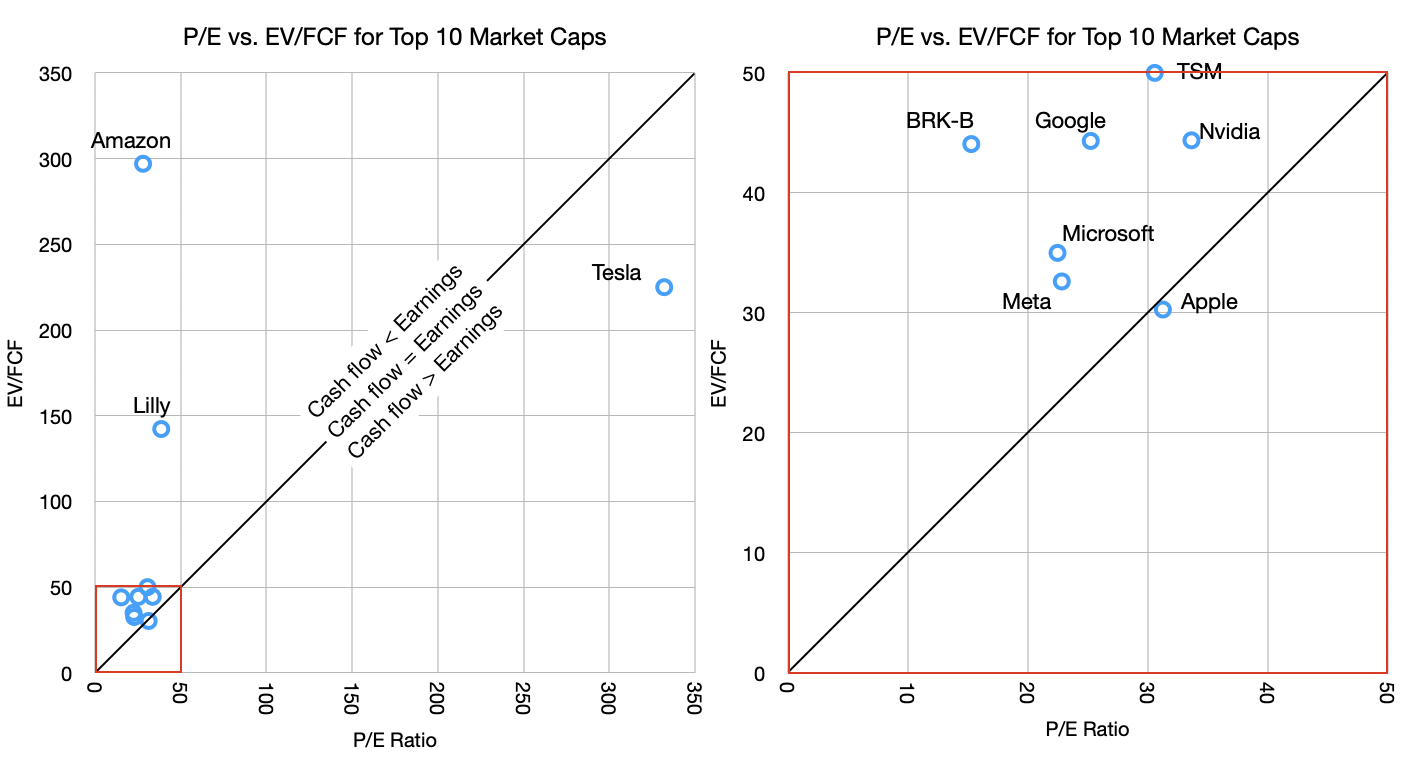
    Of course, this is not true for Apple. Apple's P/E ratio and EV/FCF are nearly identical. To see this more clearly I put together these graphs.

    Valuation in a time of AI

    The graph shows the P/E vs. EV/FCF for the companies in the table. The graphs are the same data but the one on the right is zoomed in on the lower left corner (note the red squares).

    The reason for the zoom is that there are three outliers. Tesla, Amazon and Lilly. Tesla has absurd valuation on both P/E (300 to 400 range in last 6 months) and EV/FCF while Amazon has an outrageous EV/FCF value due to abnormal capital spending. Basically, Tesla has negligible earnings (and negative growth) while holding astronomical share price and Amazon is spending far above its median on CapEx. Amazon's 10-year EV/FCF is much lower, at approximately 55.

    But let's ignore the outliers and concentrate on the other seven in the cluster. These are below 50 P/E and 50 EV/FCF thresholds.

    Note that I drew a diagonal line representing the equation of P/E = EV/FCF. This should, under normal circumstances, hold for most stocks. Just like Market Cap should roughly equal Enterprise Value so Earnings should equal Free Cash Flow.

    Most companies should not stray too far from this line. But what we are seeing, with the notable exception of Apple, is that most tech companies have cash flow far below earnings. This is again due to the CapEx elephant.

    The argument goes that this is a temporary situation with that capital being wisely deployed for returns from AI. Presumably, these companies will swing to the other side of the line, where cash flows will exceed earnings, compensating for the capex that was denied to the shareholders.

    This is where the old adage comes into play: Earnings are an opinion but cash flow is a fact. I added to that "and share price is a dream". Take the free cash flow and multiply it by a "dream" and you get the price the market sets. This dream is the multiple.

    What makes the AI "bubble" interesting is how it's not fueled by debt2 but by cash flow. Companies are turning over large portions (almost all and sometimes more) of their cash flows to investing in the dream of AI profits. All but one, of course.

    There is something obviously contrarian in Apple's strategy. Perhaps it's not Apple that is odd but rather there is groupthink on behalf of the others. The question of who's right will rest on whether it turns out that AI is going to commoditize quickly or perhaps never, whether AI turns out to be modular or integrated, whether AI exhibits disruptive or sustaining competitive responses, whether it's an infrastructure subject to regulatory corrosion or whether it will migrate to the edge and iterate freely, whether it's a new experience or simply better existing experiences, whether it creates new markets or just makes existing ones more efficient.

    These are not new questions. They have been applied to all software and hardware innovations of the last 40 years. We have a lot of history to inform us.

    Join me as we learn.

    1. To calculate FCF, look at the Income statement, start with earnings before interest and taxes (EBIT), add depreciation, subtract taxes and CapEx.
    2. There is some debt of course, but the scale is so immense and the risks so high that most lenders would not touch this type of investment.
  3. Asymco Bulletin 007 - Apr 5, 2026

    Bulletin

    Asymco Bulletin is a digest of all the work we have published for the week ending Apr 5, 2026.


    Podcast

    Apple at 50 – Ben Thompson interviews Horace Dediu

    Apple at 50: Ben Thompson of Stratechery interviews Horace Dediu → Horace describes his journey from Romania to becoming a leading tech analyst, highlighting his experiences at GTE Labs, business school under Clayton Christensen, and Nokia during the iPhone's birth. He emphasizes Apple's customer-centric approach and its potential to navigate AI challenges. Dediu also shares insights on his new paid service, Asymco One, and reflects on the importance of understanding market dynamics and customer satisfaction. He expresses optimism about Apple's future and underscores the value of deep, long-term analysis in tech forecasting. →


    Nota Bene

    Apple Maps Is Getting Ads. It’s Apple’s Riskiest Bet Yet → Apple streamlines business tools and cautiously enters Maps advertising. It's not Apple's riskiest bet yet. →

    Survey shows iPhone improved retention, purchase intent, growth in services, service pricing, product mix, foldable upside → Despite robust customer loyalty, service growth, and strategic hardware shifts bolstering margins, UBS's maintains neutral stance and $280 target. →

    Apple’s Business Strategy → Apple's enterprise growth is driven by its strong consumer base. Do new services like Apple Business suggest a new emphasis? →

    Melius highlights FCF while reiterating buy on Apple → In the AI era, valuation shifts from traditional P/E to EV/FCF, highlighting Apple's robust financial health and fair valuation amidst its significant product launches. →

    The iPhone 50 years from now – and why Apple won’t have AI execs → Rumors suggest the iPhone 70th anniversary edition might feature an innovative new camera system, while Apple CEO Tim Cook dismisses the idea of AI-led executives due to legal and functional constraints. →

    We know that Macs last longer in use. How much longer? → Macs and iPhones outlast Windows PCs and Android phones in enterprises, yet decisions are suboptimal. How long will that last? →

    Warren Buffett tries to justify his hypocrisy → Buffett's actions on Apple highlight a difference between his statements and his actions. →

    Apple Vision Pro users will be able to experience NASA’s Artemis II launch in immersive video

    Apple Vision Pro users will be able to experience NASA’s Artemis II launch in immersive video → Immersive experiences redefine our connection to events such as space exploration. →

    Mac market share to grow from 9% to 12% in 2026 → "Apple defies the 2026 notebook market slump with a strategic shift, poised for its largest share gain since 1991." →

    Analysis: Mac grew 16% and iPad grow 15% in China in the fourth quarter of 2025 → In 2025, Apple's Mac and iPad sales in China saw notable year-over-year growth, while looming 2026 market contractions hint at challenges. Apple might defy trend with new launches. →


    Office Hours

    The next Asymco Office Hours Live Q&A will be held on:

    Wed April 8 at 12pm ET / 9am PT
    Asymco.com/live

    Asymco One subscribers can sign up to attend the live Q&A with our own Horacle of Helsinksi.

    Conference details will be sent to participants with ample time before the call. Watch asymco.com/live for latest updates.


    Asymco One gives you full access to our research, analysis, and commentary. Subscribe with code BULLETIN for a discount.

    We appreciate your feedback! Have questions or comments? Reach out to us at contact@asymco.com. Looking forward to hearing from you.