In last year's third calendar quarter earnings call (October 20, 2009) Tim Cook was asked:
“So when you go from exclusive to multiple, you don’t change the charge to the carrier?”
Cook answered: “Correct.”
In this year's third calendar quarter earnings call (October 18, 2010) Tim Cook was asked again whether the future iPhone non-exclusive subsidy will affect the iPhone revenues and again Tim Cook repeated that it won't.
Chris Whitmore - Deutsche Bank
And what is your experience then when you've gone non-exclusive from a subsidy and margin standpoint on the phone, have you had to give anything up in the past?
Tim Cook
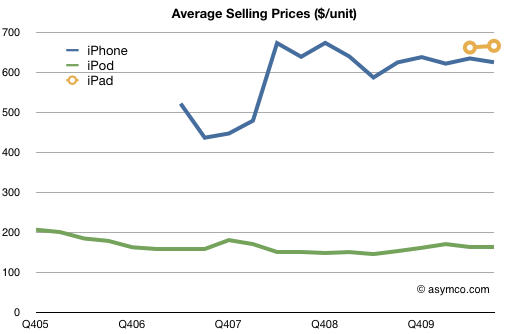
We don't give specific information out on the margins. But I think you can look at our ASPs and see that they've generally stayed above $600, and that's despite opening up several markets from an exclusive market to a non-exclusive market.
The recurring assumption that the loss of AT&T exclusivity will cause iPhone price erosion is wrong and has been evident in the sales data for over a year now. Not only did Cook state clearly that there is one price for iPhone to the channel regardless of exclusivity but the price data shows that as Apple moved to non-exclusives in many regions of the world, the ASP remained fairly constant:
Over the period when the blue line has been flat, Apple moved a number of markets from exclusive to non-exclusive. There are three main countries where iPhones have a contractual exclusive relationship. That is the United States, Germany and Spain. (China and Japan are exclusive due to network technologies). All these markets will go to non-exclusive next year. I don't expect any change in the ASP as a result.
The final data point comes from AT&T themselves when they revealed the price they paid for the iPhone was roughly the same as the ASP shown above.
Apple's "Back to the Mac" was a clever play on words. Everyone expected it to mean that the event was going to focus back on new Mac products. As we had been so steeped in iDevice news the Mac was feeling neglected. It was time to take the discussion "back to the Mac."
Instead Apple told us that the Mac and OSX were going to become more like Devices and iOS. iOS innovations were what's going "back to the Mac"
So it wasn't "back to talk about the Mac" it was "OSX went to iOS and iOS is going back to OSX." The strategic upshot of it is that "the Mac is an extension of the device portfolio." Heady stuff. We'll need to chew on this for a while.
But some implications are easy to foresee. For example, the consequences for competitors. When Apple launched the iPhone, competitors followed suit, powering their phones with a variety of "open" operating systems. When Apple launched the iPad, competitors followed suit, powering their devices with a variety of "open" operating systems. These reactions to Apple's initiatives by dozens of "open-wielding" competitors are all being touted as the inevitably winning strategies.
So, as we've observed all of Apple's strategies being copied, I can't wait to see the competitors follow its "back to the Mac" strategy:
It won't be long before Dell takes UI and hardware design elements from the Streak "back to the PC." Think of the magic that will happen when Android Froyo "hooks up" with Windows 7. Both Android and Windows being "open", if I squint hard enough I can just visualize the tweet from Andy Rubin of the command line to build a new Windows 8 with Android mojo. The Android Market selling Windows Apps. It will be beautiful.
Or perhaps we'll soon see "back to the Blackberry" as RIM takes QNX interface elements back to their core business. Not so sure about the command line make statement there.
Or maybe Nokia will announce "back to Symbian" as they take gestures from the ultra-open MeeGo to do an evolution of their majestically open Symbian.
These initiative will surely be helped by the vast community of open developers surging to support the great open merged PC/tablet/device future.
As a clue to the sarcasm challenged: The power of Apple's integrated approach across its product lines goes deeper than the user experience.
The iPad was announced to a loud chorus of disapproval and disdain. It's easy to forget the overwhelming scorn and insult poured on the product for months before and after sales start. Analyst forecasts were comical. At this time it looks like all 12 month iPad unit forecasts will have missed by more than 100% (mine included).
As data on iPad performance was published for the first quarter's sales, the mood swung from ridicule to ridiculous.
Without regard to the growth of comparable products, analysts seem to have latched on to production figures which are notoriously inaccurate. The problem with production numbers is that they are only very loosely coupled with shipment numbers to customers. There are questions of work in progress inventory, finished inventory and the actual accuracy of reports. Production also follows a ramp and is not constant over time.
Another way to analyze a new product is to think about the distribution. Although late in the quarter some large distribution deals were made public, the channel did not have much time to be filled before the end of the quarter. Not only that but there is easily obtainable evidence that the iPad did not reach most international markets. Apple announced how they were rolling out a few countries every few months.
This trickle of international sales indicated to me that the iPad sales pump was not yet fully primed. My initial estimate was for in-line sales of 3.3 million which I aggressively increased to 5 based on some of the production numbers being mentioned.
This figure turned out to be 22% too high, but not as big an error as some of the other analysts.
Another way to look at it is through comparable products. The nearest comparable product to the iPad is actually the iPhone. It was a similarly "revolutionary and magical" product launched with a similar constraint on production and distribution. It was also built and marketed by the same people. They've been down this road before and have honed the process from the iPod through the iPhone over a decade.
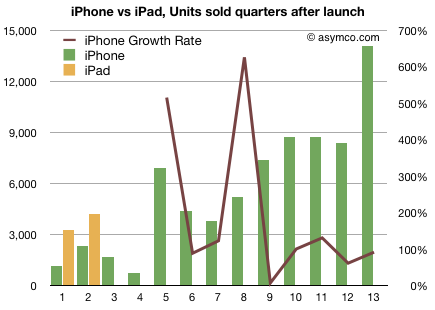
If we look at the iPhone and compare it with the iPad, we see just how popular the iPad really is. It may not follow the same seasonal pattern as the iPhone, but it will probably ramp in a similar way. In the following chart I also show the iPhone Growth rate (right scale).
The iPhone has been able to maintain over 100% y/y growth on average. I don't see a reason why the iPad can't repeat this pattern over the next three years.
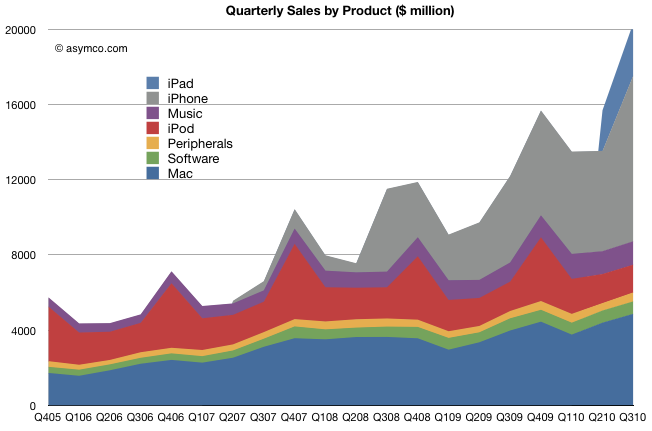
This chart speaks for itself. Note the bottom two bands and the proportion of the total that they make up.
Also note the seasonality with the holiday spikes. This last quarter is not a holiday quarter. Now imagine what next quarter will look like on this chart.
As a final note, think back to 2001 before the iPod. The the Blue, Green and Yellow bands were all that Apple had.
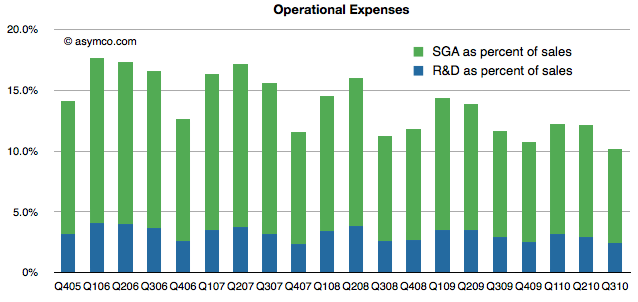
Apple sales are growing faster than its operating expenses. Although all eyes are on gross margin, the company continues to run a tight ship in fixed costs (costs which do not vary with the output).
In terms of R&D, spending has dropped to 2.4% of sales, a level seen only once since 2005. Sales, General and Administrative costs also dropped to 7.7% of sales, a new record low.
The total operating expenses as a percent of sales stands at 10.2%. The following chart shows the trend.
Keep in mind that, in many ways, the leadership of Apple in both marketing and product development means are doing the job for all the knockoffs, copycats and ripoff artists in the industry. Including that fat chunk of the industry means that those few engineers and designers and marketers accomplish a feat of efficiency that boggles the mind. Thanks, I say.
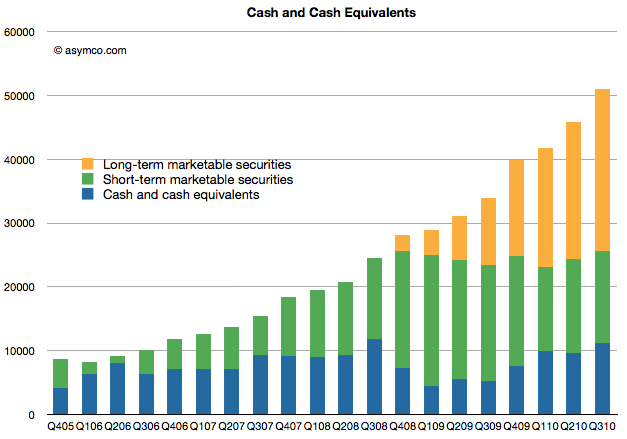
During the last quarter the company added $5.2 billion to its cash, long- and short-term marketable securities accounts for a total of $51 billion. This amounts to about $53 per share vs. $49.43 per share in July (making the share price about $250 ex-cash).
I would caution again that when reading commentary about Apple's cash that many observers exclude long-term securities from the "cash" total.
To see the difference in the total, this chart breaks out the three different accounts over time.
Note that without long-term securities, the cash wold appear to have stayed roughly constant since Q4 2008.
Also note that in the third quarter of 2006 the company had just crossed $10 billion. The cash equivalents are now over five times bigger. The amount also doubled since Q3 2008. It is the largest cash hoard of any technology company.
The question of what this cash will be used for remains open with management repeating that opportunities might arise to do something big.
Following earnings growth of 68%, after hours trading of AAPL at $300/share shows a P/E of 19.8. The company added over $5 billion in cash for a total of $51 billion or $52.9/share.
Excluding cash from the price of $300 leads to an enterprise value of $249 and a trailing twelve months earnings of $15.15. The ex-cash P/E is therefore 16.44.
P/E/trailing Growth is 0.29.
My guess is that this is keeping AAPL cheaper than the S&P 500 on both P/E and P/E/G.
One of the most hotly debated subjects in the mobile phone business is the importance of market share. It's also a topic of lore in the PC industry. Briefly the two arguments are:
Market share matters more because it drives network effects which ultimately drive competition out of the market, creating the opportunity for monopoly rents.
Profit share matters more because profit is the only fuel that can drive innovation. Any macro downturn or shift in strategy can cause a company to cease investing in unprofitable projects.
The old disruptor's adage: "Be hungry for profits and patient for growth" is challenged by the equally disruptive: "Grow share with lower prices in exchange for new revenue sources."
There are many rich anecdotes to support each strategy, but how about some data? Fortunately we have some: the market and profit shares for vendors covering 80% of the world's largest technology market over a three year period. The vendors are a good proxy for the market, the time frame is long enough to cover seasonality and anomalies and the market is very big (over 1.2 billion devices) and very broad (world-wide).
The only question is how to measure success. One measure is how various strategies benefit the asset owners, i.e. the share holders. Benefit to society, employees and consumers are very difficult to measure. But share holder benefit is easily obtained by measuring change in share prices.
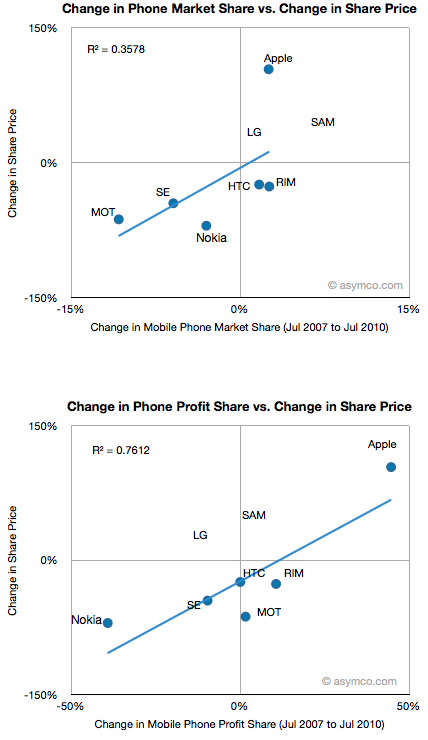
So, here are two charts:
The percent change in market share vs. percent change in share price for the top mobile phone vendors.
The percent change in profit share vs. percent change in share price for the same vendors. (see note 1 for time frame discussion).
I showed the R-squared value of the correlations. (See note 2 regarding LG and Samsung). At r-squared of 0.36 share price is not well correlated to market share while at 0.76 it is rather well correlated to profit share. To a financial analyst this would seem obvious. After all, share price reflects the present value of future cash flows which are clearly coupled to profit and hence to profit share growth. However, as many technology observers would point out, market share determined the success of Microsoft and Google, and to some degree Nokia.
High market share can cause competitors to be starved of components or ecosystem developers. At the same time, high profit share can cause competitors to be starved of capital.
What does this analysis add to the argument? Note that this data covers a hardware business. Is hardware relevant? It does not scale as rapidly and has a short shelf life. It's also notoriously difficult to distribute. However, outside of the service revenues for cellular voice and data, device hardware is the only pool of money that has any material dimension in the industry. It's also the pool of money with the highest margin in the industry. For the time being and the foreseeable future, hardware is the only business model worth anything in mobile computing.
The data shows that in this particular but substantial market profit share is closely correlated to shareholder value creation. It also shows that profit loss is closely correlated with shareholder destruction. The dominant data comes from Apple and Nokia, which appear to be polar opposites in performance on both measures.
In other articles I've shown how profits have shifted from incumbents to entrants in the smartphone disruption. This shift has resulted in direct benefit and loss to the owners of the two asset classes. To suggest that market share alone is a determinant of "success" in the device market must exclude the effect on shareholders and, ultimately, the management and employees of the companies concerned. The virtuous/vicious cycles will be fed by the profit variable more than any other.
I don't think the market share argument holds water in this market and this data supports my belief. It may be that as value shifts over time away from hardware the benefit will shift as well, but business models alternatives to hardware have not emerged after ten years of experimentation. If anything, the idea of selling hardware as a way of capturing service revenue was pioneered by RIM and perfected by Apple. Nothing I've seen so far is challenging this model. Whoever attempts to siphon the device pool of money (which has remained fairly constant over the smartphone disruption) needs to solve system-wide problems like the dependence on the network and the life-cycle of portable electronics.
----
Notes:
The dates when performance was sampled are are July 1 2007 to July 1 2010. The latest quarter (3Q10) has not been included in this data as it has not been fully reported. The data will be updated with the latest quarter as soon as it's possible.
For many competitors the share price is dependent on more than performance in the mobile phone market. In particular, LG, Samsung, Motorola and Apple have diversified product lines which affect their share prices. Two of those companies (LG and Samsung) are conglomerates and their share performance is dominated by businesses other than mobile so I did not include their data in the correlation measure (though their place on the chart is shown). Motorola and Apple's stock prices were, to a very large extent, driven by their mobile phone performance over the same period so their data is included in the correlation analysis. The other vendors have been primarily focused on mobile phones.
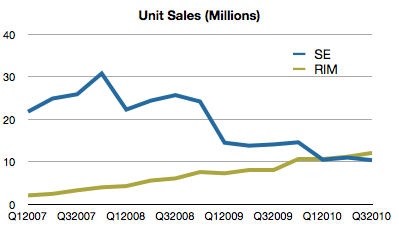
Sony Ericsson is to stop making smartphones featuring Nokia’s Symbian operating system.
The move means that the troubled Finnish mobile maker is likely to be the only significant user of Symbian.
Analysts said Sony Ericsson’s decision confirmed the “failure” of Symbian as an open source platform, given that it was supposed to be used by several large mobile makers.
“Our third consecutive quarter of profitable results illustrates that Sony Ericsson’s overall performance is stabilizing. Our strategy to focus on the smartphone segment is succeeding and smartphones now comprise more than 50% of our total sales,” Chief Executive Bert Nordberg said in a statement.
The Verizon distribution for iPad is an unexpected development. Coupled with distribution through AT&T stores, and rapidly expanding retail points of purchase, it seems that the iPad is destined to be the most widely distributed product Apple sells. The iPod never reached operator points of purchase and the Mac is orders of magnitude more constrained.
What seems to be happening is that Apple is pulling out all the stops and going for unrestricted iPad distribution. This may also foreshadow unrestricted iPhone distribution next year. It may also portend a CDMA iPad (or at least an LTE version) next year.
If it happens all estimates for next year need to be revised sharply. I had been expecting 100% growth for the iPad and 50% growth for the iPhone. These might need to be increased to 150% and 100%.
The consequence could be that total iOS devices sold could top 150 million for calendar 2011.