Asymco

Asymmetric Intelligence

Research

  1. Price competition

    Research · 102 comments

    Apple's products are often seen as being priced "at a premium". This is mostly a matter of perception, but in certain categories Apple's products are priced above the industry average (though probably still affordable to sufficiently large populations). As a result, when competitors launch lower-priced products there is a tendency to expect Apple to react and reduce its prices to compete.

    This expectation was evident when AT&T had an exclusive on the iPhone. The assumption among many (expressed in comments here as well as elsewhere) was that a switch to multi-carrier distribution would result in a price reduction and consequently a reduction in margins.

    It was evident in the iPod and the Mac businesses over the years as prices for competing products collapsed.

    It is also evident with respect to the iPad where expectations are that the Kindle will cause a reduction in the iPad price (and presumably in the margin).

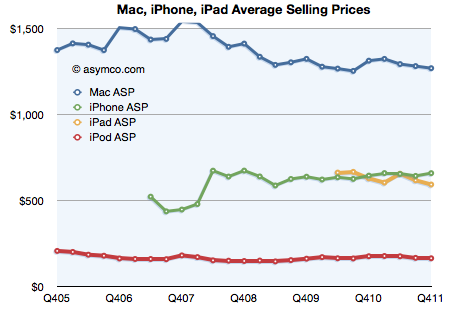
    However, the data we have from Apple on their pricing shows no concessions to competitive price pressure. The following chart shows the historic prices that Apple was able to obtain for its main product lines:

    Over the time span shown (six years) the Mac and iPod saw modest price erosion as would be expected from declines in component costs but there is little evidence that Apple altered fundamental price points (note that these values represent pricing to the channel not to consumers who pay for retail mark-up or discounting/subsidy/taxation).

    Similarly, both the iPhone and iPad have held prices very consistently. There is some seasonality as products are launched and there were a few quarters where the original iPhone was priced differently, with operator service revenue sharing lowering the up-front price. But there is a consistency to these products that speaks of a strategy that avoids price-based competition.

    In the latest quarter Apple launched a few new price points for the iPhone. With the 3GS and the iPhone 4 and 4S available, Apple had the closest it ever came to a phone portfolio. There was some anticipation that the 3GS price point ($375) would impact the average selling price. However Tim Cook stated that the 4S was the most popular product. Furthermore, the 4S introduced a higher capacity (64GB) which offered a new, higher price point.

    As a result, the ASP for the iPhone actually increased to about $660 in Q4. During the launch quarter the iPhone ASP does tend to be higher but history shows that the variance is small. Gifting seasons also affect pricing where the mix shifts to lower priced variants as seen with the iPad and iPod, but again, these are not great changes and entirely due to mix shift. There is no discounting.

    The evidence I see is that Apple does not change pricing but rather stakes out a specific price point as resonating with consumers given their positioning. They then doggedly stick to it. Competitors tend to exploit open price points or try to position with specs on the same spots Apple occupies. That's not a game I observe being played by Apple.

  2. Apple added $38 billion in cash last year

    Research · 106 comments

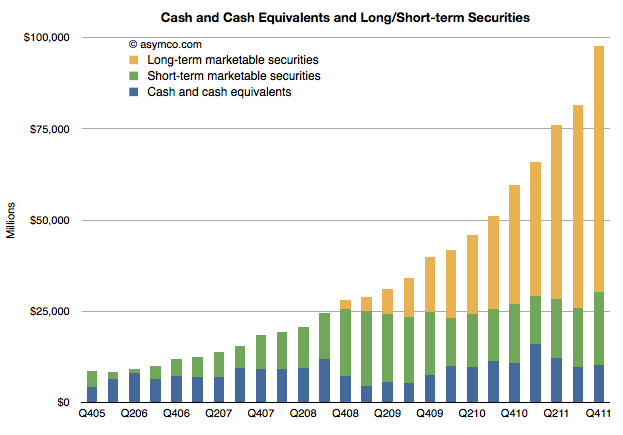
    Last year I suggested that Apple could reach $100 billion for 2011. That was based on the addition of about $20 billion during 2010. Apple added $38 billion to reach $97.6 billion at the end of 2011.

    The following chart shows the composition and scale of Apple's cash holdings.

    At the closing price, Apple's market value is equivalent to 4.3 times the value of their cash.

  3. The story of Fernforest and Petro Dale

    Research · 79 comments

    Once upon a time there were some innovative farmers that developed a new hybrid crop that could satisfy the hunger of a growing population. This crop grew best in large farms which had to be situated far from where people lived. The food was so tasty and production could scale so quickly that it became necessary and possible to build a novel way to deliver this food to the population. The farmers built their own transportation network, which they called a "railway".

    This network of rail was itself very efficient and soon overtook the ability of restaurants and small shops to absorb the produce. In order to keep the pipeline of food filled, the farmers (now with their own railways) bought most restaurants and grocery stores. They transformed them into more efficient food retailers and the result was even more consumption and demand for the food.

    To keep the population happy, the farmers constantly devised new food hybrids and new recipes for the restaurants. The food design process became a profession, even an art form. The farmers employed the best and most creative minds  when it came to food. They created unique recipes that became instant hits and were widely consumed. They invented "star foods" and "blockbuster dishes". The process of churning out these hits was so highly honed that farms became factories of ideas.

    At the same time, the workers on the farms became unionized and they reached an understanding with the farmers so that every new "food production" allocated healthy wages to the workers. Due to their newfound fame, some of the food designers even got a portion of the profits from their creativity. Food making reached unprecedented levels of quality with very wide distribution to almost every restaurant in the world.

    After a while the government became nervous about the level of control the farms (and their railways etc.) had over the nation's food supply. The government worried that this level of concentration would lead to price gouging. They sought concessions and eventually the Supreme Court decreed that farmers could not own restaurants. The restaurants became independent. However, since the main food supply came from the same farmers and they owned the railways, the independent restaurants could do nothing but serve the same food that was on offer when they were part of the syndicate. The consumer did not see much change in either the availability or the quality of food though food prices did remain steady and the government was satisfied.

    This system worked so well that it remained in place for over 100 years. The food production system became the stuff of myth and legend. It had its own name based on the fertile valley where it started: Fernforest.

    It was not a system without any innovation. In the interest of efficiency small changes were always made. These "innovations" included outsourcing the farming so independent farmers who concentrated on efficiency had the largest share of production. Fernforest innovated in their financing practices and in their accounting for new food products. Fernforest accepted new ways of packaging the food. For example, freezing dishes and selling them in supermarkets ready to eat. They gave more creative freedom to the food designers and the farm technicians, many of who became rich.

    But they all depended on the robust rail network. Over time, the rail network became the most critical component in the Fernforest system. So much so that 30 to 40 percent of all the money collected from food sales went to the railway consortium. With that vast cash flow the magnates of Fernforest decided which food hybrid would be grown, how much money would be spent in its production and essentially determined the flavors and tastes of society. They claimed that only they knew how to gauge what meal would become a hit and only they could be trusted to bet heavily on producing the source ingredients. Each production ended up costing hundreds of millions of dollars and since only they could ship the stuff, only they would finance the production. It was a self-fulfilling prophecy: Fernforest became taste makers and their executives used that advantage to maintain the enormous distribution fees which financed the next hit.

    It looked like the system would remain in place, essentially unchanged, forever. Food was a necessity, people would always need to eat, and this was the most efficient way of making and selling food. And it almost always tasted good.

    Then a strange new invention came into being. It was completely unrelated to the food business. It was, in fact, a new engine--the internal combustion engine. This spawned a new invention called the automobile. The automobile was so useful for many transportation tasks that it developed its own network architecture: the so-called "road network". A new industry developed to harness the value of this engine, vehicle and transportation network. It became based in a different part of the country, coincidentally also a valley. It was called Petro Dale after the fuel the new engines used.

    Fernforest took no notice of this new industry. They did not find use for the new technology. The Petro engines were too small and inefficient for their food train locomotives. Automobiles were designed for moving around small loads. Fernforest wanted to increase the size of its trains, not to decrease them. Autos were taking stuff in small portions to small consumers. It all looked inefficient and useless.

    But Petro Dale was booming anyway. They found that their engines and cars were hugely useful for individuals transporting all manner of goods beside food. They thrived even without the support of Fernforest. The car owners built small businesses and grew them as the power of the engines grew. Eventually some entrepreneurs with cars decided that they could build gardens, greenhouses and farms and get their produce to local markets quite efficiently. It was not a big opportunity and some of these creative food innovators were acquired by the big farms and their recipes were scaled up for the Fernforest system. But small operators kept popping up and many made a modest living growing food.

    However, some unscrupulous car owners copied the recipes of the big hits from Fernforest and duplicated the food locally and sold it locally in violation of the laws protecting recipe rights. Fernforest saw this as a clear and present danger and reacted very angrily. So much so that they sought to ban all cars. They saw cars and roads as built primarily to steal food ideas. Quickly, this became a toxic political conflict. After an outcry from car owners, the efforts of the rail and farm protection society (Nourishment Association of America or NAA) failed. They had reached the limit of their political power.

    However, the attempt to ban cars caused Petro Dale to wake up to the threat of railways. They realized that even though much more commerce took place with cars and roads, and even though railways were becoming increasingly irrelevant, they would remain a potential regressive threat. In the past Petro Dale had sought to do business with the incumbent food network distributors, suggesting ways of taking the mass market food produce and distributing it to new franchises like mobile food trucks and fast food restaurants. They were spurned. Now they realized that trying to work with Fernforest was not just futile but  harmful.

    Instead, Petro Dale changed strategy and sought to encourage local food production and guaranteed that any local recipe designer could get their dish distributed via a far more pervasive road and take-out network. Thousands of food designers took up the challenge. Even some of the designers that worked on the big farms saw the future was in independent distribution. Even though they had grown rich working for the big farms, they had been chafing under the "green lighting" process of railway magnates.They wanted to connect to take-outs and consumers directly, bypassing both rail and restaurants. Cars seemed suddenly good enough.

    Farmers themselves began to be disenchanted with the railway system and Fernforest as a way to produce food. Their role had been reduced to being outsourced factories. The decisions on what to plant came from the railway executives. They felt that their technical knowledge, which created the industry in the first place, was not valued. What's worse, from their point of view, the service railways provided was becoming inefficient. Freighting by train meant that they could not package food in novel ways. Being disconnected from the consumer, they could not create some of the hybrids they knew were in demand (as small growers had already proven). The creative people that had been working for them were fleeing while the cost structures (and union wages) remained. Their idea factories were falling apart.

    Even the public woke up to the blandness of Fernforest products. They were becoming increasingly attracted to meal alternatives that came direct to their house (home delivery and take-out) and were tiring of chain restaurants. The local stuff was fresher. Besides, they reasoned, I own a car myself. Why should so much of my money be paid to railroads?
     

  4. Introducing Asymconf

    Research · 24 comments

    Asymconf is the Asymco experience. Live.

    Attendees will be treated to an engaging, participatory experience. Using the case method, you will be guided through four probing questions pertinent in modern market analysis.

    1. What is disruption and how can it be harnessed? The case of mobile computing.
    2. What are the jobs that the entertainment industry is hired to do? The case of Hollywood.
    3. Is Wall Street more than good enough? The case of financial over-service.
    4. What are the limits of education? The case of learning and the theater.

    If you would like to take part, please register your interest here.

    —Horace Dediu & Indrek Vainu


  5. The conditions for survival and prosperity

    Research · 37 comments

    Yesterday's post described the history of personal computing platforms over the past 37 years. It showed a distinct shifting of "eras" between traditional personal computing and the emergent mobile computing represented by device-based platforms.

    Underlying these lives (and deaths) of platforms were the growth (and decline) of fortunes of companies and people. I hoped that by observing these patterns insight could be gained into the conditions for success or failure.

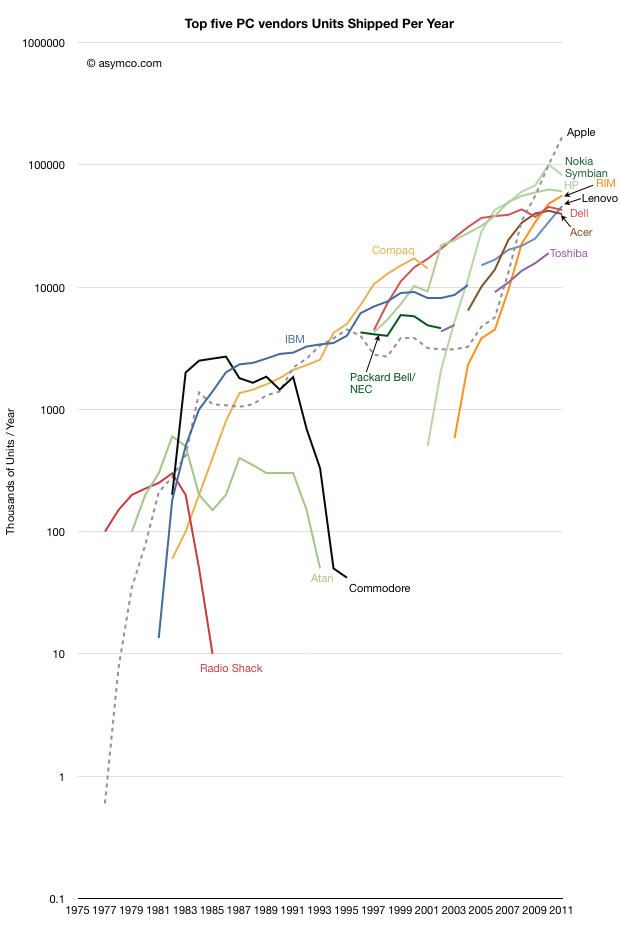
    The following graph shows the companies which were predominant (in the top five ranking by shipments[1]) during each year of the industry's history and the volumes they were able to obtain during that period. I also added Nokia and RIM as examples of the challengers coming from mobile devices.

    It's a difficult graph to interpret. The pattern I observed was that most companies were not able to sustain presence in the top five ranking for long. Indeed, regardless of having one's own platform or being a licensee, companies seemed to fade reliably. Some were acquired, some sold their operations but there is a distinct impermanence to their prosperity.

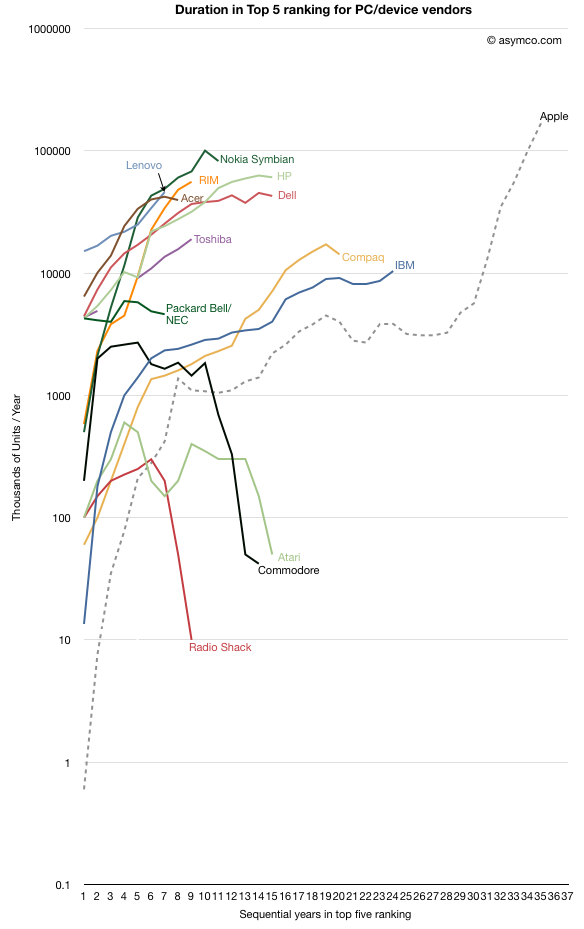
    To sharpen this perspective of longevity I indexed each company to the point when they entered the "prosperity zone" and measured their staying power within it. The following graph shows these indexed lives.


    Apart from Apple, IBM remained in the business the longest (24 years). Compaq was second with 20 years before being bought by HP. HP and Dell are still operating after 15 years, having tied Atari and Commodore. After these ancients, the upstarts Nokia and RIM are struggling to remain relevant after 10 to 12 years.

    Then there are the transients like Packard-Bell/NEC, Toshiba, Radio Shack and Fujitsu which lasted less than 10 years. The newest PC companies are all from China or Taiwan: Acer, Asus and Lenovo. Their longevity cannot be called yet though Acer seems to be in decline. Lenovo, which took over IBM's brands continues to grow. However, as yesterday's post showed, without diversification into devices, pure PC makers are likely to fade.

    But besides this interesting history lesson, there is a deeper, unsettling observation. The scale of these periods of prosperity is far shorter than the average person's career. Indeed, the entire time span of the study is 35 years, about the time an average person will be employed. All the companies failed to maintain prosperity over this time frame.

    These are a small sample, flawed by showing only hardware units, but I consider it a proxy for the overall technology market. Software-only or services companies have had no better records.

    The implications for company managers and workers is profound. Chances are that the business you work for will not prosper for more than a decade and will reward you for an even shorter period. Similarly, as witnessed by the P/E ratios, investors have  given up on this industry as one with any quality of earnings.

    There is no "rule" that this has to be so. The high mortality rate and short longevity of technology companies is a consequence of a failure to manage innovation and disruption. Apple may be an exception--one I think worth studying. Though not always prosperous, it has managed to survive, being the only company from the early era of personal computing to still be operating in the industry. Indeed, it's now the most prosperous. Maybe it's a fluke, but I rather think it's due to an ability to re-define itself as the market shifts. Its essential quality being an ability to disrupt itself.

    And if we think about it this way, ultimately, longevity is more important than prosperity. Without patience there is nothing but chance determining prosperity. The fate of more than company finances rests in the balance.

    Notes:

    1. Apple did not maintain a position in the top 5 throughout this period but is shown as a benchmark as it remained in the same business throughout this period.
  6. [Updated] The rise and fall of personal computing

    Research · 276 comments

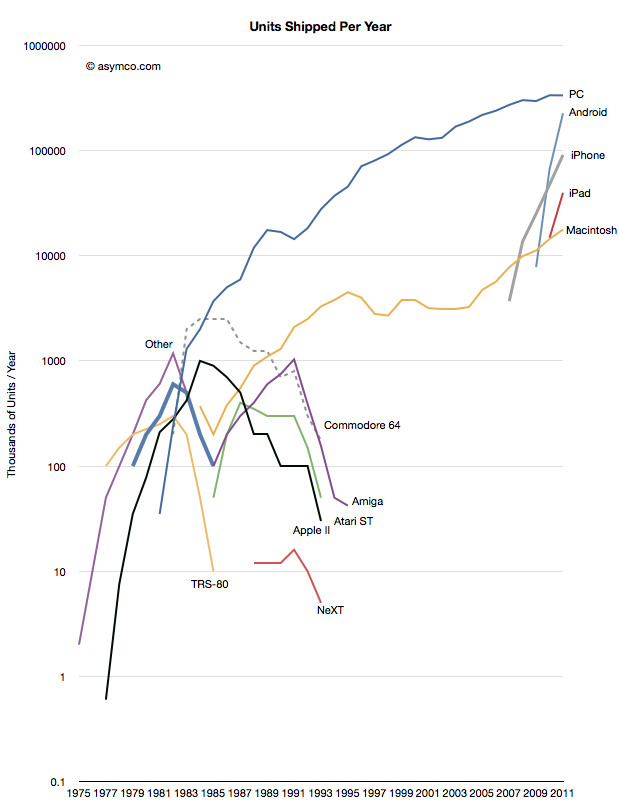
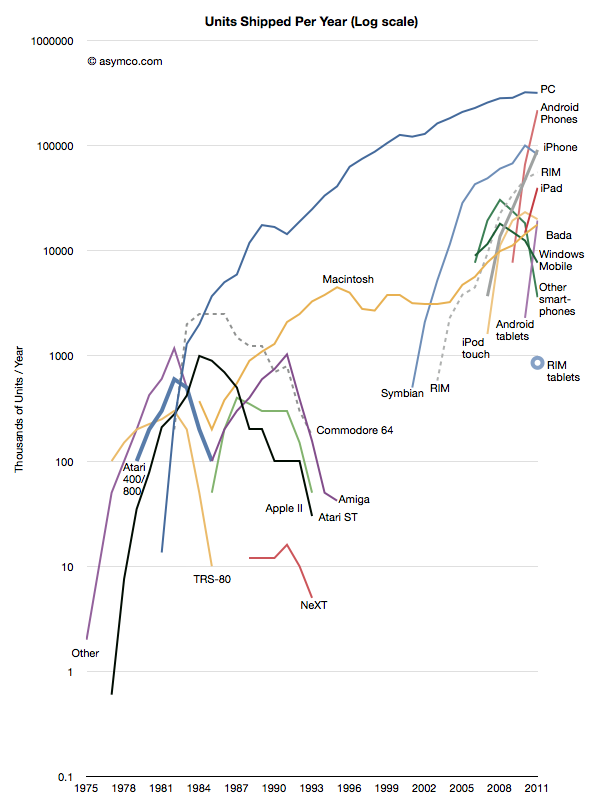
    Thanks to Jeremy Reimer I was able to create the following view into the history of computer platforms.

    I  added data from the smartphone industry, Apple and updated the PC industry figures with those from Gartner. Note the log scale.

    The same information is available as an animation in the following video (Music by Nora Tagle):

    httpv://www.youtube.com/watch?v=8h-C6u4yLj4

    This data combines several "categories" of products and is not complete in that not all mobile phone platforms are represented. However, the zooming out  offers several possible observations into the state of the "personal computing" world as of today.

    1. We cannot consider the iPad as a "niche". The absolute volume of units sold after less than two years is enough to place it within an order of magnitude of all PCs sold. We can also observe that it has a higher trajectory than the iPhone which became a disruptive force in itself. Compare these challengers to NeXT in 1991.
    2. The "entrants" into personal computing, the iPad, iPhone and Android, have a combined volume that is higher than the PCs sold in the same period (358 million estimated iOS+Android vs. 336 million PCs excluding Macs in 2011.) The growth rate and the scale itself combine to make the entrants impossible to ignore.
    3. There is a distinct grouping of platform options into three phases or eras. The first lasting from 1975 to 1991 was an era of rapid growth but also of multiple standards and experiments. It was typical of an industry in emergence. The personalization of computing brought about a new set of entrants. The second phase lasted between 1991 and 2007 and was characterized by a near monopoly of Microsoft, but, crucially one alternative platform did survive. The third phase can be seen as starting five years ago with the emergence of the iPhone and its derivatives. It has similarities to the first phase.

    We can also look at the data through a slightly different view: market share. Share is a bit more subjective because we need to combine products in ways that are considered comparable (or competing).

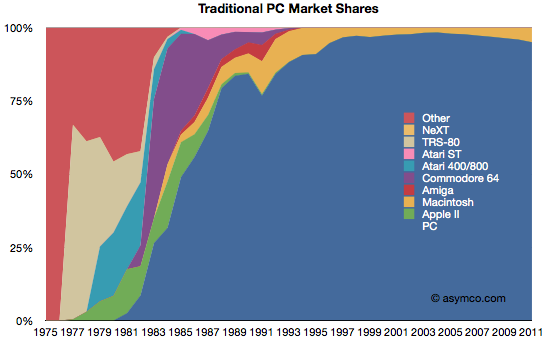
    First, this is a "traditionalist" view of the PC market as defined by Gartner and IDC, and excluding tablets and smartphones.

    This view would imply that the PC market is not changing in any substantial way. Although the Mac platform is gaining share, there is no significant erosion in the power of the incumbent.

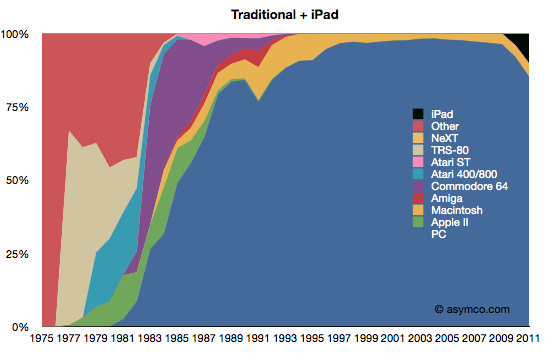
    Second, is a view where the iPad is added to the traditionalist view.

    This view is more alarming. Given the first chart, in order for the iPad to be significant, it would need to be "visible" for a market that already ships over 350 million units. And there it is. If counted, the iPad begins to show the first disruption in the status quo since 1991.

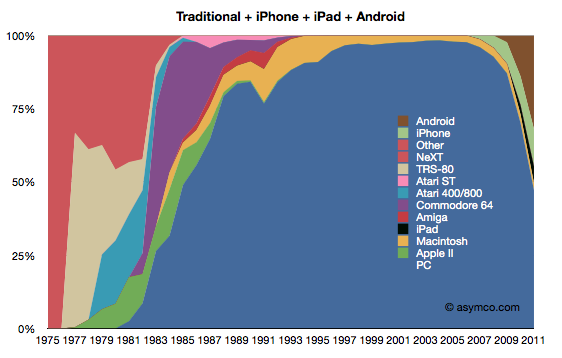
    The third view is with the addition of iPhone and Android.

    This last view corresponds to the data in the first graph (line chart). If iOS and Android are added as potential substitutions for personal computing, the share of PCs suddenly collapses to less than 50%. It also suggests much more collapse to come.

    I will concede that this last view is extremist. It does not reflect a competition that exists in real life. However, I put this data together to show a historic pattern. Sometimes extremism is a better point of view than conservatism. Ignoring this view is very harmful as these not-good-enough computers will surely get better. A competitor that has no strategy to deal with this shift is likely to suffer the fate of those companies in the left side of the chart. Treating the first share chart as reality is surely much more dangerous than contemplating the third.

    I've used anecdotes in the past to tell the story of the disruptive shift in the fortunes of computing incumbents and entrants. I've also shown how the entry of smart devices has disrupted the telecom world and caused a transfer of wealth away from the old guard.

    The data shown here frames these anecdotes. The data is not the whole story but it solidifies what should be an intuition.

    [Update]

    Additional platforms added to the first chart.


  7. Apple as top personal computer vendor

    Research · 127 comments

    "Yes. I think it’s possible if you integrate tablets"

    - Meg Whitman, HP CEO in response to the question of whether Apple could overtake HP in computer sales in 2012.

    via HP CEO Meg Whitman Admits Apple Could Surpass HP in 2012 | MacTrast.

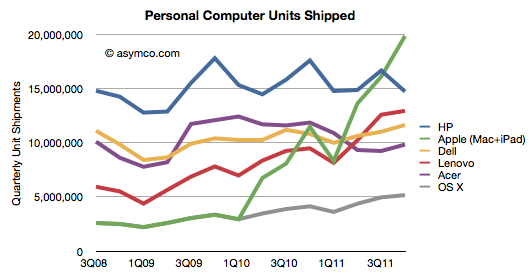
    However, according to Gartner, HP shipped 14.7 million PCs in the last quarter. While we don't have the total global figure for Apple, my estimates are 5.2 million Macs and 14.7 million iPads, for a total of 19.9 million computers in the same period.

    There might be an error in both Gartner's and my numbers, but the gap of over five million in Apple's favor is unlikely to disappear.

    The history of shipments from these vendors  is shown below.

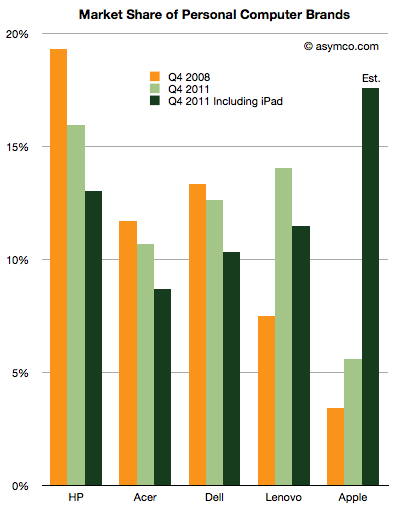
    The market shares are also shown here:

    I included the market shares thee years ago, and the rankings with the iPad excluded.[1] Apple went from 3.42% share at the end of 2008 to 5.6% share today excluding the iPad or 17.6% including the iPad. HP went from 19.3% in 2008 to 16% today or 13% if iPad is included.

    Apple is ahead of schedule on their taking[2] the top spot in terms of units.

    Notes:

    1. Although vendors other than Apple also sell tablets, their totals are unpublished and I am not aware of any estimates so. If anyone has seen estimates I would be happy to amend the data.
    2. Throughout the history of the industry, Apple never held the top spot.   The Apple II peaked at 15.8% in 1984 and the Mac at 12% in 1992.
  8. Is the iPad a PC?

    Research · 114 comments

    Gartner published its estimates for "PC" shipments during the fourth quarter. As I've done in the past, I combined their estimates with known shipments from Apple and separated Apple's performance from the Windows-based market.

    I also take into consideration the iPad as a potential competitor for computing purchases. Apple will report fourth quarter results including Mac and iPad shipments in less than two weeks but I am using my own estimates until then.

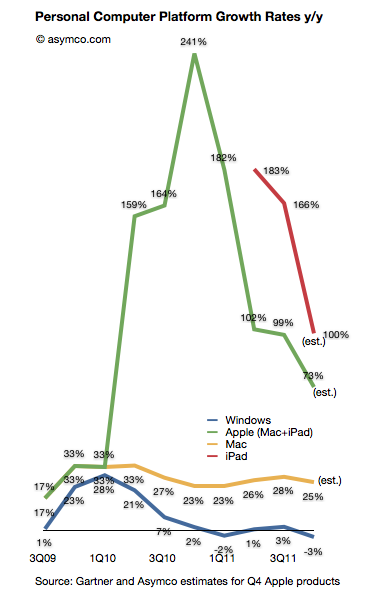
    Here is how the platforms grew over the last few quarters (all figures are global):

    The Gartner data implies a 3% decline in the size of the Windows PC market during the last quarter. This is the fourth quarter of disappointing Windows performance. If you observe the pattern for the Mac vis-a-vis  Windows there is a similarity in the overall cycle but a divergence in terms of growth. The "spread" between Windows and Mac OS X is increasing and has reached an all-time high of 28 points.

    But the more interesting story is that the decline in Windows seems to be coincident with the growth in the iPad. The green (Mac + iPad) shows the effect of the new category while the red line (iPad only) shows that growth in isolation (year-on-year).

    Coincidence?

    Ever since the iPad launched the hypothesis that it has an impact on PC has been hanging in the air. Most analysts (including Gartner) argued that there was no effect from iPad and that the problems with Windows were all due to one-time circumstances. We hear the same about the last quarter with floods in Thailand being blamed.

    However, in the latest quarter Gartner began suggesting that "consumers' attention was diverted toward other product categories, especially smartphones and media tablets."

    One wonders if these "media tablets" are not PCs and yet they negatively affect the purchase of PCs whether they are indeed competing with PCs.

  9. Enter, Prise

    Research · 80 comments

    Historically, Apple's sales to business and government buyers of personal computers have been, in a word, minuscule. To put a number on it, Forrester published data where the estimated value of those sales in 2007 were 2.8%. A figure lower than Apple's overall market share of PCs in that time frame.

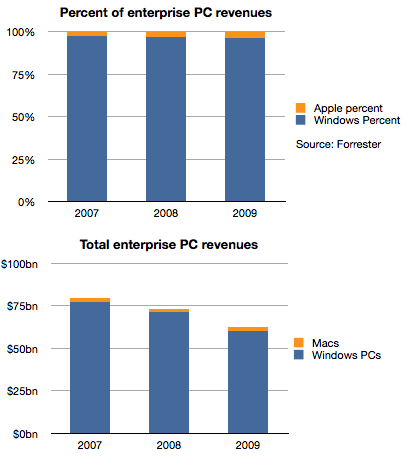
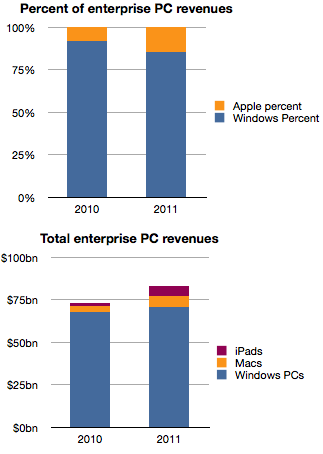
    Things did not improve much in the years following. The following chart shows the split between Windows and Mac OS X for the value of enterprise computers sold in 2007 through 2009.

    Apple's share of value went from 2.8% to 3.7%, an increase of 1 point of share, but one which in real terms was not very valuable because the overall market declined due to recession. Revenues for Apple were basically flat at around $2 billion each year as shown in the second chart.

    However, the situation changed very rapidly in the last two years.

    Apple's share of enterprise revenues doubled from 3.7% to 7.8% in 2010 and nearly doubled again to 14.6% last year. A large part of that acceleration was due to the iPad which generated an estimated 6 billion in sales in 2011, triple what Macs were grossing in 2007.

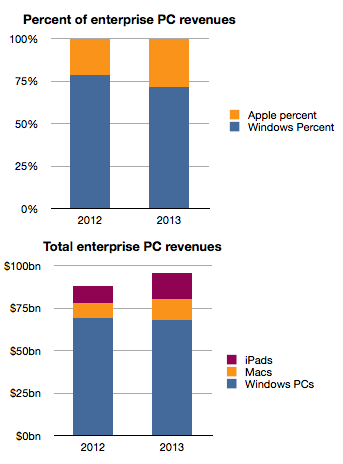
    Forrester goes further and estimates the same data for the next two years.

    The estimate seems to be an extrapolation of the last two years which may or may not happen and we should treat it with caution.

    However, if the pattern emerges as an extension of the near past, Apple's position in the market at nearly 30% share next year would be a sea change. It may challenge for the top spot among all vendors to the sector.

    It's been said many times that "if only Apple put more emphasis" on Enterprise sales, imagine how much more growth they would obtain. However, I believe that this reversal of fortune did not come about from paying more attention but rather from paying less attention to Enterprise.

    Enterprise buyers are demanding customers. They have highly specific requirements and ask vendors to conform to multiple layers of dependencies. As a result, enterprise vendors (led by Microsoft) have done all they could to make their software and hardware conformable to these needs. For decades this was the modus operandi and, due to the early adopter nature of businesses in personal computing, the resulting product was passed on to consumers as the "standard". Consumers accepted it as it was better than having no computers at all.

    The problem is that customers, especially demanding ones, don't realize that a new basis of performance might be more beneficial. Apple and mobile devices in general presented this "low-end" alternative not in response to requirements from business but in response to requirements from consumers who had been much more eager in the last decade to adopt new technologies with fewer strings attached. All the security, conformability and legacy issues of the early business adopters turned them into late adopters as technology shifted.

    So a company focused on an asymmetric market led with new solutions to problems that enterprises did not think they had. Mobility was something few IT managers asked for and was granted begrudgingly to only those "most valuable" who needed it due to cost and security considerations. As Apple willfully ignored these Enterprise needs it, paradoxically, created exactly what they needed.

    It pried entry into the most difficult of markets by not even wanting to enter.

    In thinking about how this market will evolve, I hear about "consumerization" and cost reduction as benefits and justification of this shift. But fundamentally, what is happening is a classic low end disruption. Enterprises increased their demands beyond what the users in those enterprises could absorb. Instead of ultra-secure, locked-down and immobile computing, users were looking for flexibility, agility and mobility. That's what Apple was listening to.

    Apple's best strategy today would be to persist on this trajectory and listen to the under-served consumer rather than the over-served and over-demanding IT manager.

  10. The effect of smartphone growth on share prices

    Research · 17 comments

    Data on Q4 performance is starting to trickle in. Last week Motorola, as part of a profit warning, revealed their Q4 smartphone shipments were 5.3 million. RIM had reported 14.1 million units (quarter ending November). HTC has also warned that their shipments of smartphones (and tablets) totaled 10 million. Samsung provided guidance on overall sales but since they don't report data on smartphone (or phone) sales, the estimates are ranging between 32 and 35 million.

    Many have forecast Apple's performance but there are many other companies which are not easily estimated (Sony Ericsson, LG, Nokia, ZTE, Others.) But rather than dwelling on the specific quarter, we can make some long-range estimates of performance based on the historic data.

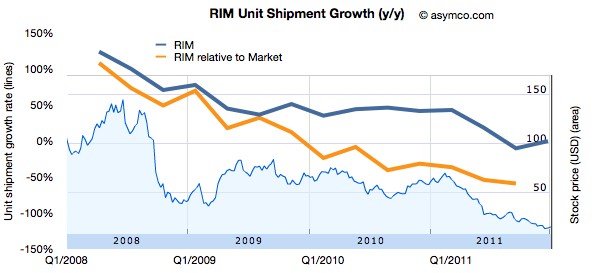
    One method I use is to look at patterns of growth. Growth is the first derivative of market performance and it sometimes shows patterns which the performance itself does not. Consider the following chart showing the growth pattern for RIM.

    The blue line shows the absolute year-on-year quarterly growth based on reported numbers of smartphones shipped. I've also shown the growth "relative to market" which is unit growth with market growth subtracted. This orange line represents how much faster (or slower) the company is growing relative to the market. If the orange line is above zero, the company gained share. If it's below zero, it lost share.

    I also overlaid the performance of the share price (right scale).

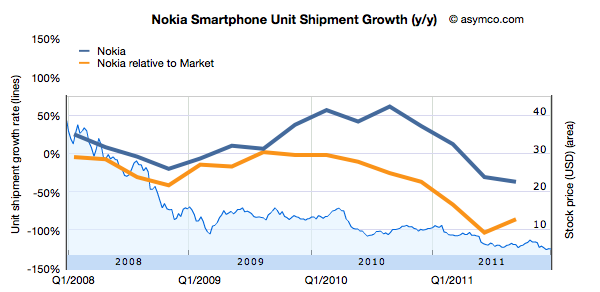
    Now compare that with another long-term incumbent in the smartphone market, Nokia. 

    Bearing in mind that the scales are identical, Nokia's relative performance has been negative since early 2008. Persistent negative smartphone performance relative to market growth causes persistent loss in share price.

    What about other, more recent competitors?

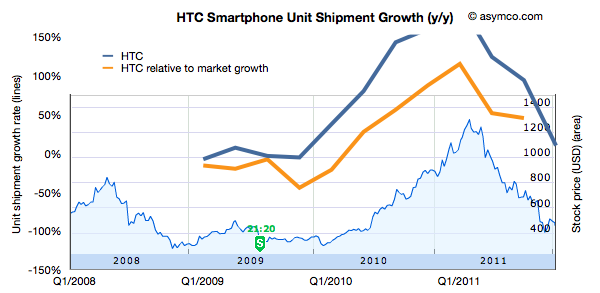
    HTC is not a recent entrant in smartphones, and has gone through a phase of growth with Windows Mobile in the 2000's. This is its pattern of growth (and its share price).

    Keeping the scale for growth consistent with the other companies leads to a bit of clipping but the pattern of rise and fall also seems correlated to share price performance.

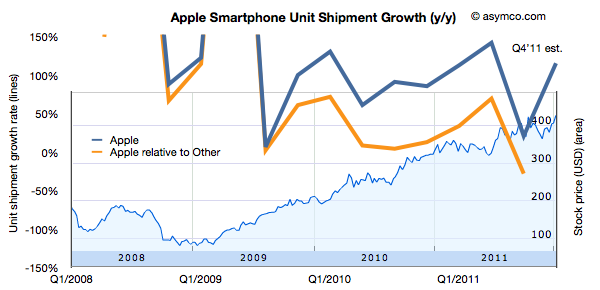
    Finally, the following is the same analysis applied Apple.

    Again, keeping the growth scale consistent leads to some clipping, but the pattern remains observable.

    What seems to be rewarded to various degrees is consistency in growth of smartphones for companies which are primarily engaged in the market. However, failure to grow is punished with severe share price declines.

    Being able to forecast smartphone growth seems to be useful, at least in the time frame of one or two years.