Asymco

Asymmetric Intelligence

Research

  1. Summary view of Apple's income statement [Updated]

    Research · 22 comments

    Since reporting on the 18th, I've mostly finished going over the the fourth quarter Apple data. Here is a quick summary of the articles that covered the financial and product performance:

    SubjectArticle
    CashHaving added $20 billion last year, Apple’s cash growth suggests total could top $100 billion next year
    GrowthApple’s Growth Scorecard: 63% average earnings growth over 16 quarters
    iPhone pricingThe end of exclusivity doesn’t change the price operators pay for the iPhone
    Sales by product65% of Apple’s sales came from iOS powered devices
    Next quarter’s estimatesEstimates for Apple’s second quarter earnings (ending March)
    Share price/valuationIs Apple a candidate for acquisition?
    Margins and platform mix of profitiOS enables 71% of Apple’s profits. Platform products power 93% of gross margin
    CannibalizationiPhone and iPad: Fine Young Cannibals?
    Operational Expenses$76 billion a year from a tableful of products

    That leaves one more: Summary view of cash flows.

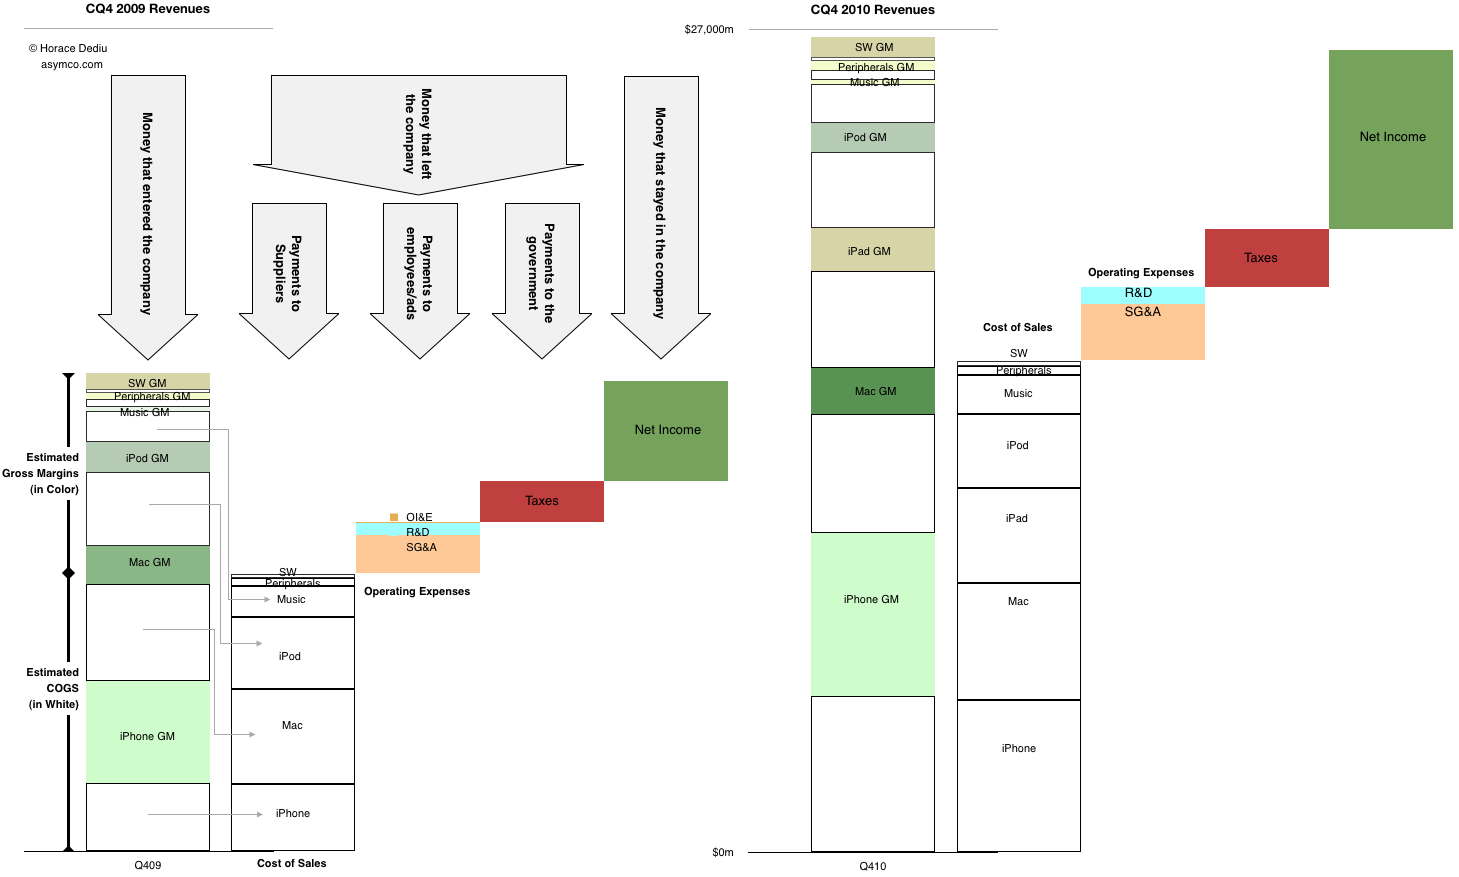
    After introducing it last quarter, this is a chart that I'm trying to improve and use as a single snapshot of growth, product mix, profitability, cost structure and overall sales. The purist in me likes to see the chart clean but it can be a puzzle to some.  So for the sake of explanation, this time I've added some annotations to the year-ago quarter.

    The left half shows flows in the same quarter a year ago and the right side shows the flows in the fourth quarter just ended December 2010. You can see where sales came from, how much of each product's sales went to suppliers and how much was available to pay employees (and who got what). You can also see how much was paid in taxes and what was retained.

    Please click on the figure (requires no scrolling when viewed on screens wider than 1464 pixels).
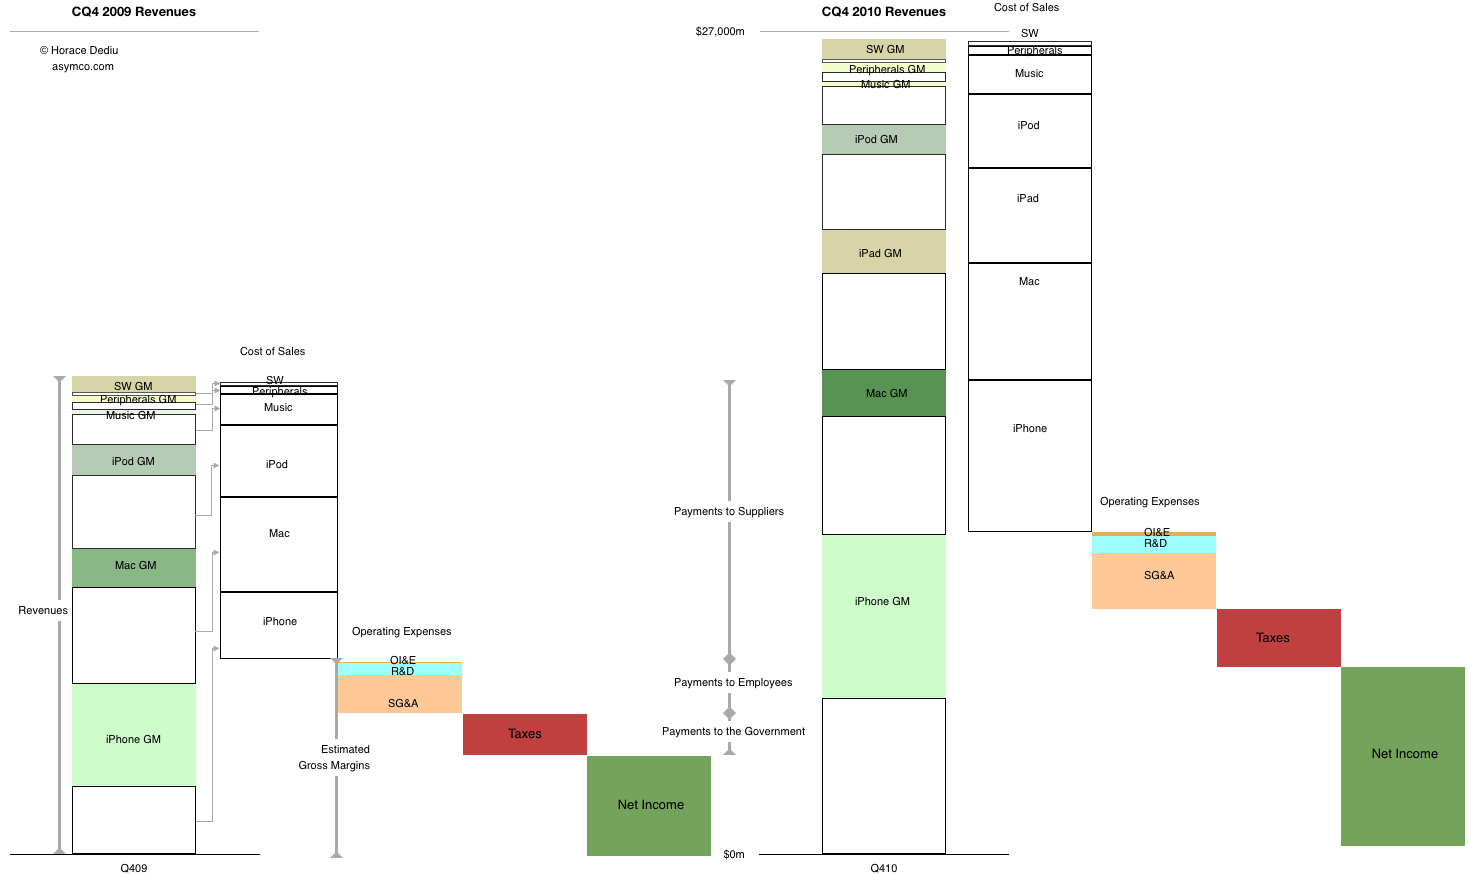
    [Update] Alternate view using "waterfall".
  2. Samsung was the fastest growing major smartphone vendor

    Research · 22 comments

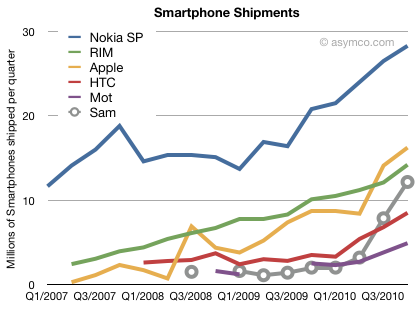
    The smartphone market grew 73% in Q4. Here are the growth rates for vendors which regularly report smartphone sales:

    • HTC: 142%
    • Motorola: 96%
    • Apple: 86%
    • RIM: 40.5% (period ending November)
    • Nokia: 36%

    Samsung is not consistent in reporting smartphones and we don't have year-ago data but the following chart can be used to get a hint.

    Samsung had a very good year with 25.2 million smartphones sold. This is compared to 2009 when they probably sold less than 5 million. Their growth has meant they overtook both Motorola and HTC and are likely to overtake RIM this year.

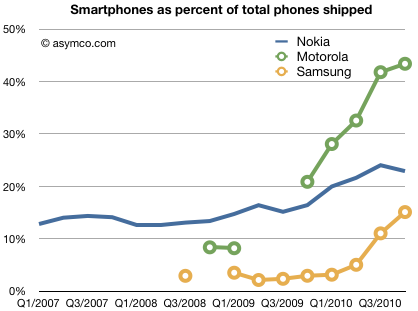
    Samsung owes its success mainly to adopting Android. As can be seen in the next chart, Samsung moved rapidly to shift its portfolio from non-smart to smart. This is quite a feat considering the starting point well below that of Nokia.

    From 2% of total phones to 15% smartphone volumes in 18 months is astonishing.

    Extrapolating for the missing data leads to an estimate of smartphone growth for Samsung of over 500%.

  3. Mobile phone vendor share update. Biggest winner: Other

    Research · 13 comments

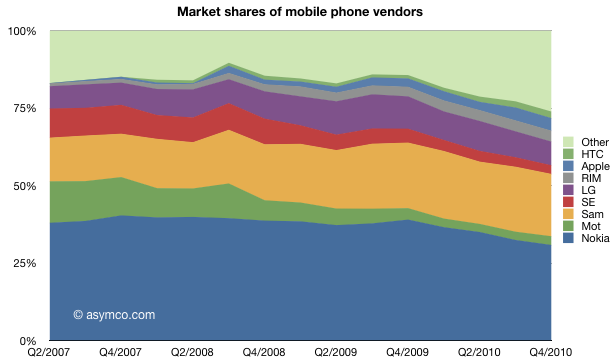
    Biggest share winner: Other.

    The trend toward ZTE, Huawei and others taking volume share from the traditional incumbents continues. Smartphones continue to capture value share. Dedicated smartphone vendors HTC, RIM and Apple would make up the third biggest single vendor, starting from a very small base.

    Looking over this three and a half year period, the change in the market is quite dramatic.

  4. Predictions on Nokia's new platform strategy: new OS for the US

    Research · 60 comments

    Nokia must compete on an ecosystem to ecosystem basis.

    In addition to great device experiences we must build, capitalize and/or join a competitive ecosystem. The ecosystem approach we select must be comprehensive and cover a wide range of utilities and services that customers expect today and anticipate in the future.

    Nokia CEO Discusses Q4 2010 Results - Earnings Call Transcript - Seeking Alpha

    These kind of statements are signaling that there will be fundamental changes announced.

    Here are my guesses for the February 11 announcement:

    1. There will be a multiple OS strategy
    2. The US market will be the first to see a new non-Nokia OS. I would guess Windows Phone with AT&T.
    3. Low end devices will remain with Symbian due to price considerations for the chipsets, components.
    4. MeeGo will be phased out in phone products but development will continue for tablets

    This may seem like a radical departure, but in many ways it's not. Nokia has nothing to lose in the US as its platforms have zero traction. By maintaining Symbian for low end devices, they can still aim for differentiation where Nokia feels it still has distribution and cost leverage. This strategy will also allow speed in time to market.

  5. $76 billion a year from a tableful of products

    Research · 60 comments

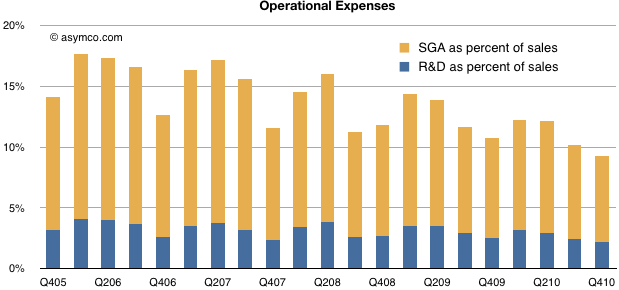
    During the calendar year 2010 Apple spent nearly $2 billion in R&D. That is a significant increase from $714 million in 2006. However, as a percent of sales, R&D spending has decreased. Sales have grown more rapidly than resources hired to develop the products (or to sell them).

    In Q4 2005 Operational Expenses (costs which are not tied directly to units of production--sometimes called fixed costs) were 14.2% of sales. In the last quarter of 2010, the ratio was 9.2%. Sales and administrative expenses (which include advertising, promotion and overhead) were 7.1% and R&D (which includes all engineering, testing) were 2.2%. As percent of sales both reached new lows.

    The efficiency with which Apple creates sales is legendary. There can be many explanations for this but the most telling evidence of causality I can find is the small number of products in the portfolio. Tim Cook stated that given the sales value, there is more concentration of product at Apple than at any other company except perhaps an oil company. All the products Apple sells can fit on one average sized kitchen table and they generated $76 billion in sales last year.

    How is this possible? First, a few words about the often misunderstood process of product development.

    Most observers of technology are not aware of the pace of its development. It's natural to assume that most R&D costs are in the product creation, or early phases of development. Coming up with something new must be hard. But that's not actually true. Most R&D work is routine polishing of products and coordination late in the development cycle. "Productization" is far more resource intensive than "concepting".

    It stands to reason that making go/no-go decisions early in the pipeline is a lot less expensive than making stop-ship decisions prior to launch.

    I have no specific evidence that this is the case, but I guess Apple conceives of plenty of concepts, but chooses to move forward to develop and market very few. Most companies don't have the ability to decide early which products to launch and instead proceed with costly R&D and marketing in order to find out whether products will "work" in the marketplace. The proliferation of flawed products is a big cause of the inefficiency of product development.

    But launching flawed products is also detrimental to brand value, something which rarely hits the books and is thus invisible to operational managers.

    This uncanny ability to pick winners early in a long gestation period is my guess for why Apple is so efficient with OpEx. The question of how to develop this ability is left for another day.

  6. Canalys calls it on PCs

    Research · 47 comments

    ‘Any argument that a pad is not a PC is simply out of sync,’ said Chiam. ‘With screen sizes of seven inches or above, ample processing power, and a growing number of applications, pads offer a computing experience comparable to netbooks. They compete for the same customers and will happily coexist. As with smart phones, some users will require a physical keyboard, while others will do without.’

    ‘Each new product category typically causes a significant shift in market shares,’ said Chiam. ‘Apple is benefiting from pads, just as Acer, Samsung and Asus previously did with netbooks. The PC industry has always evolved this way, starting when Toshiba and Compaq rode high on the original notebook wave.’

    via Canalys reports global PC market growth of 19% in Q4 2010 (Canalys research release: r2011012).

    Five years ago, back when Gartner and IDC were confused about what a smartphone was Canalys was on top of the market and was the first to correctly describe the smartphone.

    Kudos for being first again to recognize a re-defined market.

  7. iPhone and iPad: Fine Young Cannibals?

    Research · 35 comments

    The iPad and iPhone came, saw and conquered new markets. But since the products launched the question on every analyst's mind has been on how much have these products "cannibalized" their brethren the iPod and the Mac.

    This notion of "cannibalization" applies when a product is designed to compete and "eat" the share of another product in a company's portfolio. It has some negative connotations since it implies loss but many times the thinking is that it's better to cannibalize oneself rather than have it done by a competitor.

    But have iPhone and iPad taken share from their competitors?

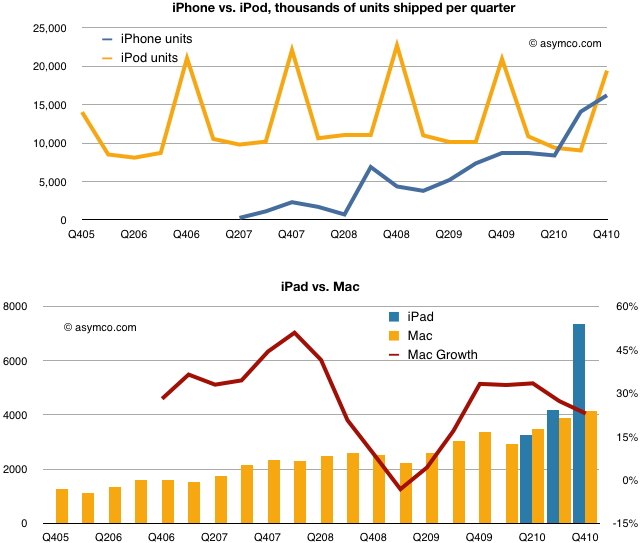
    The following charts compare the total units of iPhones vs. iPods and iPads and iPads vs. Macs.

    The evidence does not show cannibalization.

    Although both iPhone and iPad have crossed over and are selling more units than their internal competitors, the old guard has not faded away.

    Indeed, the Mac shows resilience and the iPod, although not growing in units has maintained sales value. What we don't see is a clear gain for the entrants at the expense of the incumbents.

    We can't be sure how long this happy co-habitation will last, but for now the new products are fine and young but not cannibals.

  8. Hyvä Suomi! O Canada!

    Research · 31 comments

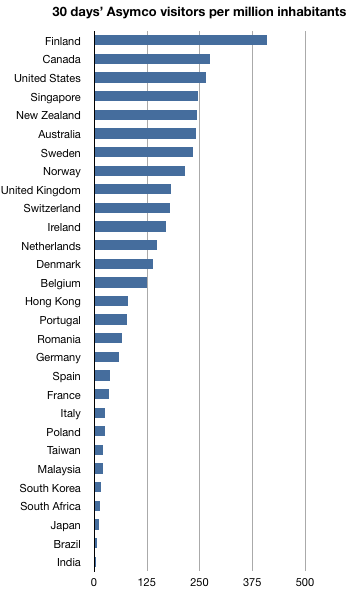
    When looking at unique visitors as a proportion of population, this site is more popular in Finland and Canada than in the United States.

    Very impressed with Singapore and New Zealand who punch above their weight. UK is second in overall volume. Honorable mention to Australia, Sweden, Norway and Switzerland.

    It's interesting to compare this list with Newsweek's ranking of the world's best countries.

    1. Finland
    2. Switzerland
    3. Sweden
    4. Australia
    5. Luxembourg
    6. Norway
    7. Canada
    8. Netherlands
    9. Japan
    10. Denmark
    11. United States
    12. Germany
    13. New Zealand
    14. United Kingtom

    The correlation is uncanny.

  9. iOS enables 71% of Apple's profits. Platform products power 93% of gross margin

    Research · 17 comments

    As the highly profitable iPhone makes up an increasingly larger proportion of Apple's sales, the overall gross margin would be expected to grow.

    Sure enough that's what's been happening.

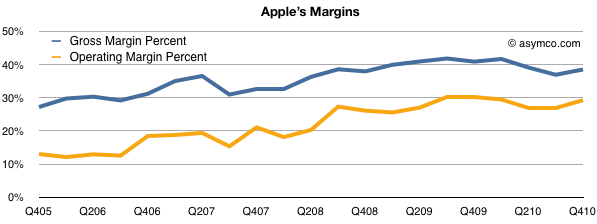
    The gross margin percent, which measures the direct or variable costs of production vs. price, shows a healthy rise in the last five years from slightly below 30% to around 40%. The Operating Margin, which also includes the overhead or fixed costs like R&D and SG&A, shows a similar rise, reaching about 30%.

    Margin expansion while sales quadruple is a good indicator that a company is producing real value not just trading sales volume for profit.

    Focusing attention on individual product lines, it's clear that the iPhone is the largest component of sales and of profits. We don't have specific product line-item gross margins from management, but we can estimate a figure for the iPhone by several means.

    First, we can work out roughly what every other product line's margin is due to their longer histories. (Mac and iPod have reliable profitability estimates). What's left can be deduced to make up the iPhone's margin.

    Alternatively, we can get estimates of the bill of materials and add in some of the other direct expenses like manufacturing, warranties, shipping and incidentals to get an estimate of the cost of production.

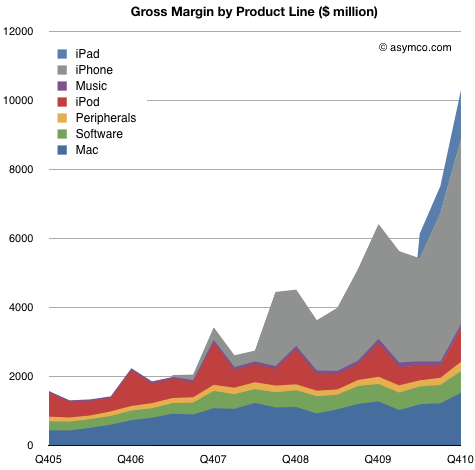
    These methods allow me to guess at a margin for the iPhone of about 50% for the last quarter. Based on these inputs we can plot the gross margins for the entire company's product lines:

    Overall, gross margins have reached over $10.3 billion in the quarter, increasing 543% from five years ago and 61% from a year ago.

    That's great, but by knowing product line profitability we can get a better feel how the company changed strategically.

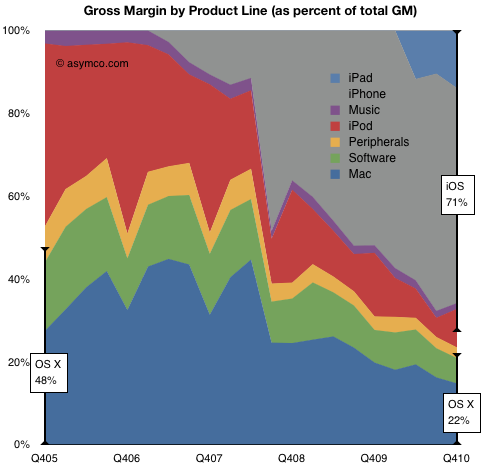
    In the following chart I show the percent of gross profit captured by each product line.

    What we can observe is that at the end of 2005, OS X based products made up nearly half the profits. The rest was mostly the iPod, which was not a software platform product.

    A short five years later, OS X products which, although having grown in volume, made up only 22% of total margin. The rest was mostly iPhone but with significant contributions from iPad and iPod. What's most important to note is that the non-OS X profits are almost all powered by iOS.

    iOS powers about 70% of Apple's current gross profits. Combined with OS X, 93% of profits are from platform products.

    So again the question about Apple being a software, hardware or media company comes back. Perhaps, those categories are not relevant. Perhaps Apple is a platform company.

  10. Is Apple a candidate for acquisition?

    Research · 57 comments

    As shown in the Apple growth scorecard, the company's earnings growth is continuing at 75% with the top line increasing at the annual rate of 70%.

    The $59 billion of cash on the balance sheet has reached the equivalent of $64 per share yielding an enterprise value of $263 per share based on closing price of January 21st.

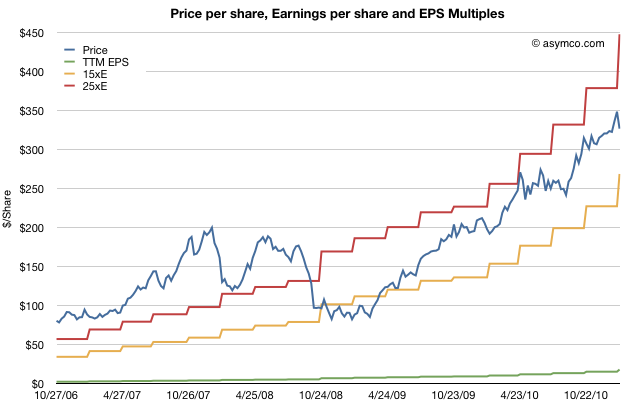
    The stock price has been rising but not outside a narrow P/E band. The following chart shows the stock price and the 15 P/E and 25 P/E bands that have bounded it for nearly three years.

    As previously observed, this overall share appreciation is not accounting for the growth in earnings.

    The trailing twelve months' earnings were $17.91 per share. Therefore the P/E ratio is now 18.2. Excluding cash, the P/E is at 14.7. However, that's based on 2010 levels of earnings. Those earnings are increasing very quickly.

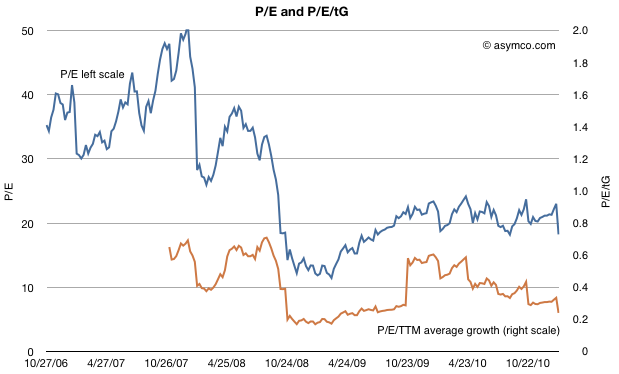
    To account for earnings and their growth, I developed the following chart which shows the P/E and P/E/trailing-Growth for the stock.

    The P/E is fluctuating on either side of 20 but when considering trailing growth, comparable companies, the macroeconomic conditions and guidance the value of the company is reaching new lows.

    P/E/tG nearing recession lows

    Earnings were 75% higher in 2010 than the year before. So based on the growth, the rule-of-thumb ratio P/E/trailing Growth (P/E/tG) is 0.24. This ratio (where 1.0 is seen as "fair value") is the lowest since July 2009, during the first months of recession recovery. The trend for this ratio is down (see the burnt orange line in the chart above). It's not far from hitting the lowest point during the recession at 0.17.

    Now I'd like to reminisce a bit about that point in time. The stock had bottomed at $78/share[1]. It was trading at barely 3x cash and a P/E of 11 but growing 3x that level (32% in the slowest recession quarter but averaging much higher).

    So today we are at a similar point in valuation. The cash is at $64/share, shares are priced 5x that amount and the growth is 4x P/E[2]. Although analyst targets are less comical, there is still the sense of extreme despondency when looking at the valuation ratios.

    Guidance, Comparables and Macroeconomics

    Unlike two years ago there aren't the same dark clouds on the macro horizon. The company is also not as cautious on its guidance (guiding 63% EPS growth must be a new record for a post-holiday quarter) and there is talk of bubble in valuation for comparable companies. Netflix, Amazon, and ARM have eye-watering valuations relative to growth.

    A discount to the S&P 500

    And to round out the tragic tale, Apple's P/E is, once again, at a discount to the S&P 500 P/E (14.7 vs. 16.57 respectively).

    Given the new low in valuation contrasted with optimism on behalf of many (including management), on some forums there is discussion about Apple becoming the target for a take-over.

    There is some perverse merit to this logic. With $64 in cash, $25/yr in earnings and 75% growth it's so cheap that if credit were available, it would make a tempting candidate. Private equity could take it private and use the gigantic cash flow to pay off debt (in about four years). In bygone days, this would have been an easy pitch.

    Alas, the capital markets may not have liquidity for the size of the market cap Apple holds and I don't see any competitors able to get the leverage for an acquisition either. Or can they?

    ---

    Notes:

    1. In early summer 2009 some analysts put 12 month targets for the stock at $70, so their predictions were within $6/share to today's book value.
    2. A buyer of shares two years ago would only have to wait two years to have 80% of their investment sitting in retained earnings.  An investor who read the data from Apple and knew that the iPhone existed could not fail but be amazed.
  11. How does the Mac gain share while increasing its price premium over the Windows PC?

    Research · 54 comments

    Apple set a new record for Mac sales in the fourth quarter. This was not a surprise. The growth was perhaps a bit lower than some expected (including me) but it was still a healthy 23% and 8x the PC growth rate. The Mac has outgrown the PC (and hence has gained share) for 19 quarters straight, nearly five years.

    What's more interesting is where the growth came from. Every region outgrew the market. Asia-Pacific led with a 67% year-over-year increase, almost 10x the market. Japan grew at 56%, which is about 6x the market, and Europe and the United States both grew in double-digits despite both markets contracting overall.

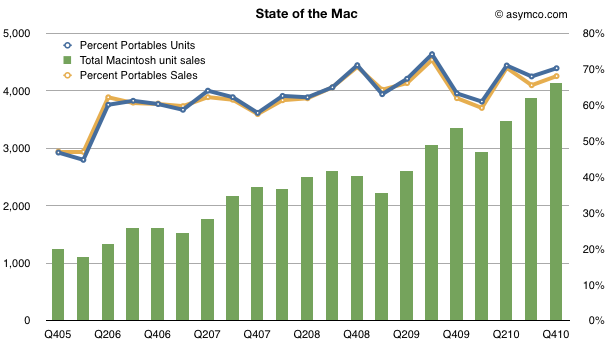
    Looking over a longer time frame, the Mac has nearly quadrupled in volume in five years. In the last quarter of 2005, Apple sold 1.2 million units. In the latest quarter it sold 4.1 million. So the performance has been relatively good.

    One significant reason for the growth has been the shift from desktop to portables. The lines show how the percent of portables went from about 50% to 70% of units and sales in four years.

    [hang1column]

    [/hang1column]

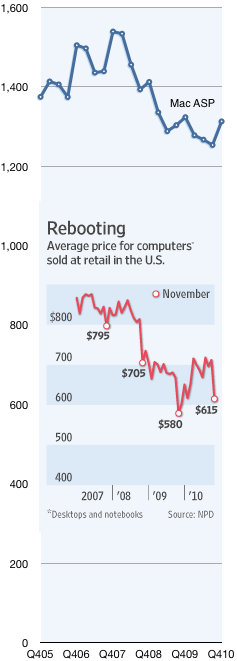
    But what was surprising was that the average selling price increased to $1,313, up from $1,253 and nearly even with last year's $1,324.

    Prices in the PC industry tend to fall. Actually, to be more precise, they tend to collapse. Compare the Mac's price trend with the rest of the industry as seen in the chart to the left[1]. It shows the Mac Average Selling Price which is what Apple books from selling into the channel vs. the retail price of PCs in the US.

    The chart tells a partial story. The PC figures are retail while the Mac figures are wholesale. Furthermore, the PC figures include Mac, so stripping out the Mac would show the PC prices to be even lower. Lastly the Mac figures are global whereas the PC figures are US only.

    But what I want to focus on is not the absolute difference, rather the relative value difference, which is diverging: The average PC went from $795 retail at the end of 2007 to $615 in November 2010. That's a drop of 22%. In the same time frame the Mac went from $1,539 to $1,313 wholesale, a drop of 15%.

    In other words, the Mac price premium at the end of 2007 was at least 93% and it now is at least 114%.

    So here's the real surprise: How does the Mac gain share while increasing its price premium over the PC?

    The only answer I can offer is what I already wrote on the Mac in November:

    ...something changed with PCs when the laptop became “good enough”. With portable computing, the job the PC was hired to do evolved. It was more important that the product be well designed (for aesthetic value, usability and reliability) than just fast and spacious. The microprocessors were plenty fast but what mattered more was low power consumption, a low profile and tighter integration with software.

    In other words, computers became re-integrated. You only need to touch the MacBook Air to understand why.

    ----

    Notes:

    1. The inset chart comes from The Wall Street Journal using data from NPD. The Mac data comes from Apple financial reports.