When I wrote about Android's pursuit of the biggest losers, I made the explicit claim, backed by data, that Android was most attractive to device vendors who were in financial distress. Android is a lifeline to sustain failing business models. But underlying that claim was the more sinister implication that Android is sustaining to the incumbent operator business models. That means that Android is subject to operator manipulation and its market access as well as those of competing platforms will be throttled to maintain control.
The article below makes an even stronger case.
As a result, we now have a situation where the U.S. telecoms are reconsolidating their power and putting customers at a disadvantage. And, their empowering factor is Android. The carriers and handset makers can do anything they want with it. Unfortunately, that now includes loading lots of their own crapware onto these Android devices, using marketing schemes that confuse buyers (see the Samsung Galaxy S), and nickle-and-diming customers with added fees to run certain apps such as tethering, GPS navigation, and mobile video.
I would not say that Android is enabling the consolidation of operator power. I would say that operator power never wavered.
The article concludes:
Despite the ugly truth that Android is enabling the U.S. wireless carriers to exert too much control over the devices and keep the U.S. mobile market in a balkanized state of affairs, Android remains the antithesis of the closed Apple ecosystem that drives the iPhone and so it’s still very attractive to a lot of technologists and business professionals.
But, the consequence of not putting any walls around your product is that both the good guys and the bad guys can do anything they want with it. And for Android, that means that it’s being manipulated, modified, and maimed by companies that care more about preserving their old business models than empowering people with the next great wave of computing devices.
Gartner explicitly explained so in its press release: "Gartner's PC group does not track media tablet sales in this PC shipment data, so iPad sales are not included in these results
The reluctance of industry analysts to measure the iPad as a computer is a fascinating and vivid symptom of how analysts conspire with their customers to smother visibility of impending failure.
Before we dive into the motivation to ignore iPads, we need to understand how analysts in general and companies in particular group products into comparable piles. This process of grouping is called categorization. It should be distinguished from segmentation which groups buyers in a market. Categorization is essential for competitive analysis and measurement of the performance of a product (relative to other products).
Categorization is a challenging problem for most companies. To illustrate why, consider four possible methods for categorizing products:
By product attributes. The assumption here is that products with similar attributes compete in the same market. As an example hard disk drives might be categorized by dimensions of the cases and sub-categorized by capacity and perhaps transfer speeds.
By user attributes. This method is similar to segmentation where products are grouped by the type of buyer. Magazine titles might be properly categorized by the age and gender of the readers. This can also cover geographic data.
By user behavior. This method, sometimes called psychographics is a more advanced method than demographics where user personality, values, attitudes, interests or lifestyles are measured. You might have seen examples where users are defined with a "prototype" person and the products are attached to this prototype. This is a common way to categorize mobile phones (Nokia is a known leader in this method).
By modes of consumption. Determine what products are hired to do the same job. In this case you have to have real insight into what people actually do with their products and try to look broadly at what they substitute. The classic example of this is to understand that a power drill competes with products what make holes in walls not just with other drills.
When reading this list, it's easy to see that it's ranked in order of difficulty. The easiest thing to do is group according to things you can measure easily. Products are easier to measure than demographics which are easer to measure than psychographics and that's easier to capture than observed behavior.
Consider how you would structure a study to capture this data.
In the first case, you need an analyst to collect products (or just their descriptions) and record values in a spreadsheet.
In the second case, users need to be surveyed for basic data. This is hard because you have to find users and then you have to get a statistically significant unbiased sample.
In the psychographic study you need to ask a lot more questions about lifestyle in your survey and hope that the subject answers honestly. You still need a large sample.
In the case of consumption analysis you need to observe a subject use a product for a prolonged period of time in the usual context where the product is used and be able to interject questions when certain behavior is encountered. The observation of one person can take one research person-day per subject. To get statistically significant data requires literally man-years of work.
Now it should be clear why an analyst will only categorize according to product attributes. It's not only economically and temporally expensive to perform research on methods 2 to 4 but it also requires interpretation and insight into study development.
A few companies go beyond buying analyst market data and do their own research. As far as I know user studies are more commonly done by consumer products companies. But it's extremely rare to see this research done by low-margin technology companies. They don't have the budgets or skill sets to do any research.
However, in my experience, nobody performs the fourth, most difficult, form of categorization.
The result is that good, smart managers trained to always base their decisions on hard facts, pick up these lowest-deonominator analyst reports to help decide which products to develop. And it should be obvious why they are surprised when products that did not show up on any market study suddenly take all their profits away.
Once the pride and joy of the world's largest computer systems builder, consumer products now make up just 18% of Dell's total sales. That's probably a good thing in the long run, because this segment is notoriously margin-poor when compared to the less price-sensitive corporate computing market. I can't blame IBM for giving up on consumers years ago, and I think Dell should follow suit.
Step 2: Entrants grow and improve; incumbents choose flight. As disruptive attackers follow their own sustaining trajectories, they make inroads into the low end of the market or begin pulling less demanding customers into a new context of use. What happens when the disruptive entrant begins to make inroads? [...]
Incumbents naturally choose flight. What looks highly attractive to the entrant continues to look relatively unattractive to the incumbent. The asymmetric motivation leads to incumbents naturally fleeing the low end. They cede that market to the entrant. [...]
Remember, incumbents focus on delivering up-market sustaining innovations that allow them to earn premium prices by reaching undershot customers. They view flight as a positive development.
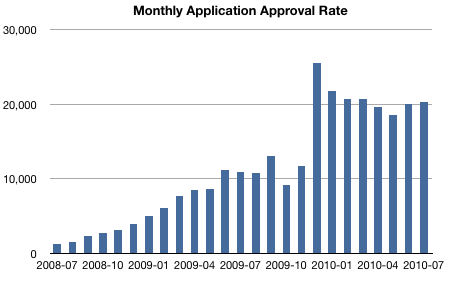
My initial estimate in February for the 200k milestone was by May 1st. I was clearly off by nearly 40 days. If the add rate is maintained at 20k/mo 300k will come around in August although I’m not as confident in this forecast. The rate of app addition seems to be accelerating.
As of today the Approved app counts are as follows:
The monthly rate of addition is shown in the following graph:
The 20k/month has been steady during the last 7 months so I think the last 4k apps will be added in the next week, making the 300k roll-over in August, as forecast. The approval rate did not accelerate however but stayed pretty steady. There was a similar plateau in the middle of last year around 10k apps/month.
LG Doesn't See Return To Operating Profit Until Early Next Year
By Roger Cheng and Jung-Ah Lee Of DOW JONES NEWSWIRES
SEOUL (Dow Jones)--LG Electronics (066570.SE), which readily concedes it is late to the smartphone game, said it plans to launch 10 more smartphones and sell 5 million devices by the end of the year as it scrambles to catch up with the rest of the industry.
But the aggressive move, which includes increasing the research and development budget by a third and ramping up its spending on marketing, means the company's once-flagship mobile devices unit won't likely return to an operating profit until early next year, said Chang Ma, vice president of marketing for the division.
"We have to just bear it," Ma told Dow Jones Newswires on Wednesday, adding that he hopes to see a turnaround after the fourth quarter.
Does it not strike everyone as odd that a company whose business is in the cloud also needs to peddle systems software...even devices?
It's like a philosopher at a conference trying to convince the audience of his idea requiring that they use a certain type of pencil to take notes. And only he can give you that pencil.
This should lead to serious questions: Firstly, maybe you don't need to take notes, secondly perhaps you don't use a pencil and thirdly why his pencil?
Analogously: Firstly, Google services don't need specific devices to be used because they're designed around web standards. Secondly, they don't need specific client software or APIs either and, thirdly, they certainly should not need specific systems software. Like the philosopher, Google does not charge for their pencil, but that's beside the point.
You can only conclude that either the philosopher's is a scoundrel or his idea is not that good.
I did not include all vendors for various good reasons. The first survey (market share) did include an "others" category that made the volume data complete, but in the financial data sets, I chose to include the top 7 vendors that make up 80% of device volumes.
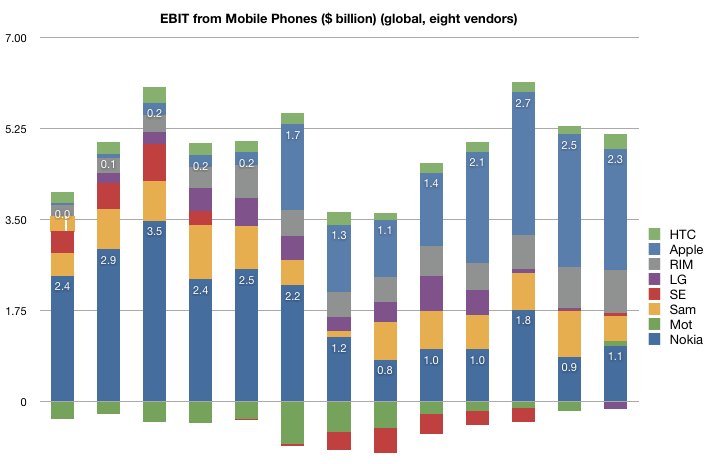
One noteworthy vendor that was not included was HTC. HTC is an important vendor for several reasons:
it's a pioneer in smartphones having made the first Windows Mobile devices and the first Android devices
at one point it sold 80% of all Windows Mobile devices
even if it did not brand its devices, it was the name behind many re-branded or white-label operator branded phones
it has a brand of its own today and is expanding its reach
HTC has been around building devices since 2001 and so it would be a pity to exclude them from any analysis of the effect of iPhone on the market or any discussion on the effect of smartphone disruption on feature phones.
The challenge with HTC was that historically their branded devices and white label devices were not reported by the company separately. This matters because white label devices are valued differently. Typically these devices are not marketed by the original manufacturer so SG&A is not applied to their cost base. Operating margins, ASPs and hence profitability is not directly comparable with other OEMs.
But HTC has recently changed its reporting. Thanks to a reader I discovered that, since 2008, HTC has been listing its ASP and Operating Margin making direct comparisons possible. I still don't have all the data, but enough to add HTC to the analysis.
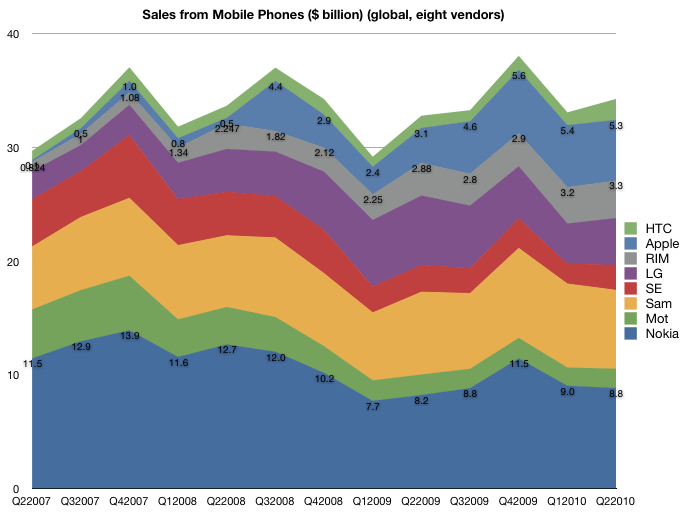
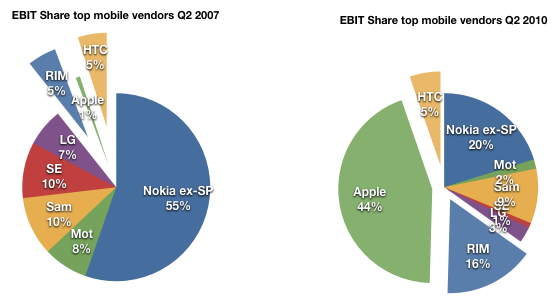
So, here are the 5 industry performance criteria, now with eight vendors listed.
Volumes
Note that HTC volumes start in 2008.
The volume of units HTC sold has been increasing at about the rate of market growth.
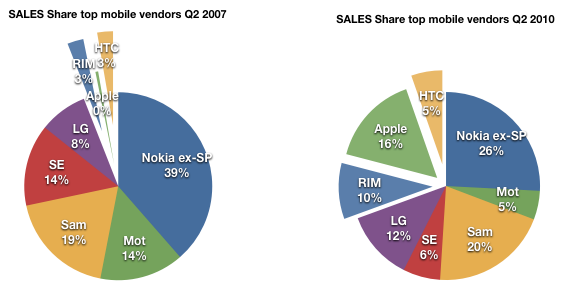
As a result, HTC's share has not increased as dramatically as those of the other smartphone entrants.
Sales
A similar story in the sales picture. Although a consistent performer, the growth has not matched that of RIM and Apple.
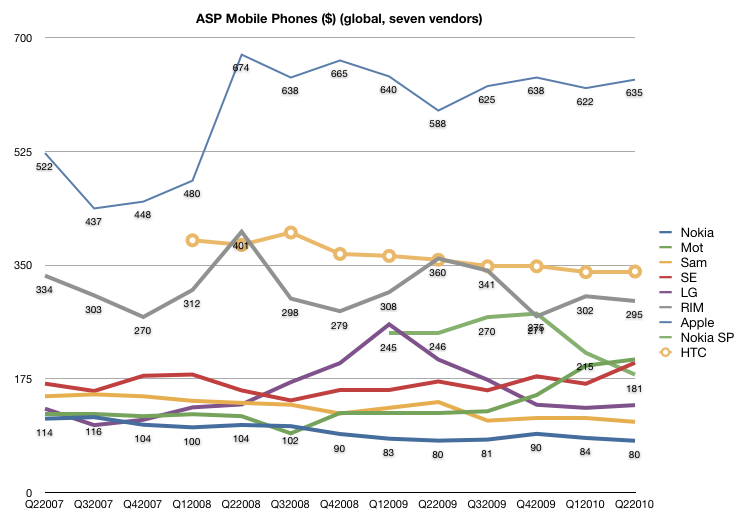
ASP
The pricing story is also a mixed one. Although HTC lies between RIM and Apple in price, the erosion is more consistent with RIM and the rest of the industry.
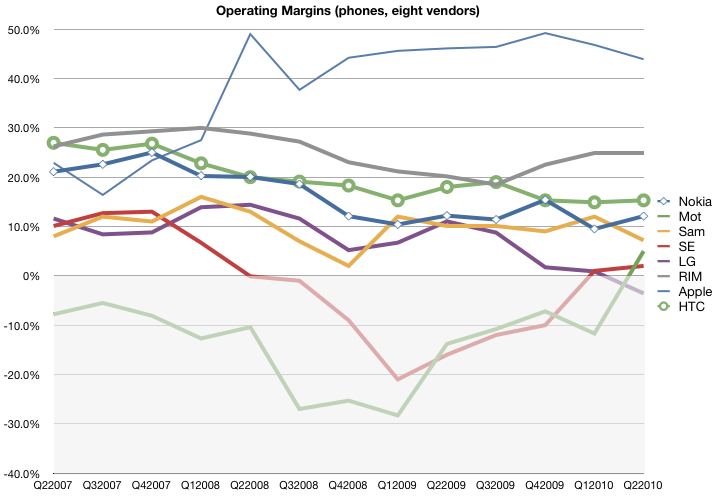
Margin
The margin story is also not as positive as one might expect. The margins for HTC started out above Apple and RIM but have dropped to closer to industry average. This is not what one might expect from an exclusive smartphone vendor.
Earnings
The share of earnings has remained unchanged at 5% over the period of iPhone presence. It's perhaps a credit to HTC that they did maintain their position in the market with the massive change that has come to pass.
However, here we also have to ask if HTC is riding a disruptive wave.
When I wrote the last series, my definition of “loser” was a company that had faced a long series of operating losses and has no viable software assets of its own, making it vulnerable to Android (and Windows Mobile). Motorola first, Sony Ericsson second and LG now coming into the picture. Nokia is not a loser in this sense since it has remained profitable and does maintain an investment in software. Same with RIM and Samsung (now with Bada). When/if they do have the near death experience, they might opt for the Android lifeline (flimsy as it is).
However HTC does not fit the mold of either "winner" or "loser". It's the Goldilocks company, not too hot, not too cold.
But I would add that HTC is not an example of a winner because of its adoption of Android. HTC’s dependence on Windows Mobile made their move to Android the most desperate of all. Unlike the larger OEMs, who had their low end devices to fall back on, they are completely dependent on a smartphone OS vendor. When WinMo was showing the first signs of crisis in 2007, they were the first to flee to Android (think of why they would risk the wrath of Microsoft for something so fragile as Android in 07). They are also trying hard to escape the dependence by building up their own UI (SenseUI) and I would not be surprised if they move to their own OS in the future. Being associated with Android does not confirm them as "winners" but in fact, shows their vulnerability.
What does this all say about Android?
Again here my thesis is that Google chose to sustain the industry rather than try to upend it. I don't judge their motives, but the fact is that with Android, Google is not in a position to disrupt telecom. There were high hopes dashed with the Nexus One and hearts broken with net neutrality and now there are patent wars to be fought. Android, with its licensees, is still at the mercy of operators.
The mobile phone market is intertwined with the telecommunications industry which is vast and there are numerous competitors which are much more dynamic and better capitalized than the moribund PC or music player vendors. It’s also a regulated and fragmented global market with 1.2 billion units and 5 billion consumers—far greater than any of the markets Apple played in for its first 30 years.
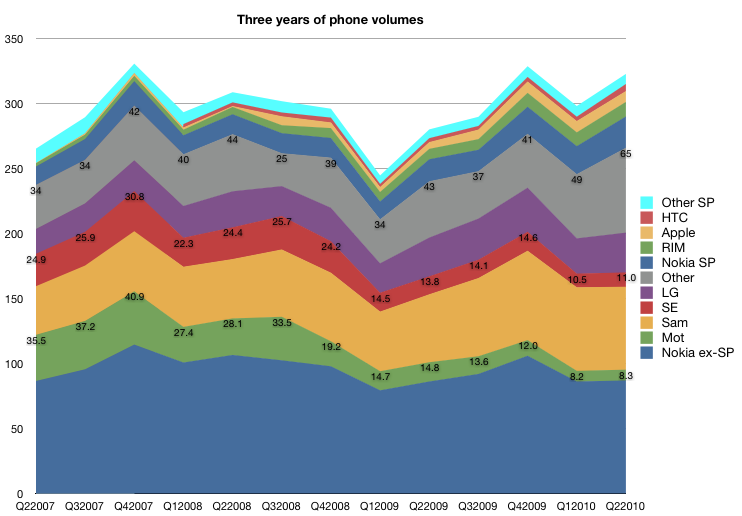
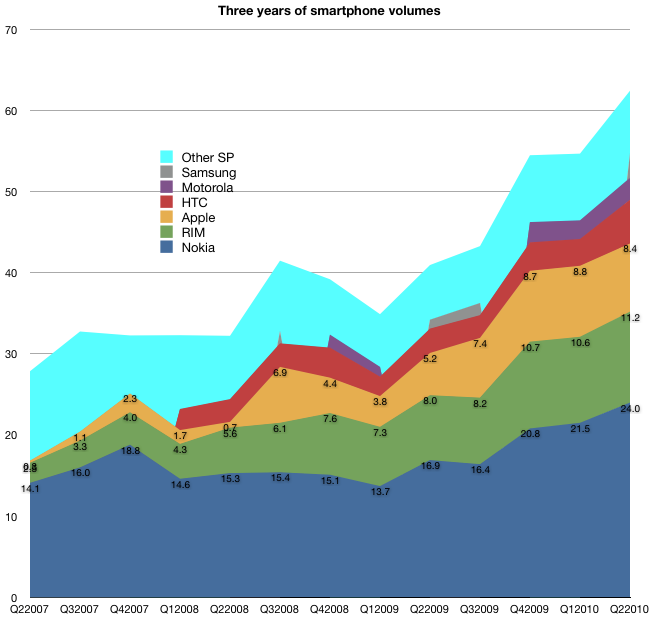
Nevertheless, the iPhone has had a huge impact on the industry. To show just how much of an impact, I dove in and pulled over 500 data points on three years’ financial performance of seven competitors responsible for 80 percent of units being shipped today. The time frame covers the iPhone’s participation in the market so it allows for “before-and-after” comparisons.
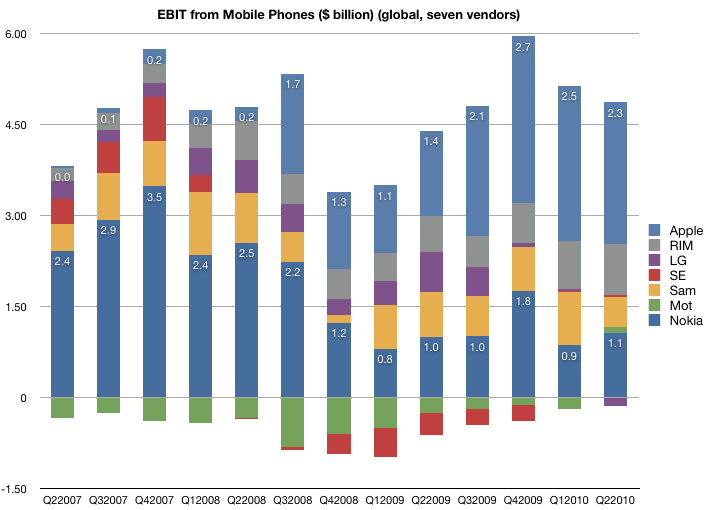
Now I turn my attention to draw a bottom line from all the data above, namely the operating earnings (EBIT or Earnings before Interest and Taxation).
The first chart shows the EBIT from the top seven vendors of mobile phones since the quarter when the iPhone launched. I annotated Nokia and Apple's bars to give perspective.
The total available profits in the industry dipped to a bit under $4 billion at the trough of the recession, and have recovered to nearly $6 billion in the holiday quarter last year. However, not all vendors are profitable. As you might expect from looking at the operating margins, Motorola and Sony Ericsson have been generating losses for most of this time period. They have both reached profitability in the last quarter, though at very low levels and after having lost a large part of their sales. LG has turned negative this past quarter after being a modest earner for some time. Samsung has maintained a fairly even consistency in its profit capture, though with its expanding market share, it seems to have come at the cost of pricing.
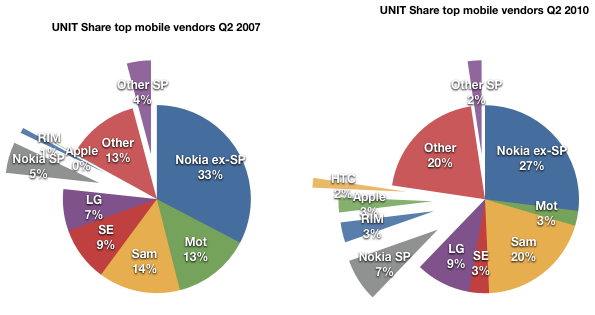
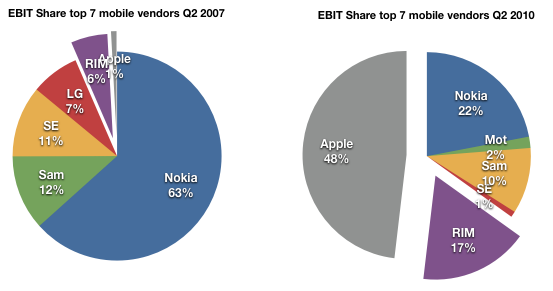
Finally, looking at the pure smartphone vendors RIM and Apple, the picture is nothing short of astonishing. This before-and-after share-of-available-profit chart shows that the two entrants went from about 7% profit share to 65% in three years.
Apple in particular is capturing about half of the available profits with three percent of the units. It dwarfs all the other vendors, more than double the nearest (Nokia). All that in three years and with the added burdens of only three models, a recession and limited distribution.
What does it all mean?
Here are my conclusions, enumerated:
The lack of a real response. The recurring theme in this series of articles has been that giant multinational incumbents in a vast and rapidly growing industry, enjoying all the advantages that size and incumbency, have had their profits taken from them. And they don't seem to have put up much of a fight.
It's all wealth transfer. Note the total amount of profit available has not increased markedly; this is not about incumbents growing the pie. Two thirds of what should have rightly been theirs moved from the incumbent shareholders to the entrant shareholders.
Speed. This shift of profit occurred over an unprecedentedly short period of time. Three years is no more than two product cycles in the industry and it's an order of magnitude faster than what happened historically to other industries.
Disruption is the diagnosis here. The incumbents were caught in the headlights. Disruptive innovation leads to asymmetric competition and this is what we just witnessed. History has shown that the shift of profits is usually the last stage of disruption and is usually irreversible because the change in business models cannot happen at the rate of change of profit transfer.
Which leads me to one final point.
When analyzing the potential for challengers to the new winners, the most cited is Android. Can Android affect this redistribution of profit once again? And to whom?
If Android is to become the dominant platform, does it depend on the success of its licensees? Who are these licensees and what are the chances that they will be able to align their businesses to what Android offers (a new revenue model based on services and advertising).
One problem I see is that Google is making a bet on those same vendors who are now squeezed in the middle of that last pie chart: Samsung, LG, Motorola and Sony Ericsson. Nokia, Apple and RIM will certainly not take the OS over what they already have as it dilutes their differentiation and margins. That means Android is aligned with the biggest losers in the industry.
So how likely are these disrupted ex-giants to recover and take Android forward? My bet: slim to none. Android does not offer more than a lifeline. It is not a foundation for long-term profitability as it presumes the profits accrue to the network and possibly to Google. Profit evaporation out of devices to Google may be a possibility at some time in the future, but only if the devices don't need too much attention to remain competitive. But because they're still not good enough (and they won't be for years to come), it's certain that attention to detail is what will be most important to stay abreast of Apple.[1]
So here we have the real challenge to Android: partnership with defeated incumbents whose ability to build profitable and differentiated products is hamstrung by the licensing model and whose incentives to move up the steep trajectory of necessary improvements are limited.
In other words, Android's licensees won't have the profits or the motivation to spend on R&D so as to make exceptionally competitive products at a time when being competitive is what matters most.
[1]: I would argue the same lack of symmetry with licensed software vendor Microsoft is what led the the failure of the same incumbents to make a dent in the industry with Windows Mobile [2003 to 2010].
Risku believes in the Stupid Manager Theory of business failure. It's still the overall most popular theory describing why large companies fail. It's so attractive because it's so simple.
However, I have several counters/questions to this theory:
When did management become stupid, exactly? The same group was in charge when the company was successful and the corollary to the Stupid Manager Theory is the Smart Manager Theory for describing company success. So how and when did they become stupid.
The conspiracy of simultaneous stupidity. How did *all* managers in a given company become stupid all at once? Did they conspire to lose competence together? Was there something in the water? Didn't anybody escape the stupidity pathogen? A further observation to be made is that when one company in an industry fails, it's usually not alone. Motorola, Sony Ericsson and now LG are in dire straits. Is the stupidity contagious across companies? Should we quarantine managers at firms like Samsung that have not yet been impacted? If the stupidity comes from reading market news, should we just keep them ignorant?
If the managers were always stupid then how did HR get so good at singling out the stupid (or those susceptible to stupidity after periods of intelligence). Isn't the remedy to simply act in perfect contradiction to their choices and hire only the people that HR rejects. After all, being perfectly wrong is a precious gift.
As of the end of the second quarter, Samsung’s global smartphone share was 4.8 percent, according to IDC. But LG’s presence was negligible.
[Update] From early 2009,
LG, the third-biggest phone maker, will produce about 50 models that run Windows over the next five years, said Scott Rockfeld, a director in Microsoft’s mobile business. Seoul-based LG will use the software as its primary program for smart phones, devices that can send e-mail and browse the Web.
So Oracle, who now owns Sun, who open-sourced Java(1), is suing Google over the way open Android is mis-using open Java.
Sounds like an open and shut case. I, for one, am looking forward to the opening statement.
(1) On November 13, 2006, Sun released much of Java as open source software under the terms of the GNU General Public License (GPL). On May 8, 2007, Sun finished the process, making all of Java's core code available under free software/open-source distribution terms, aside from a small portion of code to which Sun did not hold the copyright.