Asymco

Asymmetric Intelligence

Industry

  1. HP's PC group spends 0.7% of sales on R&D

    Research · 3 comments

    The research and development budget used to be 9 percent of revenue, Mr. House told me; now it was closer to 2 percent. “In the personal computer group, it is seven-tenths of 1 percent,” he added. “That’s why H.P. had no response to the iPad.”

    via Talking Business - The Real Reason for Ousting H.P.’s Chief - NYTimes.com.

    HP, by sales, the largest technology company in the world, can't be bothered to spend money on R&D for its PC division. This is a surprise?  Since when does any PC company spend any money on R&D? Put another way, even if they did spend the money, what would they be researching and developing? PCs are commodity products where any improvements would neither be valued nor used.  On the measures of performance that everyone has for the PC, the product has been more than good enough for a decade.

    They did not have a response to the iPad because they did not think anybody needed an iPad.  And that is mostly because Microsoft did not think anybody needed an iPad.

    None of this has anything to do with Mr. Hurd. His peer group all agree on these fundamentals.
  2. The iPhone growth rate

    Research · 14 comments

    John Gruber puts things in perspective:

    The key bit: “At the critical juncture […], when they should have gone for market share, they went for profits.” I think this encapsulates Jobs’s philosophy since taking over Apple in 1997. Take the high end of the market first, establish a brand and presence, then steadily start to expand.

    Daring Fireball: N92.

    I've long argued that Apple is in the phone business to win significant share (i.e. greater than the share they have had in the PC business).  Since the phone market is vast (1.2 billion phones sold in the last four quarters) iPhone volumes must be as well.

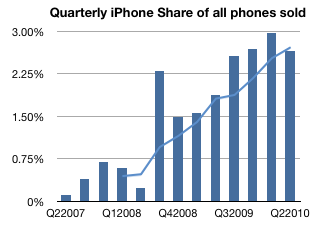
    So how has share evolved, and what can we expect? This is a graph of quarterly share for iPhone including a four period moving average:

    The trend is clear to see.  With seasonal variation due to the launch cycle, the share is likely to increase over 3% and keep going. How far can it go? That's a strategic decision for Apple's management. If we are to take Steve Jobs' word that their plan is not to be a niche player in any market they target then I have to conclude that Apple is aiming above 10%.

    The volume expansion in the US due to the end exclusivity is only the latest in a series of distribution deals that Apple has brought to bear: International expansion, dropping exclusivity in other countries and broadening the portfolio (including earlier models in current line-up) are all natural and obvious moves in a broader market push.

    Pricing might be considered another lever that Apple could use, though that seems unnecessary today.

    I conclude that growth in iPhone sales of 50% per year seems entirely possible for the next few years. Such growth would allow Apple to reach 10% of the world's 3G subscribers by 2013. That would still be only 4% of all phones and 20% of smartphones.

  3. The near-death experience prerequisite

    Research · 3 comments

    All phone vendors saw smartphones coming.  They hired all the right market research companies and spent lavishly on analysts to confirm that phones with operating systems were imminent.

    Nokia was one of the early movers, establishing its own software platforms group as early as 2002 while others like Samsung licensed Windows Mobile or PalmOS as early as 2003. Yet not much happened to sales. The number of smartphones units sold as percent of total has been fairly low.

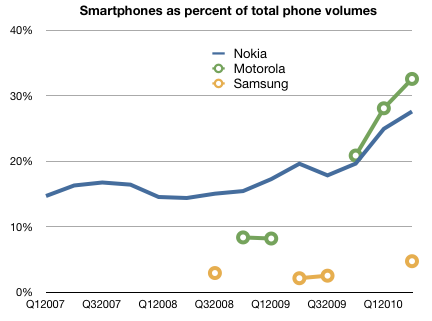
    The following chart shows the number of smartphones sold as a percent of all phones sold for the top three vendors (as of the time when the chart starts early 2007). Note that the percent of smart products shipped did not accelerate or grow dramatically for the largest two vendors even into last year.  It's still a pittance at Samsung (<5%) and even less at LG.

    The one vendor that did stage a shift was Motorola. (and Sony Ericsson, though later and softer) Both converts did this shift when faced with near-death experiences of sequential earnings losses and catastrophic market share collapses.

    Nokia is showing signs of a secular shift to smartphones but it's been a decade-long process so far, a slowness that ripped shareholder value to pieces.

    So is the precondition for a shift to smartphone focus a collapse in the core business?  It certainly seems so from the data. Motorola first, Sony Ericsson second, Nokia presently and Samsung and LG later.

    Each of these decision points reflect precisely the timing of pain points with the core businesses.

    Why this asymmetry? At first glance, the smartphone business should be sustaining and an attractive option to be exercised as soon as possible.  It offers better margins, better prices and a better return on capital.

    So why is there this disconnect? As regular readers of this blog can probably guess, my hypothesis is that the smartphone business is disruptive.  Incumbents are motivated to ignore this business because it makes money in ways they cannot control. More importantly, their best customers are signaling (in non-transparent ways) that they don't want their top vendors to participate in this market.

  4. Is an iPhone worth 8 Nokia phones or 2 Blackberries?

    Research · 4 comments

    Pricing is a leading indicator of value. Some might argue price and value are often out of whack but, in the long term the two converge.

    So it's instructive to measure how a vendor creates value by what it's able to charge for its goods. In the case of mobile phones, price is summarized by something called ASP (average selling price) which is measured each quarter across a vendor's entire portfolio.

    Again, there might be local fluctuations, but the trend is your friend here.

    Take a look at these charts I prepared based on the group of seven vendors I previously analyzed in terms of their sales and volume performance.

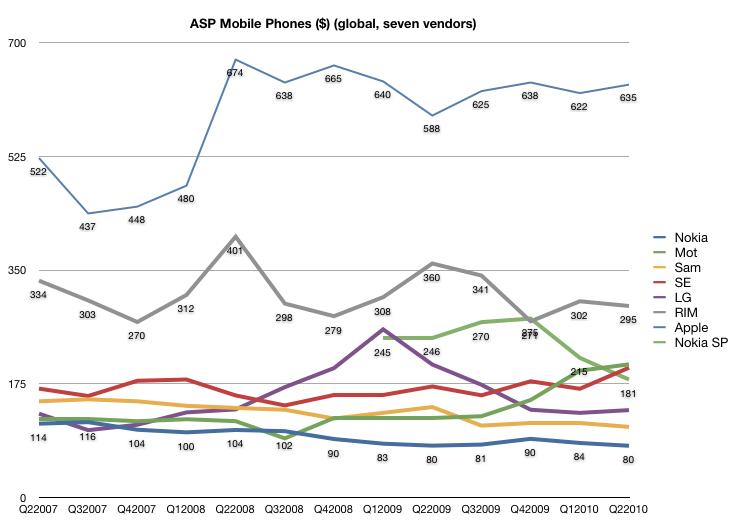
    First, a history of pricing since Q2 2007. All figures are in US dollars current as of time of reporting.

    Here we see the ASP erosion inherent in the large incumbents with Nokia and Samsung both seeing price slides. LG went through a phase of price growth but has returned to a point near to where it started three years ago.

    While Sony Ericsson and Motorola were following the downtrend until 2008, they reversed and began an ASP climb while fleeing upmarket (at the expense of volumes).

    Finally we have RIM and Apple both holding the line on pricing while growing volumes. Not only are the lines steady (with Apple slightly increasing and RIM slightly decreasing) but they are way above their competitors; Apple's shockingly so.

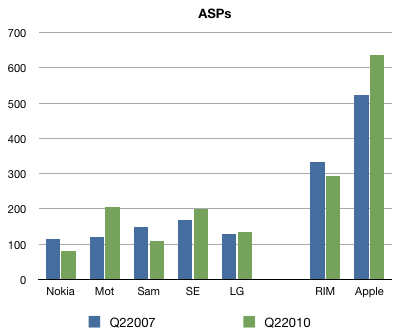
    Here is the before-and-after view:

    During the three year window we're looking at, Apple and RIM showed ASP durability while incumbents showed ASP erosion.

    Pile these data points on top of the volume and sales data and we can move forward.

    (In answer to the question in the headline, the answer is: Yes.)

  5. In phone sales, RIM plus Apple equals Nokia

    Research

    Following up from the last article on the global phone units sold over the last three years (Visualizing the winners and losers of three years of smartphone share growth), we take a look at the sales in dollar terms over the same period.

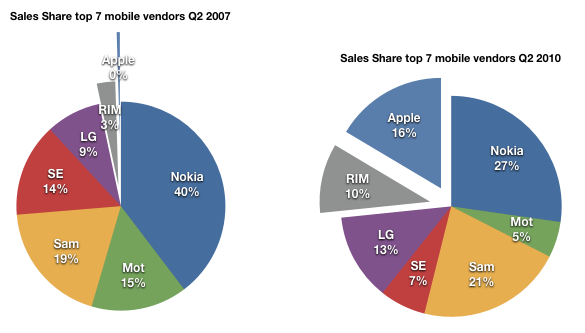
    Remember that in the article on units, the pure-play smartphone entrants HTC, RIM and Apple grew from a combined unit share of 1.3% in Q2 2007 to a combined unit share of 7.7% in Q2 2010.  That's a 6 fold increase in volume share. Quite remarkable for companies lacking the vast resources and industry connections of the incumbents.

    However, when we look at their performance in value (dollar sales) vs. units sold, the performance of the entrants begins to look miraculous.

    The sales figures can be obtained from the company reports, though I caution that not all vendors publish data and data published is in local currencies. Fluctuations in exchange rates may lead to differences in reports of sales from different sources.  For the sake of consistency, I omit all "other" vendors and focus on the top seven: Nokia, Samsung, Motorola, LG, Sony Ericsson, RIM and Apple.

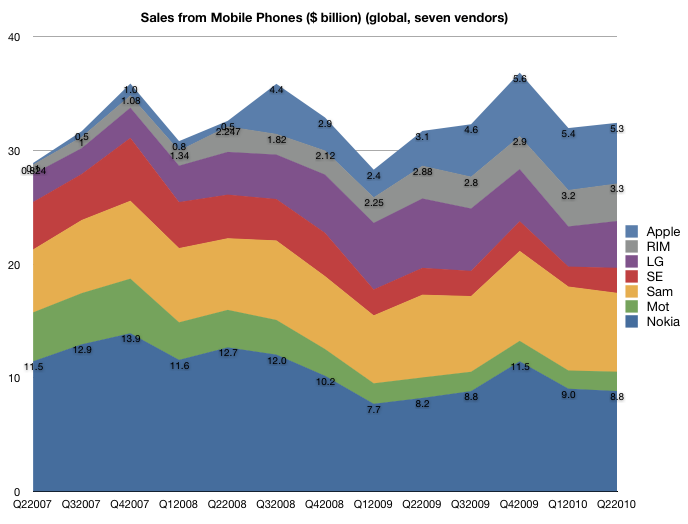
    First, the cohort's overall performance is shown in the following graph:

    I again annotated Nokia and RIM and Apple with actual sales (USD) figures for some perspective.

    The first thing to note here is that the whole industry sees a low rate of growth (unlike in the units picture). Total sales in Q2 2007 were $29 billion and total sales in Q2 2010 were about $32 billion. A mere 12% growth over three years and only 4% compounded over three years. Total units in Q2 2007 were 255 million and total units in Q2 2010 were 318 million, or 24% over three years and 6.2% compounded. This means industry-wide sales growth is half the units growth.

    The second thing to note is that the Apple+RIM group grew from 3.3% share of cohort to 26.6%.  That means that more than 1 in 4 dollars sent to these 7 companies was spent on Blackberries and iPhones!

    Jointly, Apple and RIM took $8.6 billion and Nokia took $8.8 billion.  Compare that with three years ago when Nokia took 40% of the income and RIM + Apple took 3%.

    So whereas the entrants increased units share by 6x in this time period, at least in this large subset of the market, they increased revenue share by 8x.

  6. US as epicenter for mobile data utilization

    Research

    Japan and Korea have further 3G reach but use it significantly less.

    His findings support notions that Android and iPhone are controlling data use in the US. The iPhone's current exclusive home, AT&T, and Android-favorite Verizon both make up 75 percent of American data use

    via Smartphone data use up 50% in just six months | Electronista.

    Is there any surprise that in the country where the iPhone and Android are most popular there is the highest data usage even though it has one of the poorest mobile data infrastructures in the developed world?

    What does that say about the importance of the device (and not the network) to the adoption of data services.

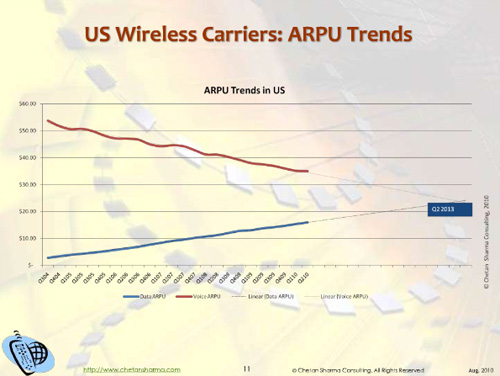
    There are implications about the relative power shift between operators and device vendors. Within the mobile value chain, as mobile data overtakes mobile voice, the economics and value propositions will shift. The motivation of participants will begin to diverge and a schism will occur.

  7. 70 percent of college freshmen are entering school with Macs [Updated 2]

    Research · 2 comments

    Increasingly, companies are giving their employees a choice to either use Microsoft Windows PCs or Apple Inc.'s Macs, the analyst said. And, increasingly, employees are choosing Mac over Windows. To boot, Chowdhry said 70 percent of college freshman are entering school with Macs, up about 10 percent to 15 percent from a year ago.

    via Microsoft shares retreat after downgrade.

    Remarkable indeed.  I remember when in 2007 40% Macs was headline news at Princeton, having quadrupled from 10% in 2003.

    [Update] Chowdry’s estimate seems an exaggeration but Mac share on campus seems to be growing. The most current data shows a probable 50% penetration in private colleges (my estimation is 70% is accurate for Ivy League schools) but a probable 20% penetration at public schools.  Still way above retail share in the US (10%) and way above corporate share of practically naught.

    [Update 2] According to survey data from Student Monitor, among those who planned to purchase a new computer, 87% planned to buy a laptop. And among those students 47% planned to buy a Mac.
    47 percent of 87 percent is a lot more believable. The chart from Fortune Tech shows that intent to buy for Apple went from 14% to 47% since 2005.

    More data, some courtesy of Macobserver readers:

    Macs at Harvard:

    • 2005: 32% (of total computer purchases)

    Mac share at Princeton (freshman class):

    • 2003: 10%
    • 2007: 40%

    George Fox University provides a laptop as part of the tuition.  Here are their numbers for Mac usage:

    • 2006 1% (Actively discouraging Macs)
    • 2007 40% (Change in IT support policies)
    • 2008 100% (Only option offered)

    The U.S. Coast Guard Academy.

    • 2008: 0% (Dell)
    • 2009: 25% (15” Macbook Pro issued, incoming freshman subsidize half the cost and 100% of any optional upgrades including printer
    • 2010: 50% (plus juniors and seniors allowed to replace older Dell with Mac if desired, not sure the financial arrangement).

    University of Virginia (survey data):

    • 2001: 3%
    • 2002: 4%
    • 2003: 4%
    • 2004: 8%
    • 2005: 13%
    • 2006: 20%
    • 2007: 26%
    • 2008: 37%
    • 2009: 43%

    UC Davis:

    • 2006: 7%
    • 2009: 23%
  8. RIM's decomposing innovation

    Research · 4 comments

    It's hard to get excited about the new RIM Blackberry Torch.  It's not exciting in a positive way and not exciting in a negative way. It's just more of the same and the same is not all that bad. Then again, the same is not all that good either. Every piece of the Torch product is playing catch-up with others' innovations without enhancing the core innovation RIM itself brought into the market years ago.

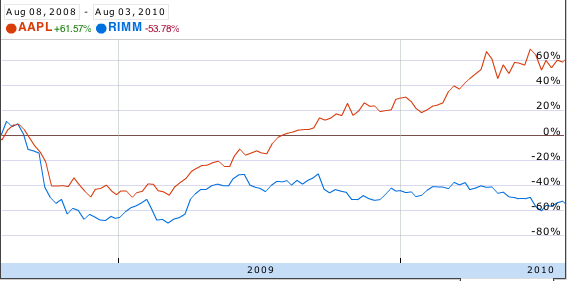
    RIM has a significant but deteriorating share and is a company that has done very well as an entrant in a space dominated by larger incumbents.  But there is a strong smell of Palm about it.  The musty smell of decomposing innovation. Wall Street seems to smell it too (two year stock price chart relative to AAPL below)

    The problem seems to be that, like in Palm's case, mobile computing is a game for big companies.  If you ask why Palm and RIM became uncompetitive you get two different reasons. Palm could not do hardware and distribution well and RIM can't do software well. But these reasons have remedies which neither company can bring to bear: resources and processes. Palm did not have the resources for distribution and production and RIM did not have the processes to be a software platform company.

    Their values and priorities are adequate but competitiveness today, in this market, requires projecting market and development power.

    I can only conclude that RIM is simply too weak to make it in the long run.

  9. Global mobile phone sales, the full picture

    Research

    After piecing together the global smartphone shares, it's time to take a look at global mobile phone shares. That's all phones from all vendors that matter.

    Unfortunately, just like there are only fragments available from Canalys about smartphones, there are only partial lists from IDC (IDC - Press Release - prUS22441510).  Missing are numbers from Apple, Motorola and HTC.  But fear not, those can be obtained from company earnings reports.

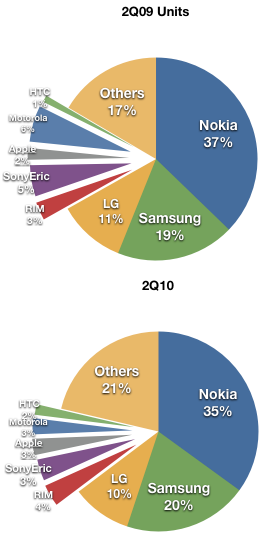
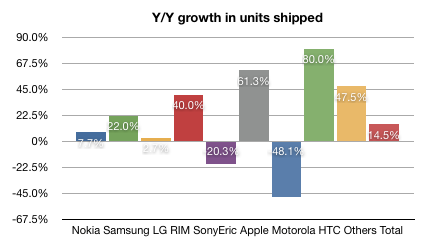
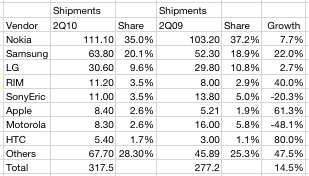
    So here is the full picture for 2Q10 vs. 2Q09

    The year-on-year growth for the vendors above is:

    The source data is:

    Observations:

    • The pure play smartphone vendors (HTC, Apple and RIM) are growing rapidly and capturing most of the profits.
    • LG and Samsung are taking share from Nokia but losing margins.
    • "others" are doing well at the low end.
    • Sony Ericsson and Motorola are transitioning from mass market vendors of commodity voice products to niche vendors of Android commodity data products.
  10. The deterioration of Nokia's core business

    Research · 5 comments

    The saga of Nokia's challenges has been well documented in this weblog.

    For this quarter, we take a look at the sequential deterioration in Nokia's bottom line and draw causal inferences to its lack of competitiveness in mobile operating systems.

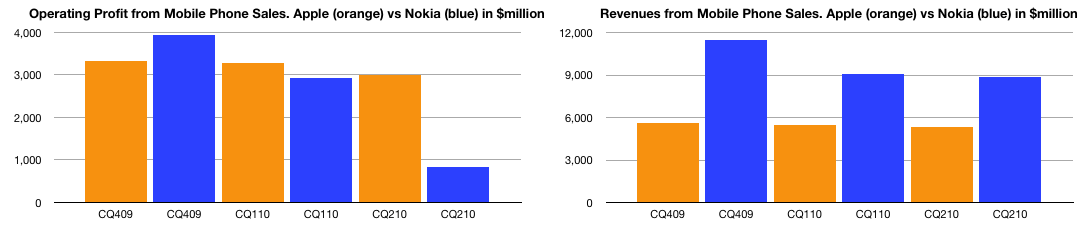
    First, the bottom and top lines are shown below (in blue) and compared with Apple (in orange):

    The charts show how Nokia's bottom line (left) collapsed while the top line (right) remained relatively solid. By comparison, Apple remained consistent in revenue with slight dip in profit as it transitioned to a new model.

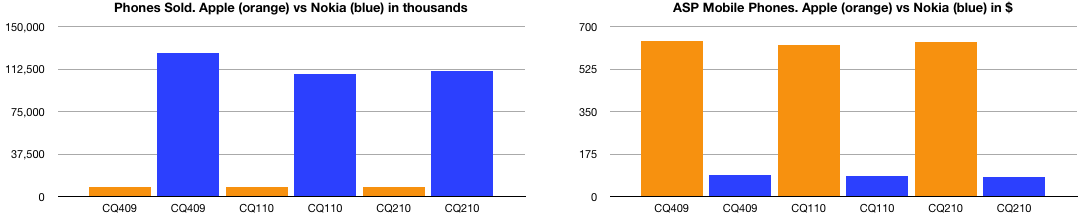
    The top line (sales) is the product of units sold and their average selling price (ASP). Here are these two quantities side-by-side:

    Note how Apple's units are hard to discern relative to Nokia's volume and how the opposite is true for the selling price. These values include all phones sold by the companies.

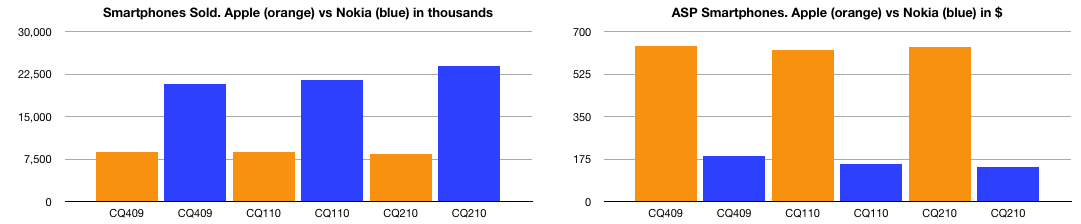
    The story is a bit more clear when comparing the smartphone part of Nokia's business, again with units and ASP:

    The story here is telling: even in smartphones, Apple's ASP is dramatically higher and much more resilient.

    The question has to be why: Why can Apple retain not only higher prices (and hence margins)? The answer is competitiveness. Margin is an indication of value created and value differential is competitive differentiation. All the user satisfaction surveys, the reviews and tests boil down to these hard numbers above. The deterioration of Nokia's business is directly traceable to its historic failure to embrace mobile software as a disruptive force and instead using it to sustain a hardware business.

  11. LG joins Nokia in missing estimates due to competitive pressures

    Research

    Losses from mobile phones totaled 120 billion won ($101 million) in the second quarter, compared with profit of 620 billion won a year earlier, Seoul-based LG said in a statement today. The loss, the division’s first in four years, was triple the size projected by the average estimate of five analysts surveyed by Bloomberg.

    via LG Posts Record Handset Loss on IPhone, Smartphones - BusinessWeek.