Cash flow is a fact, earnings are an opinion and share price is a dream.
A company's total worth is the number of outstanding shares multiplied by their value. This product is called the market capitalization or Market Cap.
That's a simplification. If you want to be more accurate, you should take the Market Cap and net out cash and debt--these are not part of the future flows of cash that can benefit shareholders.
More precisely, there is another measure called the Enterprise Value (EV) which is the total price tag of a company, representing what it would cost to buy the entire business and pay off its debts. EV = Market Cap + Total Debt + Preferred Stock + Minority Interest - Cash and Cash Equivalents.
This is the precise and complete measure of the firm's value but we use the shortcut of Market Cap since In most cases the Preferred stock and minority interest are negligible and if cash equals debt then the result is EV =~ Market Cap. it's easier to calculate anyways as the shares outstanding and share price are easily available. Not so for EV.
To get a sense of how much you're paying for the company it makes sense to divide the Market Cap by the company's Earnings so you get an idea of how many years it will take to get back your investment. When dividing both Market Cap and Earnings by the number of shares it becomes the famous P/E ratio or Price per share / Earnings per share.
But if you want to be fully precise, instead of using Market Cap you should use Enterprise Value. In that case the denominator should be Free Cash Flow or FCF[1]. The ratio becomes EV/FCF. Free Cash Flow is a better measure than earnings because it takes into consideration depreciation, change in working capital and capital expenditures. It measures the actual cash a company generates after paying for its operating and capital expenditures.
EV/FCF takes into consideration unusual situations such as huge amounts of cash or debt or capital expenditures which removes shareholder access to what the company "earns" on paper. This why the adage of "earnings are an opinion but cash flow is a fact" exists.
I used EV/FCF years ago to value Apple because at a time when it held huge amounts of cash. This was before it began aggressively reducing its cash through its capital return program. The P/E ratio at the time was very low but excluding the cash, it was even lower. It was a huge red flag indicating that the company was being priced for liquidation, or as some analyst put it, priced like a steel mill going out of business. If at that time you did not believe that its demise was imminent you would have surely been richly rewarded.
Today the anomaly that throws the P/E off is not Cash but CapEx. And it's not for Apple but for the other mega caps or AI "hyper scalers". Without worrying who is or isn't in the "Magnificent 7" I compiled the largest 10 market capitalization companies and looked at their P/E and EV/FCF ratios. At time of writing:
Company
Market Cap
P/E Ratio
EV/FCF
NVDA
$4,014,456,963,072
33.6
44.4
AAPL
$3,624,949,514,240
31.3
30.3
GOOG
$3,304,174,911,488
25.2
44.3
MSFT
$2,667,926,257,664
22.5
35.0
AMZN
$2,157,182,320,640
28.0
297.0
TSM
$1,641,528,688,640
30.6
50.0
TSLA
$1,333,163,982,848
332.0
225.0
META
$1,356,802,949,120
22.8
32.6
BRK-B
$1,023,780,323,328
15.3
44.1
LLY
$793,550,454,784
38.6
142.3
As recently as six months ago, there was a lot of talk about an AI bubble. Back then I looked at the data then and by looking at the P/E ratios convinced myself that the valuations were not "bubble" level. They were in the mid-thirties. These were not historical high especially when considering the growth these companies were experiencing (over 30%). Since then prices have come down significantly.
This is as the CapEx elephant in the room has been making itself known and there is renewed alarm at the scale of capital spending. This is reflected in the EV/FCF number but not in the P/E number.
The table above shows how much more elevated the EV/FCF ratio is relative to P/E for many of the companies. This "truer" measure of what you are paying as a share buyer is now reflecting in reduced share price and hence reduced P/E.
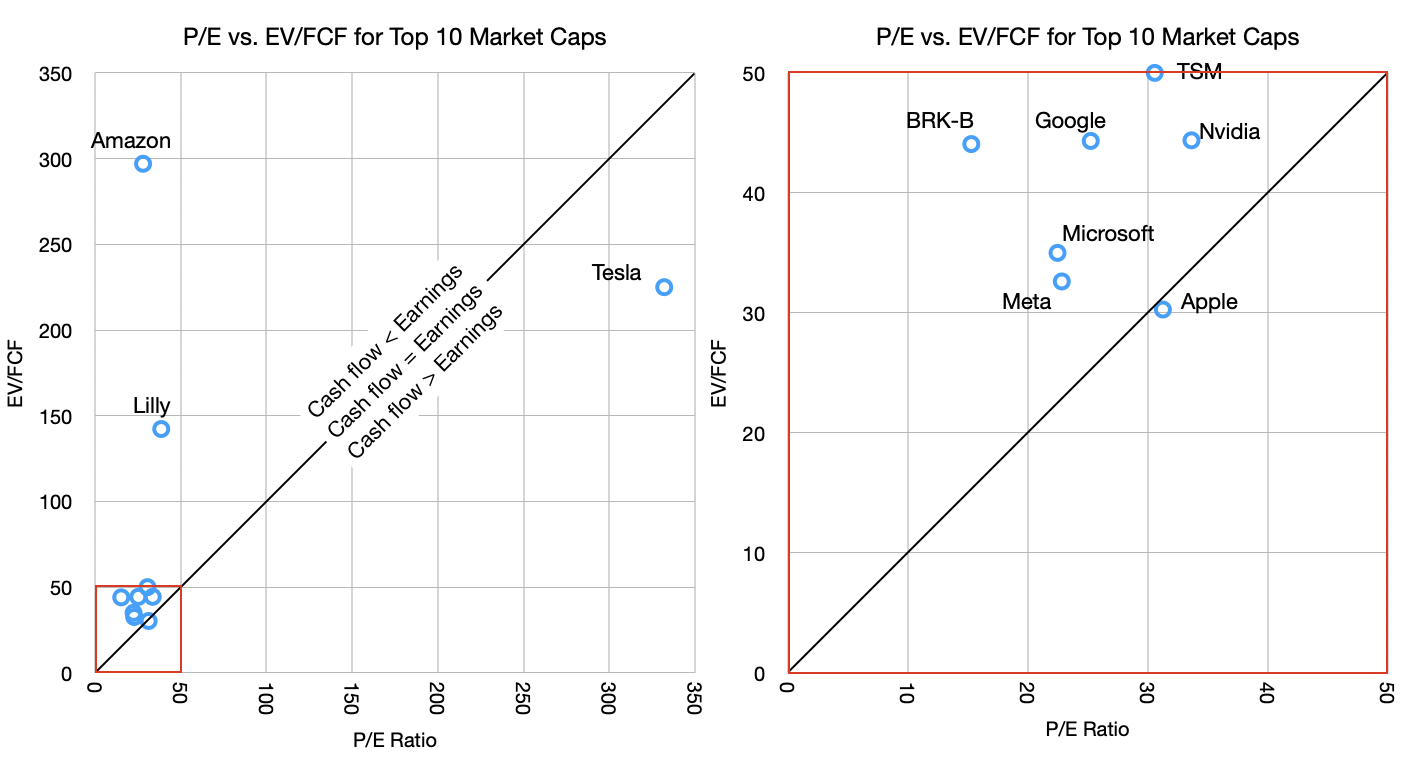
Of course, this is not true for Apple. Apple's P/E ratio and EV/FCF are nearly identical. To see this more clearly I put together these graphs.
The graph shows the P/E vs. EV/FCF for the companies in the table. The graphs are the same data but the one on the right is zoomed in on the lower left corner (note the red squares).
The reason for the zoom is that there are three outliers. Tesla, Amazon and Lilly. Tesla has absurd valuation on both P/E (300 to 400 range in last 6 months) and EV/FCF while Amazon has an outrageous EV/FCF value due to abnormal capital spending. Basically, Tesla has negligible earnings (and negative growth) while holding astronomical share price and Amazon is spending far above its median on CapEx. Amazon's 10-year EV/FCF is much lower, at approximately 55.
But let's ignore the outliers and concentrate on the other seven in the cluster. These are below 50 P/E and 50 EV/FCF thresholds.
Note that I drew a diagonal line representing the equation of P/E = EV/FCF. This should, under normal circumstances, hold for most stocks. Just like Market Cap should roughly equal Enterprise Value so Earnings should equal Free Cash Flow.
Most companies should not stray too far from this line. But what we are seeing, with the notable exception of Apple, is that most tech companies have cash flow far below earnings. This is again due to the CapEx elephant.
The argument goes that this is a temporary situation with that capital being wisely deployed for returns from AI. Presumably, these companies will swing to the other side of the line, where cash flows will exceed earnings, compensating for the capex that was denied to the shareholders.
This is where the old adage comes into play: Earnings are an opinion but cash flow is a fact. I added to that "and share price is a dream". Take the free cash flow and multiply it by a "dream" and you get the price the market sets. This dream is the multiple.
What makes the AI "bubble" interesting is how it's not fueled by debt[2] but by cash flow. Companies are turning over large portions (almost all and sometimes more) of their cash flows to investing in the dream of AI profits. All but one, of course.
There is something obviously contrarian in Apple's strategy. Perhaps it's not Apple that is odd but rather there is groupthink on behalf of the others. The question of who's right will rest on whether it turns out that AI is going to commoditize quickly or perhaps never, whether AI turns out to be modular or integrated, whether AI exhibits disruptive or sustaining competitive responses, whether it's an infrastructure subject to regulatory corrosion or whether it will migrate to the edge and iterate freely, whether it's a new experience or simply better existing experiences, whether it creates new markets or just makes existing ones more efficient.
These are not new questions. They have been applied to all software and hardware innovations of the last 40 years. We have a lot of history to inform us.
There are 80 million Mac users. The last 12 months saw sales of 18 million Macs.
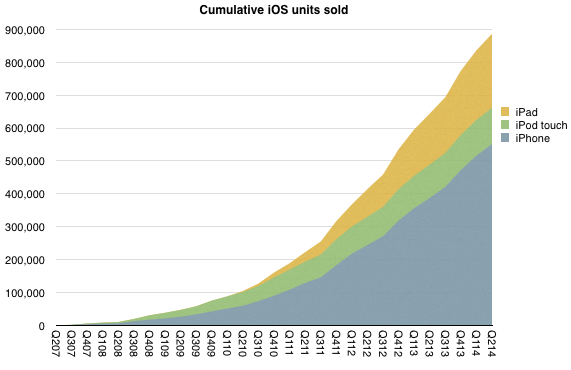
As of the end of June there were 886,580,000 iOS devices sold. As of today the total is well over 900 million. One billion sold will happen well before this year is out. Estimates of current iOS users vary but they are probably at least 500 million and could be 600 million.
Apple claims 800 million iTunes accounts.
Therefore, in terms of revenues:
Mac User = $289/yr
iOS User = $262/yr
iTunes User = $25/yr (( Measured from billings ))
Adding iTunes usage to either Mac or iOS yields
One Mac owner = $323/yr or 89c/day
One iOS device owner = $287/yr or 79c/day (( This conforms well to the rule of thumb that, after taxes and accessories/services, one Apple device is worth about $1/day ))
This should make valuing Apple easy.
80 million Mac Users and 500 million iOS users add up to about $169.3 billion in sales per year. If we assume that the number of Mac users grows to 90 million and 600 million for iOS then next year Apple should get another $200 billion from its population of users.
So over the next 30 months Apple sales should easily be higher than its current enterprise value. (( Enterprise Value = Market Capitalization - Cash + Debt = $585 billion - $164.5 billion + $29 billion = $449.5 billion ))
This would be the forward price to sales ratio of about 2.5. Each sale yields a certain net profit, which for Apple is on average 21%. Multiplying 2.5 by (1/.21) gives 12 which is about the P/E ex cash.
This exercise summarizes Apple's valuation nicely: Apple is expected to keep its current customers for about a decade and then disappear.
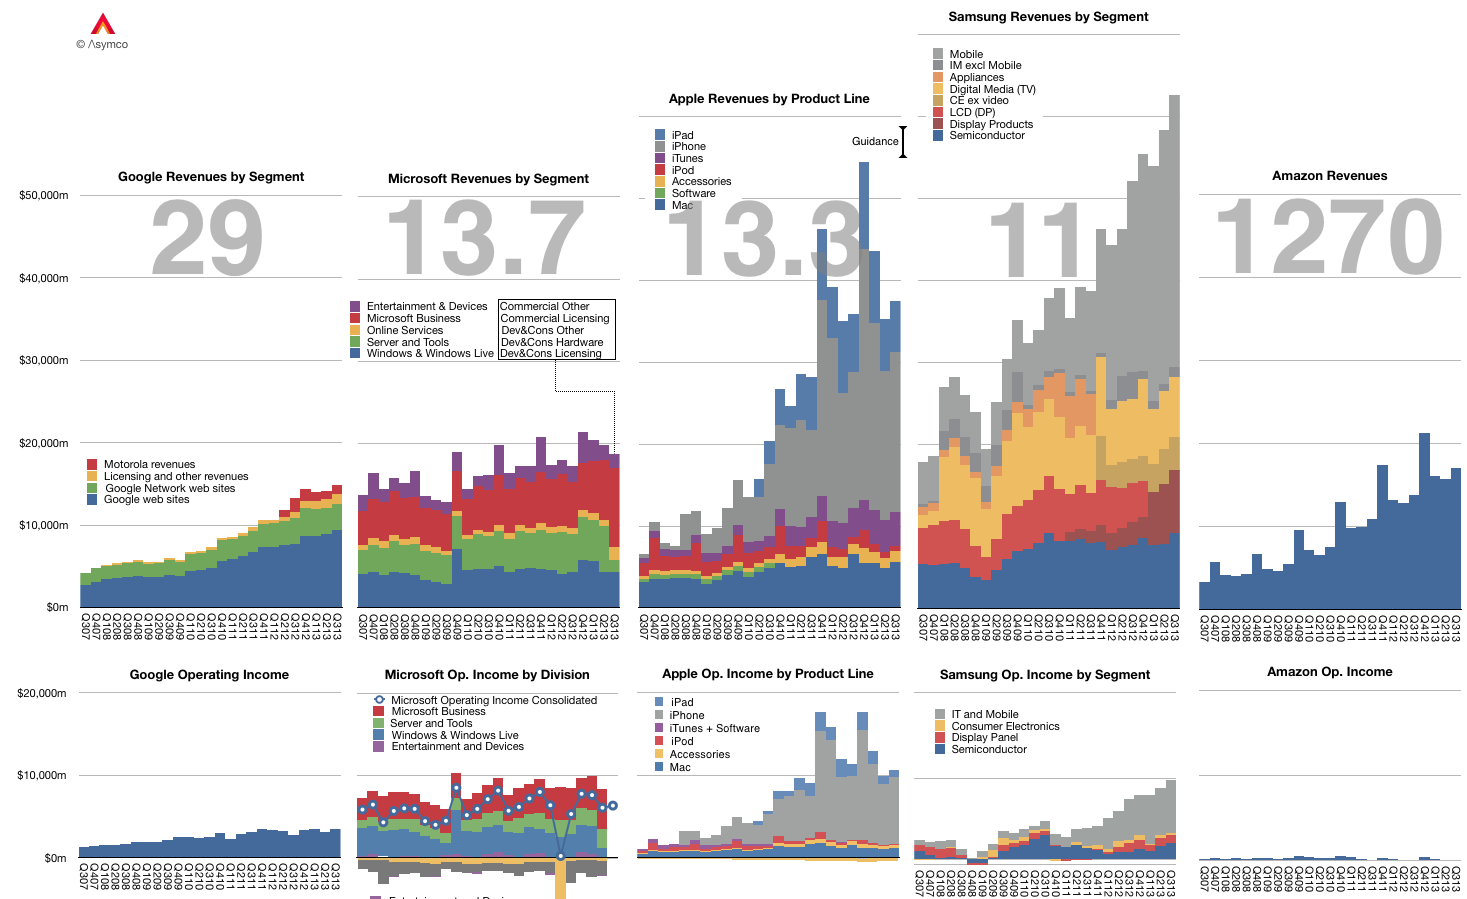
The graph below shows the Revenue and Operating Income for a select group of companies. The large numbers represent the share price to earnings (trailing twelve months) ratio (P/E or PE ratio).
Of course the P/E ratio hides a lot of subtlety. It mostly fails to account for the fact that earnings are largely a matter of opinion. A company can defer income (as Apple and Microsoft do), it can invest earnings (as Amazon does) and can otherwise avoid declaring it since it's taxable.
A better measure is the Enterprise Value to Free Cash Flow ratio (EV/FCF). It reflects a "harder" measure of performance in the form of free cash flow. It is not a matter of opinion but a fact. Enterprise Value also excludes cash which is a measure of past performance.
Nominally both P/E and EV/FCF measure the valuation of a company. They give what amounts to the number of years that current performance can be expected to last. For example a P/E or EV/FCF of 10 can be read as "If I purchase a share today, I should expect the company to pay me back in earnings in 10 years." Any earnings after 10 years are essentially "profit" for the investor.
Inverted these ratios are a measure of Yield or how much of the total investment is paid back in a given year. In the example above, the Yield would be 10% or "If I purchase a share today, the company will pay me back 10% a year in earnings."
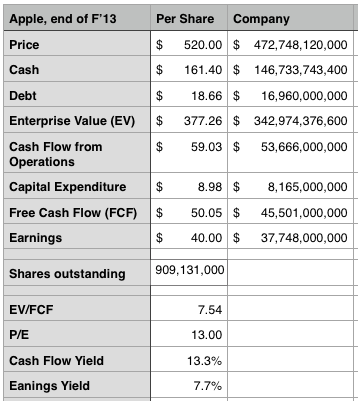
Relying on P/E is troublesome since, as mentioned above, it's deceptive. We get into difficulty when P/E and EV/FCF differ greatly. If a company has minimal cash and declares all free cash flow as earnings then the ratios are the same. However, consider how different these two ratios are for Apple:
The P/E ratio is 13 while the EV/FCF is 7.5. ((It would be very interesting to have both ratios available for all the companies in the graph above.))
This means the investment horizon is nearly half of what P/E suggests. (The cash flow yield should give pause). Put another way, the market suggests that Apple has 7 more years of current profitability and not 13. Note that the P/E ratio for the S&P 500 is above 19.
As Apple's deferrals are increasing investors should look again at what the company's worth. We had similar confusion when the company was deferring most of its iPhone revenue.
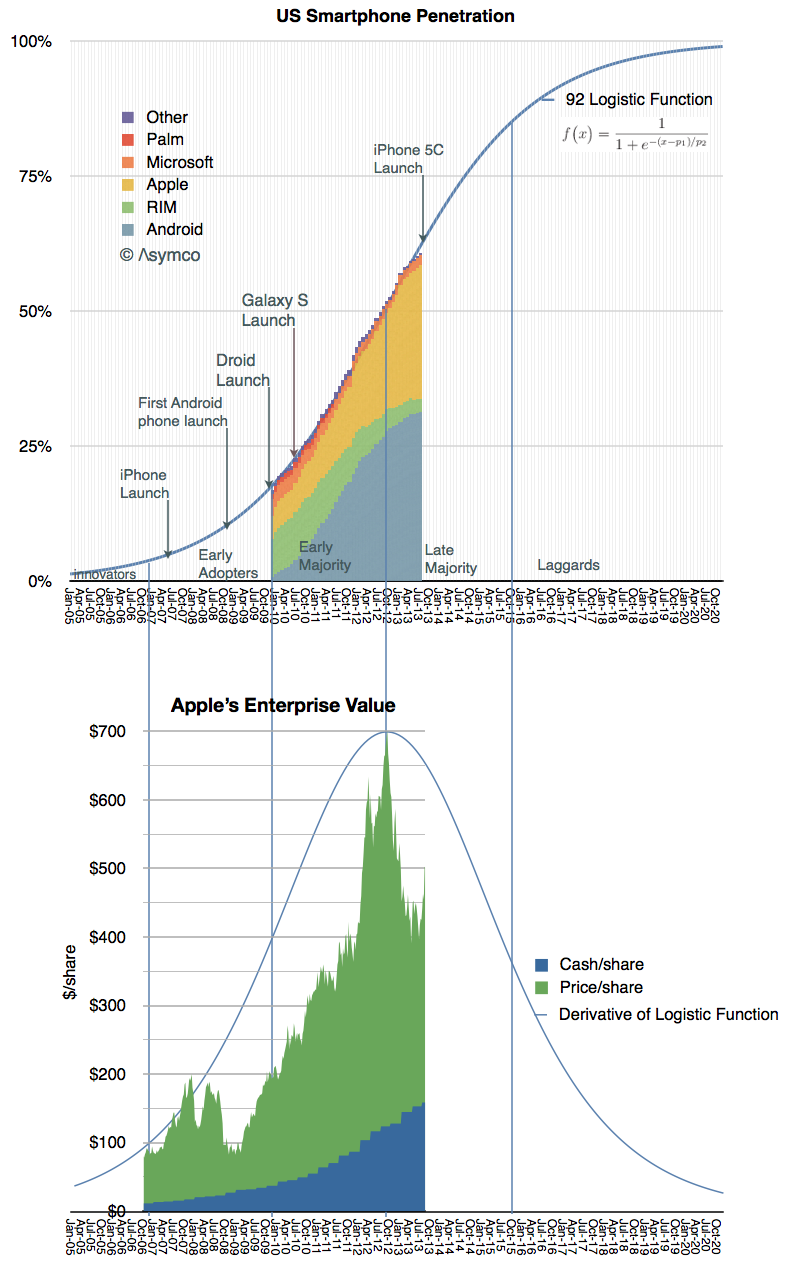
The analyses of adoption of smartphones in the US and EU5 are remarkably consistent with each other. They also turn out to be consistent with the valuation of Apple.
I show the stages of adoption overlaid with the derivative of the Logistic Function and Apple's enterprise value. The derivative of the Logistic Function shows the speed of adoption, peaking at the inflection point when adoption ceases to accelerate and begins to decelerate.
The peak in Apple's enterprise value happens to fall at the exact point of inflection in the adoption curve and hence maximum growth.
It could suggest that the market perceives the value of Apple to be entirely reflective of the US market.
But I can't imagine anyone would be so foolish as to believe it.
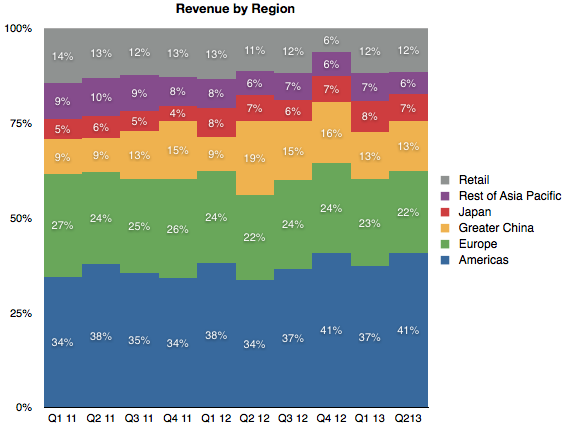
One can only conclude that it must be just a coincidence. (( Apple's revenues by region:
Here is a discussion of the changes since the last analysis:
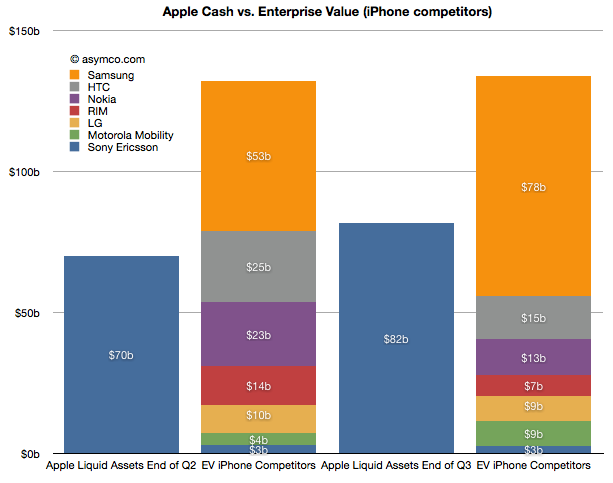
Sony Ericsson was valued through its acquisition by Sony. We did not have a way to value the enterprise before as it was not traded independently. Last June I estimated a 14x multiple on its trailing twelve months' profits and got $3.0 billion. Since then half the company changed hands for about €1.05 thus yielding a total company value of $2.8 billion. The enterprise value should be therefore slightly lower but I'll stick with the current transaction value as the EV.
Motorola Mobility has entered into an agreement to be acquired by Google for $12.5 billion by Google. The company's enterprise value jumped as a result to about $8.6 billion.
RIM's share price collapsed and it's now also trading at an EV of about 7.3 billion (Yahoo finance).
Nokia's price has also dropped and it now has an EV of about $13 billion (Yahoo finance).
HTC recently dropped significantly in price and is now worth about $15 billion EV. (Note that pricing of its equities is subject to suspended trading due to drop limits).
LG's phone business is still losing money and it's still difficult to value. In November it was revealed that the company was seeking to raise $890 million in capital to fund new initiatives including smartphones. The share price fell by 14%. In June I suggested a nominal value for the phone business of $10 billion. I think that's very generous and with recent events I would place that value at $9 billion today.
Samsung's fortunes have increased. In June I applied a 14x multiple to their trailing 12 months' operating earnings. Given overall discounting of the sector I applied a multiple of 13 today. That yields a business value of $78 billion. Interestingly, that is larger than the value of all other competitors apart from Apple. That also makes it six times more valuable than Nokia.
Apple's cash and cash equivalents and investments grew by about $12 billion and were worth about $82 billion as of October.
In summary, in June Apple's cash was about 53% of the sum of competing phone vendor enterprise values. Today it's about 61%. Excluding Samsung, Apple could buy the industry and still have $25 billion left over. This makes the claim that "Apple could buy the industry" even more believable.
This analysis is mainly academic. It does not imply that any such transaction will take place. As the purchase of Motorola shows, control has a premium and individual buyers may be less "rational" than markets. What it does show however is that the entire industry is in a state of crisis. Valuations for phone companies are collapsing and two major brands (Motorola and Sony Ericsson) are being absorbed and could disappear.
At the same time entrants are arriving with completely different business models. Amazon, Facebook, Baidu, Alibaba are intent on selling phones or platforms to be valued as enablers for asymmetric business models rather than as phones. One could argue that what Apple itself sells is more than hardware and that its value-add "on top" of hardware is increasing. This is a sign of commoditization. Certainly the voice business is well beyond that point but it now appears that even the smartphone business is already in an advanced state of value compression.
All the while the overall market is growing. I had separately looked at the profit pool and concluded that the brands are suffering. Summing up the votes from stock markets, the sentiment is even worse. 2012 is looking more and more as a year of inevitable and dramatic industry change.
In his third “The Critical Path” podcast, Horace Dediu explained how Apple’s cash can be viewed as a strategic option, an opinion that resonated also with other analysts [1]. Cash is one of the most flexible resources as it can convert quickly into other resources such as brands, companies, technologies, people and even processes. More cash means more strategic flexibility. The large cash reserve Apple has accumulated provides high flexibility for future investments. These characteristics of cash already imply an intrinsic option value. But how big is this value?
Calculating Option Value
To help us determine, I will apply the Black-Scholes model. The model has two key characteristics that are applicable to valuing the option character of Apple’s cash. First, the simple form of the calculation excludes dividends and, as far as we have seen, there is no new information available that would suggest that Apple will pay dividends in the near term. Second, it implies that the option can be exercised at any given time until the end of the option exercise period - just like any buying or investment decision made by consumers. Lastly, we will assume that Apple’s cash (including short-term and long-term cash as well as financial investments) is instantly available. Although large amounts are held by foreign subsidiaries or are invested in maturities longer than one year, we can overcome these practical issues by borrowing against it. As we are interested in the value of the whole pile, we use the latest reported figure of $81.6 billion as the strike price (or exercise price).
What other inputs do we need to determine the option value of Apple’s cash [2]?
Volatility: A measure that determines financial risk of a certain asset. Apple’s share has shown a volatility of 26,1% over the last year.
The risk free rate determined by the 10 year US governmental bond interest rate: 1,96%.
A timeframe in which the option can be exercised. Let’s assume a 10 year timeframe in line with the risk-free rate and an imaginable horizon for mere mortals.
The value of the underlying (or what Apple is investing in):
The return of the investment exercised with the cash at hand should yield a higher Return on Capital Employed (RoCE) than previously achieved to increase shareholder value. On the other hand, such a high cash pile also provides the flexibility to invest into lower return ventures. Such an investment would be taken if a certain technology or trend has been missed by management or becomes suddenly more important in the priorities of the company. In defensive moves or moat creating ventures, the expected return would be significantly lower or can even be negative. For the last twelve months, Apple has returned 106% in terms of operating income over its capital employed [3]. I use the return to value the underlying. For example, investing $81.6 billion in assets that yield 106% return equals a underlying value of $168 billion.
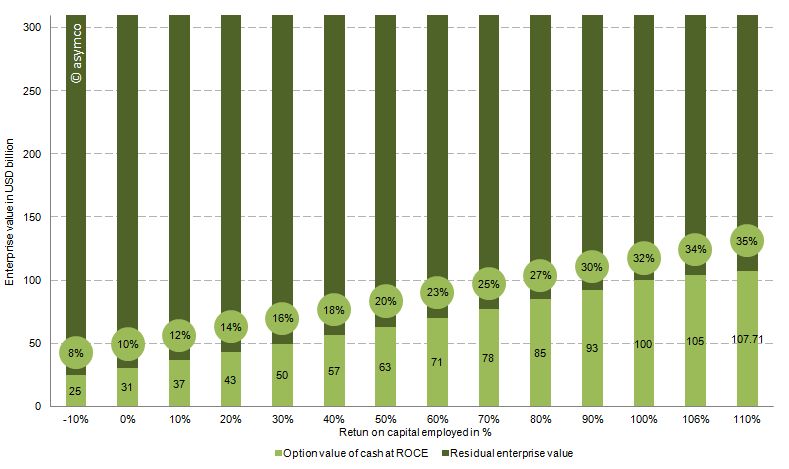
The chart below shows the option value of the cash as a percentage of enterprise value of Apple (at the time of writing $310 billion) based on the range of the expected return on capital employed. Or in other words, how much of Apple’s current value is explained by the option value in holding such a large cash reserve.
Conclusion
Therefore, with the assumptions above and a RoCE from -10% to 110%, between 8% and 35% of Apple’s current valuation is explained by the option value of cash. We can see that even with large variations of the key input variables, Apple’s enterprise value is partly explained by the option value of cash which, in turn, is attributable to the sheer amount of cash at hand.
If we look at the option value explaining 25% of Apple's enterprise value then 75% or $232 billion is the "Residual Enterprise Value" (REV) representing the value of Apple's cash flow generating operations. That puts Apple's valuation at 6.9x REV/EBIT 2011 or 6.5x REV/EBITDA 2011 -- fairly low relative to recent performance. EBITDA and EBIT have been growing at a rate of 70% for the last two years and at a rate of 84% over the last year alone.
It’s good to be king (http://5by5.tv/criticalpath/3) , Apple: Behold The ‘iEndowment,’ Says Wedgewood (http://blogs.barrons.com/techtraderdaily/2011/09/20/apple-behold-the-iendowment-says-wedgewood/)
Operating income of the last twelve month of 33.8 USD billion divided by capital employed of 31.8 USD billion defined as total assets minus cash (or sum of all asset excluding cash)
Yesterday Nokia warned that its guidance for the quarter and the year were "no longer valid." The surprise to me is that management was surprised. In February I warned that even if Nokia could fool consumers into buying products whose platform was publicly executed, distributors and operators would not likely go along with the deception. Pricing collapse is the proof of a channel breakdown.
That seemed predictable. What I struggled with was how Nokia itself could present such an optimistic forecast. Absent any explanation, Nokia's forecast of robust sales for Symbian products into the near future belies a failure of understanding of the dynamics of platforms and especially the impact of destruction of trust and brand value that commenced in February. Distress is a slippery slope and it does not model well in a spreadsheet. It takes a leap of non-linear faith to predict the piling-on effect on the up- and the down-side.
Faith in the company's guidance meant that the market reacted to the bad news by discounting Nokia down to a market cap of $26.7 billion. One analyst even cut his target price down to $4/share, 57% of yesterday's close. How can this fair? What is Nokia's phone business worth?
Here's a quick sum-of-the-parts analysis. After yesterday's hair cut Nokia's overall enterprise value is about $20 billion. The Navteq part of the business (purchased for $8.1 billion in 2008) could get a value of $3 billion (based on about 3x sales) and the value of Nokia Siemens networks could be at $6b (less than 0.5x sales). That makes Nokia's phone business worth about $11 billion.
An alternative view based on "the Motorola case study" $4 target price would imply an overall enterprise value of $11 billion. This either makes Navteq and NSN worthless and Phones worth $11 or it makes the phone business worth a lot less than $10 billion. Perhaps less than $8.5 billion which is what Microsoft paid for Skype. Should we be shocked? Nobody would argue that Nokia is worth more than Facebook so who's to say that Skype or Twitter aren't more valuable than a device company in crisis?
I don't try to predict the market's behavior, nevertheless, the markets are now very skeptical that there is much in Nokia to salvage. It's perhaps unfair and illogical but this is the end game of disruption. It ends much more suddenly than it begins. It's the consequence of nobody noticing the beginning that makes the end so shocking.
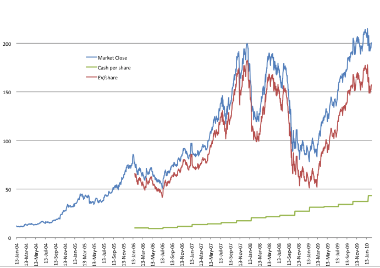
On Christmas Eve 2007 to be precise. That’s when the Enterprise Value/share was $181.5. These days it’s around $150. The Enterprise Value (EV) measures the value of future cash flows excluding current assets and is a better indicator of the potential of a company than its current overall value.
As you can see in the graph above, the cash per share (in green) has grown to $43 while back in late 2007 it was less than half that. As a result, although the market value for Apple peaked at $215 on 19th January this year (the blue line), the EV/share was only about $178 (the red line), below the all-time-high in 2007.
As Apple’s cash continues to grow, the gap between EV and MV will also grow. If the MV remains low (as the P/E is indicating) then the Enterprise Value, i.e. the net present value value of future cash flows, drops.
Did Apple’s prospects peak in 2007--six months after the iPhone was first launched--or is the current valuation still a function of sentiment of the overall economy, independent of the company’s fundamentals?
The fact that AAPL is less valuable -- in terms of the P/E ratio -- than the average S&P 500 company continues to baffle me.
Apple's P/E is a bit misleading because of the price "P" a large part is cash which should not be considered "at-risk" capital.
The logic of a P/E ratio is to measure how many years it might take to recover one's investment. The cash on the balance sheet is not at risk for this calculation. Therefore the Enterprise Value /Free Cash Flow is a more accurate measure of company value creation. Until the recent re-statement the FCF and Earnings were divergent. They have since become equivalent.
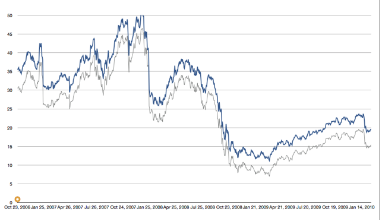
Therefore, if you take cash out, (currently $43/share) the Enterprise Value / Free Cash Flow for Apple is about 15. It had bottomed at 7 (now that we have restated data we can go back and re-calculate this).
The graph above shows the traditional P/E in blue and the EV/FCF in grey (using restated financials).
On a forward basis the EV/FCF is probably around 12 to 13.
Also of note is that Apple's EV/FCF is lower than the S&P 500 (at 23.52 at the end of Q4 2009.)
If we continue to use the S&P as a comparable, I looked up the estimates for quarter-end P/E for the S&P 500:
12/31/2011 17.15
09/30/2011 18.35
06/30/2011 19.97
03/30/2011 21.61
12/31/2010 23.00
09/30/2010 24.43
06/30/2010 22.57
03/30/2010 21.54
12/31/2009 23.52
Apple EV/FCF (and also traditional P/E) are lower than S&P on current and forward bases.
How do we read this? Is the market considering that Apple's prospects are less than the average large company? This does not quite make sense to me. What other theory could be at work to explain this valuation?