Asymco

Asymmetric Intelligence

forecast

  1. Revisiting the App Forecast

    Research

    From a forecast I made on March 21st: 300k Apps Approved by August:

    My initial estimate in February for the 200k milestone was by May 1st. I was clearly off by nearly 40 days. If the add rate is maintained at 20k/mo 300k will come around in August although I’m not as confident in this forecast. The rate of app addition seems to be accelerating.

    As of today the Approved app counts are as follows:

    AppShopper: 297,165

    148apps.com: 296,662

    148apps.biz: 296,157

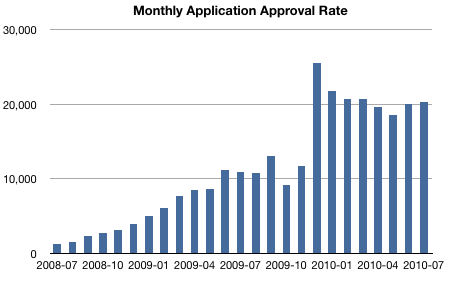
    The monthly rate of addition is shown in the following graph:

    The 20k/month has been steady during the last 7 months so I think the last 4k apps will be added in the next week, making the 300k roll-over in August, as forecast. The approval rate did not accelerate however but stayed pretty steady. There was a similar plateau in the middle of last year around 10k apps/month.

  2. Analyst production forecasts for iPhone and iPad

    Research · 7 comments

    On the iPhone, the firm raised their production forecasts from 14 million units to 18+ million, aided by easing constraints of display panels. Checks show consistent shortage of iPhone 4 inventory at Apple stores and there continues to be a three-week shipping delay from Apple's online store, the firm notes. As a result the firm has increased confidence in its 4QFY10 iPhone unit estimate of 11.6 million, which is up 39% sequentially.

    On the iPad, the firm's build forecasts were revised up from 6 million to 7 million, which compares to their iPad shipments estimate of 4.75 million. The firm believes [there] is upside to the Q4 estimates and CY10 estimates of 13.4 million units, given the strong demand and anticipated production ramp heading into the back-to school and holiday seasons, as well as the high level of interest from business customers as expressed by AT&T.

    via StreetInsider.com - All Apple (AAPL) Products Lines are Humming Along - Analyst.

    These sound reasonable and credible. Note that production forecasts don't translate into sales forecasts as there is inventory, and some of that inventory will be held by Apple and some by the manufacturer.

    My Q4 estimate sits at 12.1 million iPhones and 4 million iPads.

  3. Estimating Fourth Quarter Earnings for Apple

    Research · 4 comments

    We expect revenue to be about $18 billion compared to $12.2 billion in the September quarter last year. We expect gross margins to be about 35%...

    We are targeting EPS of about $3.44.

    via Apple Inc. AAPL Q3 2010 Earnings Call Transcript.

    That $18 billion figure is extraordinary.  Consider that last year during the same quarter, the company received $12.2 billion, then the sales growth forecast is about 50%.  Granted that even though Apple just achieved 61% sales growth last quarter, Apple management is unusually aggressive in underestimating.

    Given this, I am looking at the following forecast:

    • iPhone units: 12.2 million (65% growth)
    • Macs: 4 million (30% growth)
    • iPads: 3.3 million (flat sequentially, production constrained)
    • iPods: 9.4 million (-8% growth)
    • Music growth: 26.7%
    • Peripherals growth: 21%
    • Software growth: 8%
    • Total sales: $19.0 billion (56% y/y growth)
    • GM: 42.3%
    • EPS: $4.78 (73% y/y growth)

    If this estimate proves correct, then at the end of the quarter (Oct 1) the trailing twelve months' earnings per share will be $15.29.  That is equivalent to P/E of 16.82 on the back of four quarters of earnings growth (47%, 86%, 75% and 73% respectively).  The price/earnings excluding cash would be 13.4.

  4. 3Q review: Mac units grow 33%

    Research

    Apple Reports Third Quarter Results.

    I was surprised by the poor predictions of Mac units by the analyst community with estimates ranging from 2.86 million to 3.51.  It was fairly clear to me early in the quarter that the product would get 30%+ growth.  There was little news except overall Mac momentum to shape the forecast and it seemed logical that the growth would stay inline with the last quarter which was 32.8%. I dialed in 33% after the first month and stuck with this so my forecast came out to 3.46 million.

    In the event, 3.472 million were sold for a growth of 33.4%.  The ASP came in at $1,267, slightly down from $1,278 last quarter and $1,289 the year before. ASPs are eroding but Apple are holding the rate down with product updates. Looking forward, I'm forecast $1,300 ASP.

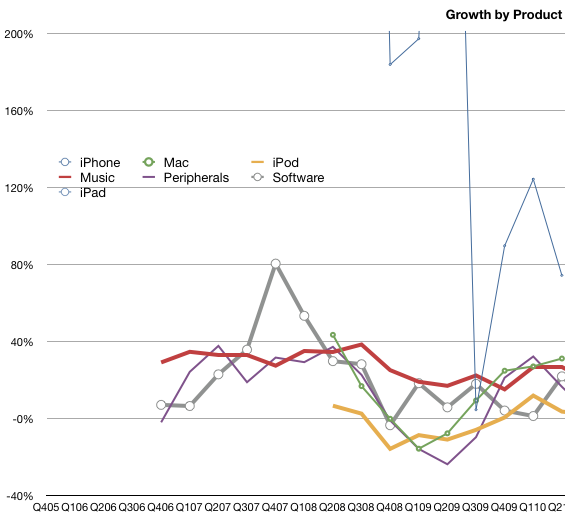
    I estimate gross margin for the Mac at 27%. This is down from 31% a year ago. Revenue growth year-on-year was 31%.  The Mac  franchise is still doing better than most PC vendors and is gaining share. The graph below shows the growth by product revenues.  The Mac is now the second fastest grower after the iPhone (the iPad is not included yet as these are y/y growth rates.)

  5. 3Q review: iPhone revenues grow 74%

    Research

    Calling the iPhone this quarter was going to be a challenge. This was a transition quarter where an old lead model would be replaced with a new one. The launch of the iPhone 4 was going to affect the volumes, but nobody could predict how. We've had a few such quarters and they were volatile. The number of sales days varied and the distribution of the old product was much different. The problem was compounded by the leak of the prototype and the uncertainties of launch day logistics. My forecast had been 8.5 million units.

    In the event, 8,398,000 iPhones were sold. This included 1.7 million iPhone 4s which means about 6.7 million 3GS phones sold. That's quite remarkable given the end-of-cycle timing.  8.7 million 3GS were sold in Q2 which means the sell-in was down only about 2 million for the transition.

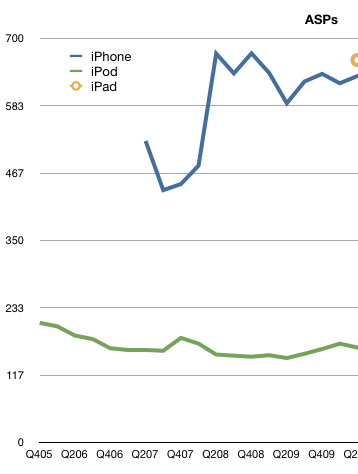
    The even more remarkable story is the average selling price. It came in at $635.15. The iPhone has ranged from $437 to $674 ASP over the last three years (see chart). This figure places it near the top of the range, a great performance for the end of a product cycle quarter.

    I estimate gross margin at 56%, a drop from the more typical 60% due to iPhone 4 launch. With revenues of $5.33 billion and cost of sales of $2.2 billion, Apple created operating profit of $3.13 billion--we'll take a look at that number relative to other vendors later.

    Growth year-on-year were 74% for revenues and 61% on units. For a transition quarter, these numbers are spectacular. For comparison, during 2009's transition quarter (Q4) revenues grew at 5% and units 7%. Furthermore, according to Apple's management, iPhone unit sales in the June quarter were running 90% above the year-ago period prior to the company draining thechannel ahead of the iPhone 4's release. In the December and March quarters, unit sales were 100% or more above prior-year results. This means that 100% growth is sustainable though going forward I'm keeping forecast at 65% growth.

    Seventy percent revenue growth cannot be seen as anything other than a sign of rude health.

  6. Accuracy of Apple unit volume forecast

    Research

    From Apple's FQ3 press release:

    "Apple sold 3.47 million Macs during the quarter, representing a new quarterly record and a 33 percent unit increase over the year-ago quarter. The Company sold 8.4 million iPhones in the quarter, representing 61 percent unit growth over the year-ago quarter. Apple sold 9.41 million iPods during the quarter, representing an eight percent unit decline from the year-ago quarter. The Company began selling iPads during the quarter, with total sales of 3.27 million."

    My unit forecast.

    In millions of units.

    Product Asymco Actual Diff Error
    iPhone 8.500 8.398 0.102 1.2%
    Mac 3.462 3.472 -0.010 -0.3%
    iPad 3.300 3.270 0.030 0.9%
    iPod 9.398 9.406 -0.008 -0.1%

    Rankings of various analyst forecasts are at :
    Deagol's blog.

  7. Analysts predict iPad sales (part III)

    Research

    Apple Sells Three Million iPads in 80 Days - Yahoo! Finance.

    After 1 2 3 million units sold in 28 60 80 days, it’s time to review the analysts’ predictions:

    First year iPad unit forecasts (sourced from TMO Finance Board)

    • Brian Marshall, Broadpoint AmTech 7.0
    • David Bailey, Goldman Sachs 6.2
    • Kathryn Huberty, Morgan Stanley 6.0
    • Shaw Wu, Kauffman Bros. 5.0
    • Mike Abramsky, RBC Capital Markets 5.0
    • Gene Munster, Piper Jaffray 3.5
    • Ben Reitzes, Barclays Capital 2.9
    • Keith Bachman, BMO Capital 2.5
    • Jeff Fidacaro, Susquehanna 2.1
    • Chris Whitmore, Deutsche Bank 2.0
    • Scott Craig, Merrill Lynch 1.2
    • Peter Misek, Canaccord Adams 1.2
    • Doug Reid, Thomas Weisel 1.1
    • Yair Reiner, Oppenheimer 1.1

    Looks like at least half two thirds three quarters of these guys have already blown it.

    For the record, in January I forecast 6 million units for calendar 2010 (and 10 million in first year).  It looks like I'll be facing the iPad dunce corner as well.

    See: Analysts predict iPad sales Analysts predict iPad sales (part II)

  8. Apple considered less valuable than the average S&P 500 company [Updated]

    Research · 4 comments

    Apple just reached a new all-time closing high.  It's remarkable that so soon after a recession the stock is enjoying new highs.  The Dow would have to gain 40% to make the same claim.

    So some may ask whether Apple's stock is getting ahead of itself.  Perhaps it's showing signs of "irrational exuberance".

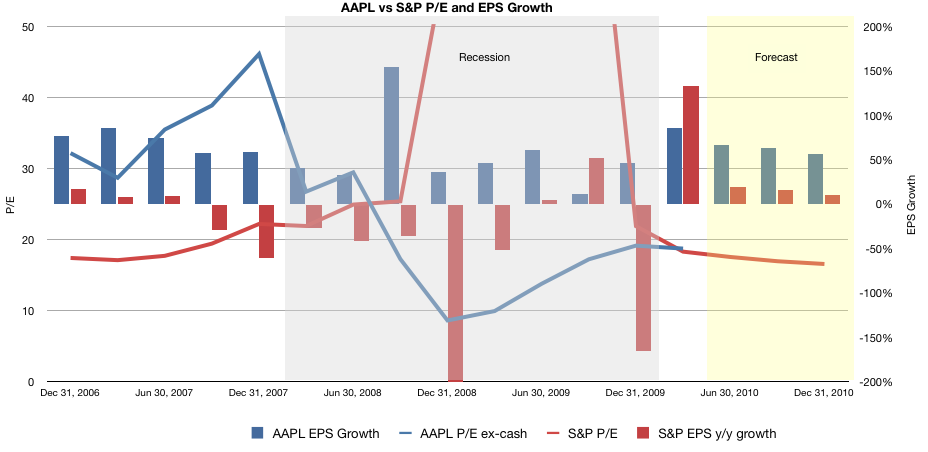
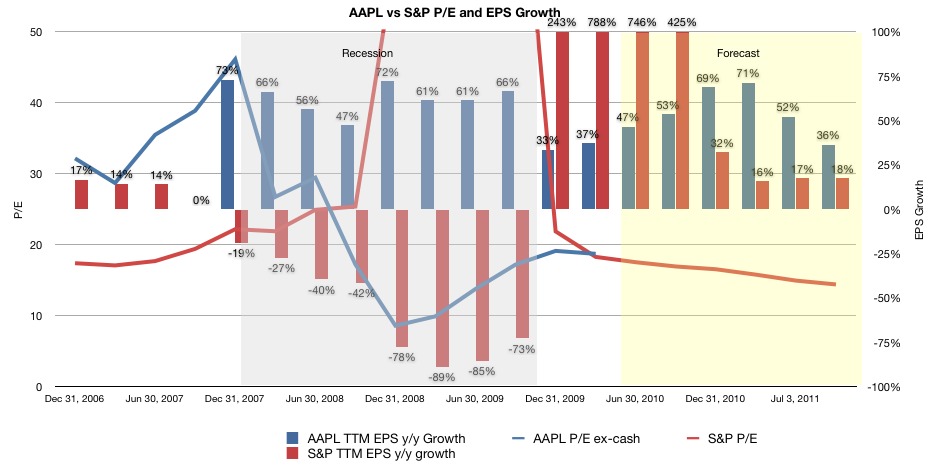
    This is not the case.  In fact, the stock is showing signs of irrational despondency.  This is demonstrated with the following graph.

    It shows AAPL Price (ex-cash) over Earnings vs. S&P P/E  (blue and red lines respectively on the left scale) overlaid with AAPL and S&P EPS growth (blue and red bars respectively on the right scale). I added grey shading to represent the recession period and yellow shading for the forecast period.

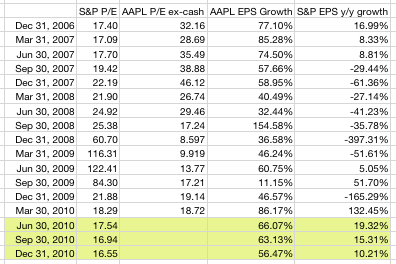
    [Updated] The same data is shown in the following graph where I used a 12 month rolling window (trailing twelve months) for the year-on-year growth to smooth out quarterly anomalies as per suggestion from Deagol in comments.

    Note how S&P earnings were indeed in a state of severe decline during the recession, and how the P/E gyrated wildly as a result. (I've had to clip the actual values in the graph for clarity but I include all the data in the table at the bottom of this article).  Post-recession S&P P/E began to return to normal at the beginning of this year and is forecast (by S&P) to align once again with the pre-recession growth in earnings.

    Now compare with what happened to Apple's stock.  Pre-recession the stock enjoyed a significant premium for growth.  The blue bars are significantly higher than the red bars in the 2006/2007 period and the blue line is naturally higher than the red line in the same period.

    During the recession, Apple continues to grow but the P/E drops to remarkably low levels (10).  Although Apple's earnings growth does diminish, it never goes away.  The anomalous growth in the third quarter of 09 is 11% due to the huge spike the year earlier with the launch of iPhone 3G.  Overall, the company continues growing at a good clip.

    Not so for its P/E however.  Even after the recession ended and AAPL accelerated growth to above 50% again, the P/E remained around 20.  I left out the forecast from the AAPL line so that readers can imagine their own.

    The bottom line is that at the new all-time high, Apple's shares are trading at a discount to their growth.  Not only lower than than Apple has enjoyed historically, but lower than the average of 500 of the largest companies in the US.  Those companies having earnings growth in the teens have recovered their valuation.  Apple with growth returning to above 50% hasn't.

  9. New data on iTunes: 11 billion downloaded

    Research

    When Steve Jobs announced 150 million accounts with credit cards on the iTunes Store, iBookstore and App Store, he stated that as far as he knows it has "the most accounts of any store on the web".

    More interesting is the claim that iTunes has enjoyed 16 billion downloads.

    Subtracting the 5 billion app downloads, that leads to Music+Video adding up to 11 billion (books at 5 million is still too small to make an impact.)

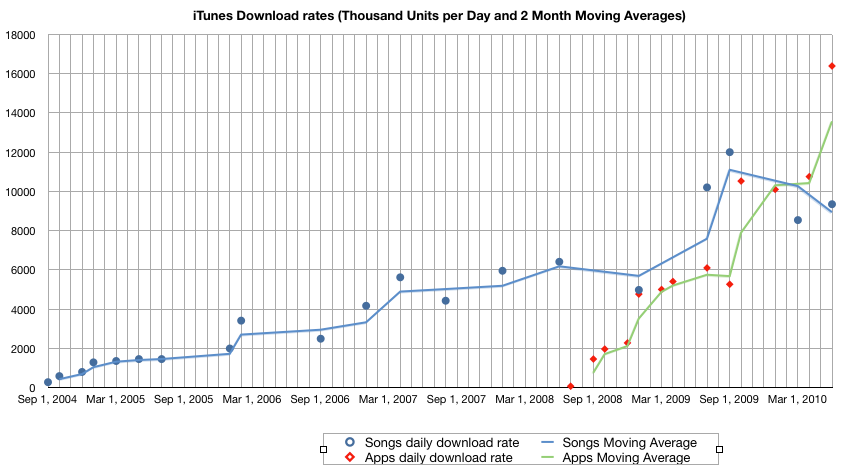
    The last download data on iTunes was in February when Apple reported 10 billion songs downloaded. The new data implies the daily download rate is about 9.3 million per day.  The forecast I had suggested 11.1 billion by June 1 so it's come in a bit less than expected.

    12 billion songs is expected in September.

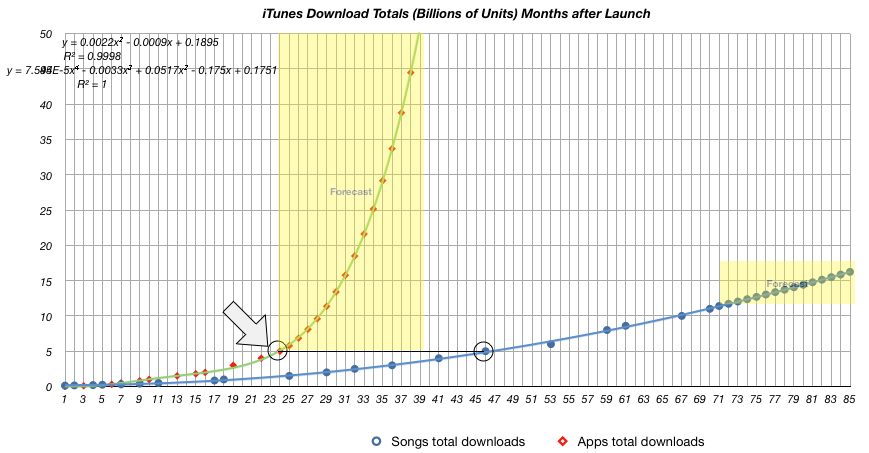
    The graph that follows shows actual and forecast cumulative downloads for the App Store and iTunes store based on months after launch.  As it shows, 5 billion apps took 24 months whereas 5 billion songs took 46 months.

    This graph shows the download rates.  The green line (apps) clearly overtakes the slowing blue line (songs/media).

  10. Analysts predict iPad sales (part II)

    Research · 6 comments

    After 12 million units sold in 28 60 days, it’s time to review the analysts’ predictions:

    First year iPad unit forecasts (sourced from TMO Finance Board)

    • Brian Marshall, Broadpoint AmTech 7.0
    • David Bailey, Goldman Sachs 6.2
    • Kathryn Huberty, Morgan Stanley 6.0
    • Shaw Wu, Kauffman Bros. 5.0
    • Mike Abramsky, RBC Capital Markets 5.0
    • Gene Munster, Piper Jaffray 3.5
    • Ben Reitzes, Barclays Capital 2.9
    • Keith Bachman, BMO Capital 2.5
    • Jeff Fidacaro, Susquehanna 2.1
    • Chris Whitmore, Deutsche Bank 2.0
    • Scott Craig, Merrill Lynch 1.2
    • Peter Misek, Canaccord Adams 1.2
    • Doug Reid, Thomas Weisel 1.1
    • Yair Reiner, Oppenheimer 1.1

    Looks like at least half two thirds of these guys have already blown it.

    For the record, in January I forecast 6 million units for calendar 2010 (and 10 million in first year).  It looks like I'll be facing the iPad dunce corner as well.

    See: Analysts predict iPad sales

  11. IDC: I Dream of Claim Chowder

    Research · 3 comments

    A few eyebrows were raised when Microsoft presented a slide at a French event where they made the claim that 30 Million Windows Phone devices would be sold by the end of 2011.  Given that the first Windows Phone won't ship until October 2010 at the earliest, or, according to Mr. Ballmer, "by Christmas," count me among the skeptics.

    However, the claim was later retracted by Microsoft stating that they mis-quoted IDC, the original source for the forecast.  The correction was perhaps meant to put an end to the credibility crisis.

    However, the actual forecast from IDC was even more preposterous. Apparently IDC makes the forecast that 32 million "Windows Mobile" devices will sell during all of 2011--a combination of both Windows Mobile and Windows Phone devices.

    Instead, the research company forecast 2011 sales of 32 million devices running all Windows Mobile operating systems. This includes expected sales of devices with Windows Mobile 6.5, which is already on the market. IDC has not given any sales estimate for Windows Phone 7, which Microsoft has said will be available in the fourth quarter.

    Their report showed about 16 million Windows Mobile devices shipped in 2009, with a forecast of 22 million this year and 32 million next year.

    Windows Mobile shipped a total of 3.7 million phones in 1Q10, so in order to reach 22 million this year they need to ship 18.3 million for the rest of the year or, on average, 6.1 million phones a quarter.  That's a higher number than what Android shipped in Q1 with BOGO promotions (5.2m units). That's almost as high as the launch quarter for the iPhone 3G.  And all this (mostly) with WinMo 6.5!

    Alternatively perhaps IDC foresees a huge launch for Windows Phone. Assuming an erosion of the WM6.5 to 2.7 m this quarter, 2 million in Q3 and 2 million in Q4, then Windows Phone would somehow need to ship 12 million units during the last quarter.  This number is higher than what iPhone sold in its highest ever quarter.

    This sounds sillier than 30 million Windows Phones in 2011.  By claiming that Microsoft's combination of deprecated Windows Mobile (6.5) and unreleased Windows Phone 7 will continue to sell at a growth of 38% this year, they are actually suggesting an acceleration in sales going into the second half at a rate higher than what the market is likely to grow at.

    In other words, they are suggesting that Microsoft will gain share during the rest of this year. Share gains for a platform that has declined in share in Q1 from 10.2% to 6.8% with 3.7 million units sold on the back of further share losses the quarter prior. Share gains against Android that competes with a free license. Share gains with a new platform that has no clear differentiation vs. the iPhone.