Here is a discussion of the changes since the last analysis:
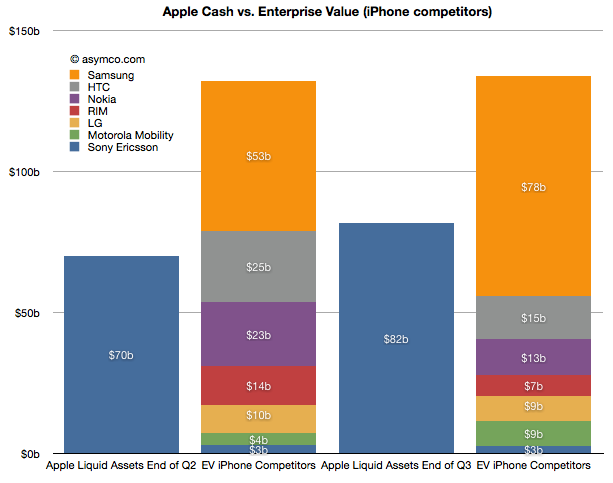
Sony Ericsson was valued through its acquisition by Sony. We did not have a way to value the enterprise before as it was not traded independently. Last June I estimated a 14x multiple on its trailing twelve months' profits and got $3.0 billion. Since then half the company changed hands for about €1.05 thus yielding a total company value of $2.8 billion. The enterprise value should be therefore slightly lower but I'll stick with the current transaction value as the EV.
Motorola Mobility has entered into an agreement to be acquired by Google for $12.5 billion by Google. The company's enterprise value jumped as a result to about $8.6 billion.
RIM's share price collapsed and it's now also trading at an EV of about 7.3 billion (Yahoo finance).
Nokia's price has also dropped and it now has an EV of about $13 billion (Yahoo finance).
HTC recently dropped significantly in price and is now worth about $15 billion EV. (Note that pricing of its equities is subject to suspended trading due to drop limits).
LG's phone business is still losing money and it's still difficult to value. In November it was revealed that the company was seeking to raise $890 million in capital to fund new initiatives including smartphones. The share price fell by 14%. In June I suggested a nominal value for the phone business of $10 billion. I think that's very generous and with recent events I would place that value at $9 billion today.
Samsung's fortunes have increased. In June I applied a 14x multiple to their trailing 12 months' operating earnings. Given overall discounting of the sector I applied a multiple of 13 today. That yields a business value of $78 billion. Interestingly, that is larger than the value of all other competitors apart from Apple. That also makes it six times more valuable than Nokia.
Apple's cash and cash equivalents and investments grew by about $12 billion and were worth about $82 billion as of October.
In summary, in June Apple's cash was about 53% of the sum of competing phone vendor enterprise values. Today it's about 61%. Excluding Samsung, Apple could buy the industry and still have $25 billion left over. This makes the claim that "Apple could buy the industry" even more believable.
This analysis is mainly academic. It does not imply that any such transaction will take place. As the purchase of Motorola shows, control has a premium and individual buyers may be less "rational" than markets. What it does show however is that the entire industry is in a state of crisis. Valuations for phone companies are collapsing and two major brands (Motorola and Sony Ericsson) are being absorbed and could disappear.
At the same time entrants are arriving with completely different business models. Amazon, Facebook, Baidu, Alibaba are intent on selling phones or platforms to be valued as enablers for asymmetric business models rather than as phones. One could argue that what Apple itself sells is more than hardware and that its value-add "on top" of hardware is increasing. This is a sign of commoditization. Certainly the voice business is well beyond that point but it now appears that even the smartphone business is already in an advanced state of value compression.
All the while the overall market is growing. I had separately looked at the profit pool and concluded that the brands are suffering. Summing up the votes from stock markets, the sentiment is even worse. 2012 is looking more and more as a year of inevitable and dramatic industry change.
On October 27th, Nintendo published half year results for the fiscal year ending in March 2012. Management stated that the company lost over $900 million with a negative outlook. Nintendo cited weaker than expected sales of Nintendo DS hardware and 3DS software and Yen appreciation as the main reasons for the miss. Is this the end of Nintendo?
Before we look more closely, here is a quick summary: The company is exclusively involved in selling game hardware and software. Their console platform is the Nintendo Wii, which will be followed by the Wii U late in 2012. The Nintendo DS and Nintendo 3DS are the company’s portable game consoles. The Wii and the DS are nearing the end of their product cycles. On the software side, the company is known for gaming titles such as Super Mario and Zelda. Nintendo also pioneered the licensing model to allow third-party developers to produce games for its hardware products.
A closer look
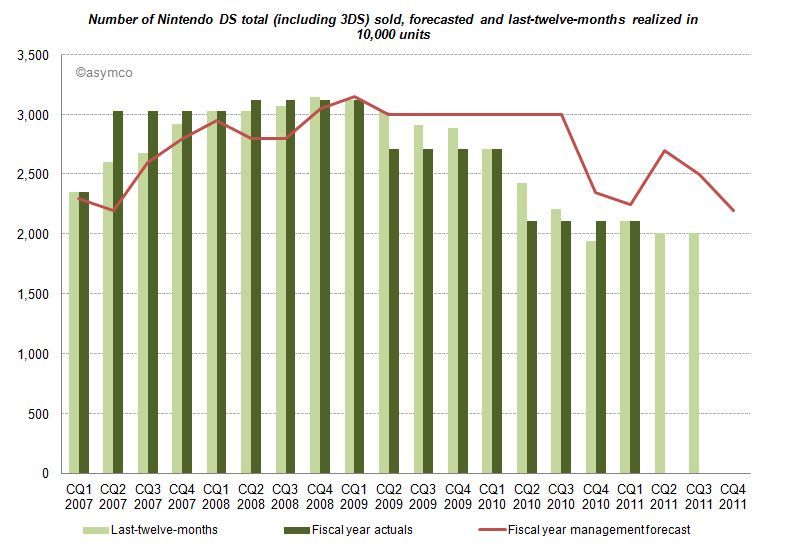
The good news for analysts is that Nintendo publishes their estimates for hardware and software unit sales. This allows us to measure management predictive accuracy. The red line (management forecast) should be as close as possible to the dark green pillars (realized unit sales in the fiscal year).
Until CQ1 2009 devices sales grew in excess of forecasts. A similar pattern can be found for consoles and game titles. After Q1 2009 forecasts have been always higher than results, and more worryingly, the deviation between forecast and sales is widening. Management missed and lowered forecasts for two consecutive years. Management's hope for an increase on the back of initial 3DS sales in the launch quarter (CQ1 2011) did not come to pass and they subsequently lowered forecasts again in the following two quarters.
Looking at all categories, management lowered forecasts almost continuously. The deviation remains the largest in the portable hardware business segment indicating that management was largely surprised about the development.
What caused this reversal of fortune?
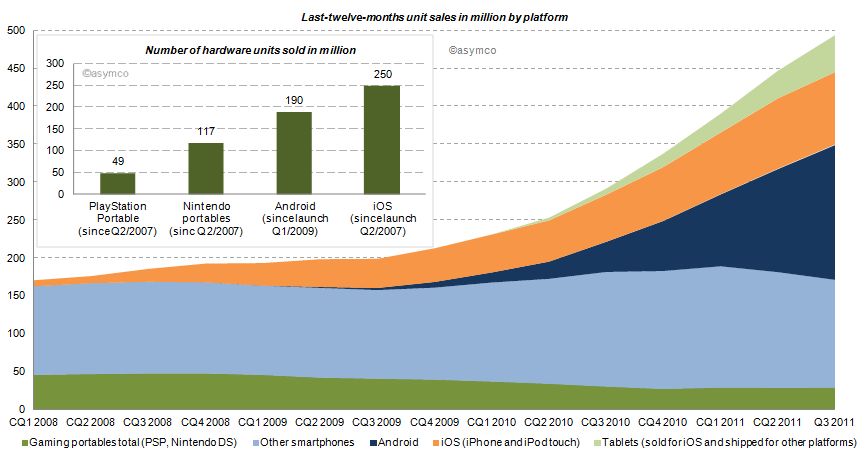
Two years earlier the iPhone had launched and by CQ1 2009 iOS reached an installed base of about 38 million, half the number of Nintendo portables in the same period. Furthermore, in CQ1 2009 Android phones came to the market. Smartphones (light blue area of the chart below) sold before (and after) the debut of iOS, but the iPhone redefined the category and an avalanche of smarter phones running iOS and Android followed (blue and orange area). Portable gaming devices from Nintendo and Sony declined ever since: 17% in 2009, 31% in 2010 and already 16% in the last twelve months.
How do the game players stack up?
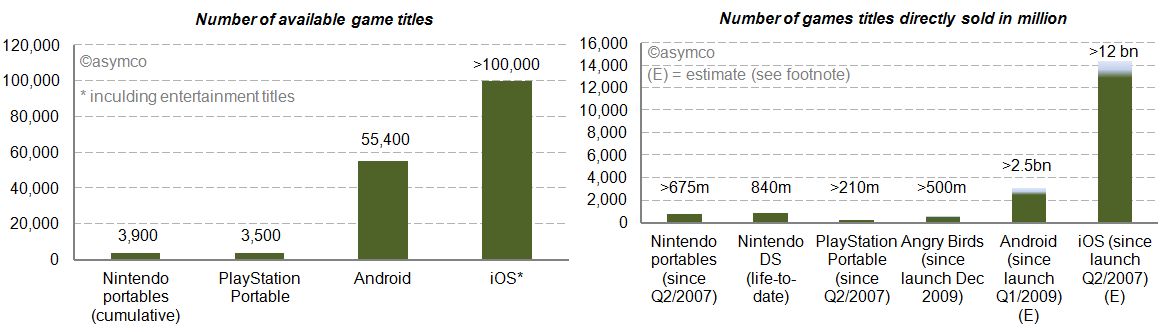
We already looked at the installed base in the chart above. iOS and Android have outsold Nintendo portable units by a factor of 2.1x and 1.6x. Furthermore, we can see (in the charts below) that the two main mobile platforms have 14 to 26 times more game (and entertainment) titles available. Nintendo and Sony also publish unit sales of directly sold software titles. For Android and iOS we know the cumulative app download statistics. By taking the share of Septembers’ paid and free app downloads as a proxy, we can conclude that also by this measure Android and iOS dwarf Nintendo and Sony [1]. The reach of iOS and Android is further underlined by the more than 500 million downloads of Angry Bird game titles - first released only two years ago - for any platform having sold more than twice the amount of Sony’s cumulative portable game titles and almost as many as Nintendo’s cumulative games titles since Q2/2007.
Who else has skin in the game?
Besides Nintendo, Sony, Apple and Google, who else is making a push into mobile gaming? Before investigating, let’s first have a closer look at Sony. Sony, just like Nintendo, is also active in stationary gaming segment with the PlayStation franchise. The Sony group also has access to entertainment most notable through Sony Pictures Entertainment and Sony Music Entertainment. Furthermore, Sony recently decided to buy Ericsson’s stake in the mobile phone joint-venture Sony Ericsson and is making a push with Android to bring its gaming titles as a differentiator for its own products to the platform. And the other major suspects? Microsoft, also active in the stationary gaming segment with its Xbox franchise, is pushing to bring the Xbox experience to mobile phones with Windows Phone. Amazon has retailed software and games for years and has started to distribute software and games via direct download on its own Kindle devices but also for the Mac. On the Kindle, Amazon is relying on a forked Android version on which it leverages its eBook and other entertainment assets. And then there is Facebook, a social network that wants to be on any platform or device. Out of 800 million users, 350 million access Facebook via a mobile device. Around 50% of Facebook members play games on the desktop. With Project Spartan, Facebook is aiming to bring the desktop experience to the mobile device including a stronger focus on gaming and video.
The competition between Apple and Google is already asymmetrical. Including the other contestants in the competitive landscape reveals Nintendo’s key weaknesses in the portable gaming market: attraction as a platform for developers in terms of ease and reach, pricing of hardware competing with operator-subsidized mobile phones and the jobs-to-be-done or value preposition. The new generation of mobile devices is standing against Nintendo’s dedicated approach. Although slowly adding features such as a browser and “app store” to its portables, Nintendo devices fall short in the variety of jobs-to-be-done compared to smartphones, let alone making a call.
Average selling prices and financial impact
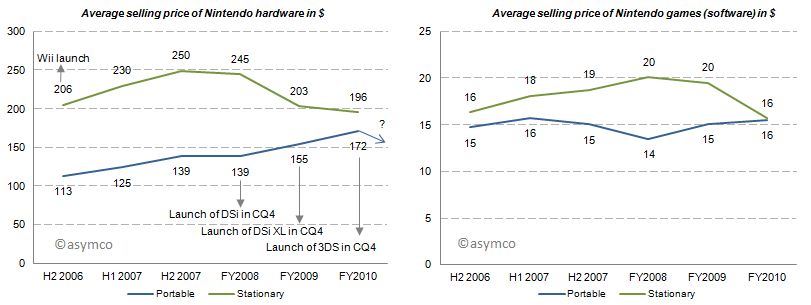
With this market pressure one would imagine that average selling prices decreased for Nintendo portables. But for the last three fiscal years average selling prices for portables have increased, all things equal, mainly due to new product launches. Game title’s average selling prices have remained relatively flat. Note that these are wholesales prices for hardware and a mix of retail and wholesale prices for games. In 2011, for which we do not have data yet, the price of the newest portable, Nintendo 3DS, was lowered from its U.S. debut of 320 250$ in February to 170$ in July which will have a negative impact on ASP going forward.
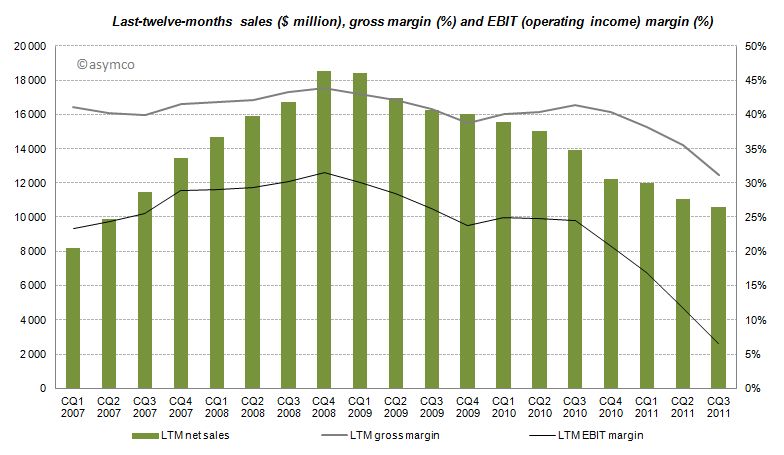
The effects of Nintendo’s rigid strategy and the fast changing competitive landscape are manifested in the devastating financial performance over the recent quarters with LTM sales, gross margins and EBIT margins declining starting from CQ4 2008 and even accelerating to decline after CQ3 2010.
Furthermore, even though the company has recognized its own difficulties, Nintendo has no intention of adjusting its strategy:
CEO Iwata on the question of whether Nintendo plans to bring its game library to other platforms:
This is absolutely not under consideration. If we did this, Nintendo would cease to be Nintendo. Having a hardware development team in-house is a major strength. It’s the duty of management to make use of those strengths. It’s probably the correct decision in the sense that the moment we started to release games on smartphones we’d make profits. However, I believe my responsibility is not to short term profits, but to Nintendo’s mid and long term competitive strength.
Although realized and obvious, the disruption’s invisibility is often manifested in the paralysis of the incumbent.
Conclusion
According to Isaacson, Steve Jobs apparently always worried who could eat Apple's lunch. The lunch of the iPod, he concluded, was ripe for mobile phones. Subsequently, Apple entered the mobile phone space. Google followed. Since then more powerful mobile phones have eaten the lunch of the dedicated gaming device. The jobs-to-be-done and their priorities in people’s life have not changed, but the tools people use to get them done have. Permanently.
---
Notes:
Estimated by multiplying total cumulative app downloads with September’s share of game downloads: For iOS ranging from 72-80% based on Top 150 free and paid app downloads, for Android ranging from 38-47% respectively. This is a very crude estimation, but the gist of it is that 4% for iOS and 11% for Android game downloads as percentage of cumulative app downloads would outsell Nintendo.
In his recent posts Horace took a look at Apple’s fixed assets and their development over the recent years. He also tested the hypotheses that Apple is making investments into machinery & equipment on which iOS devices are produced by overlaying iOS volumes with preceding changes in property, plant and equipment (PP&E).
The question that has arisen is: Are Apple’s investments in PP&E extraordinary?
To answer, I have compiled the capital expenditures (CapEx) for our previously established peer group [1].
But first we need to clarify what CapEx include and not include. CapEx includes investment into property, plants, equipment, office furniture, larger IT hardware and in some cases patents; CapEx do not include investment into long-term marketable securities or other long-term financial instruments, acquisitions or capitalized R&D. Furthermore, CapEx are gross values and are not net of any sold equipment [2]. CapEx are largely depending on a company’s business model and strategy. For example if you are a manufacturer you need equipment to operate, if you are a software company or a retailer, your business will not be capital intensive.
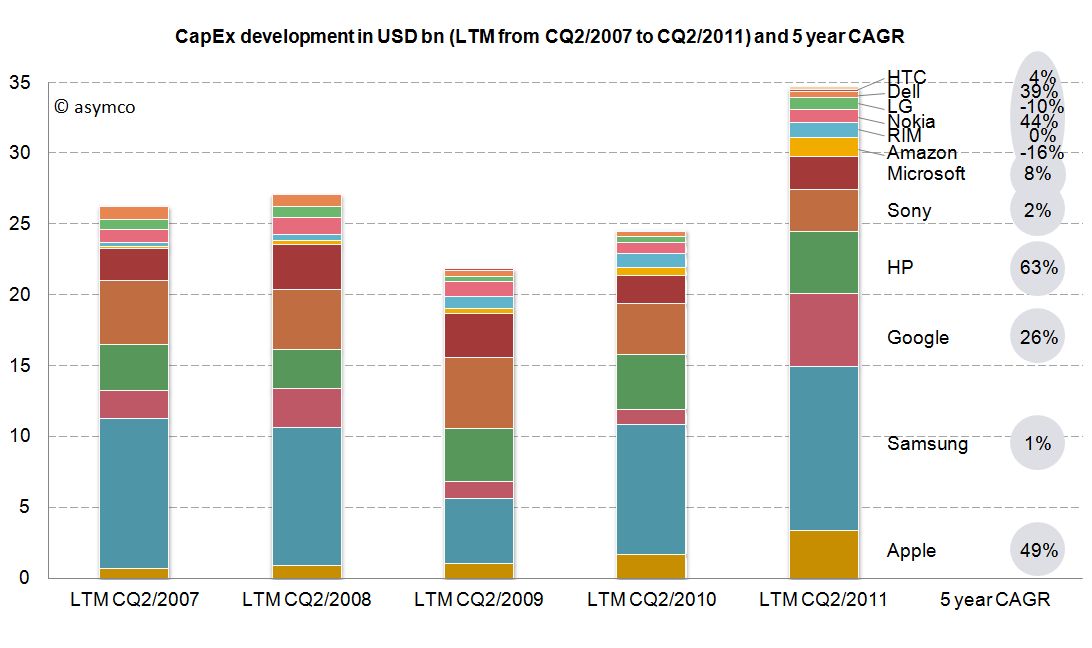
As the second calendar quarter of 2011 is the latest quarter for which all companies have reported figures, we will take a look at last twelve months’ (LTM) figures from Q2/2011 backwards. The following stacked bar chart shows the combined CapEx of our peer group:
The combined capital expenditures of our peer group for the LTM CQ2/2011 have outpaced even pre-crisis levels of investments and, combined, account for $34.7 billion. Samsung, a diversified manufacturer of IT hardware and other equipment, has invested more than $11.6bn with Google ($5.1bn), HP ($4.4bn) and Apple with $3.4bn following in line. While Google’s CapEx mostly account for its infrastructure of server farms and other IT hardware, HP’s CapEx mostly account for IT hardware it leases to its customers [3]. In absolute terms, Apple takes fourth place in CapEx spending for the last twelve months ending in CQ2.
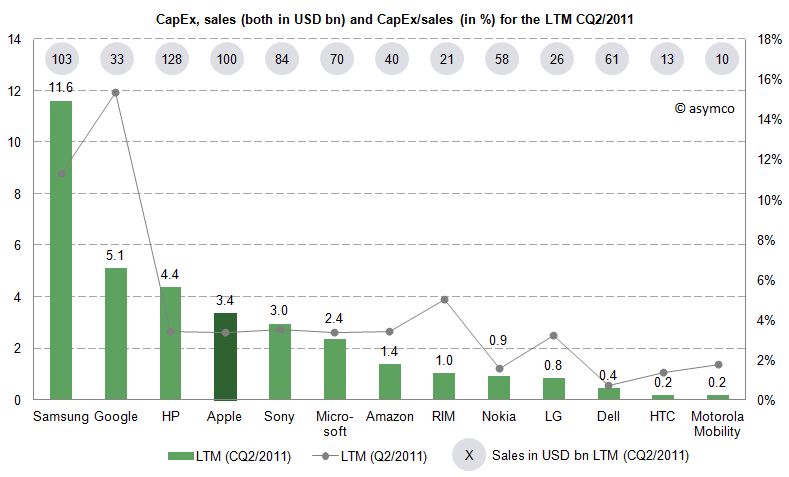
Since the business model and sales magnitude varies largely in our peer group, we can also take a look at a common measure to compare CapEx intensity by dividing CapEx by sales achieved in the same period. For the last twelve months we can depict the following chart:
The average of the peer group accounts for 4.4% of CapEx over sales. Samsung’s and Google’s business model are clearly more capital intensive, while Apple’s CapEx ratio of 3.4% is below the peer group average but above some of its peers like Nokia, Dell, LG, HTC or Motorola Mobility. Interestingly, capital intensity of HP, Apple, Sony, Microsoft and Amazon is at a comparable level of around 3.4%.
As noted before, business models and strategies are significantly different among companies in our peer group. However, while Apple’s CapEx intensity is not extraordinary, Apple’s CapEx in absolute terms are among the largest in it this peer group and have grown constantly throughout a five year period.
Is this a good thing and why does it matter?
CapEx by itself does not tell us much. We still do not know in what companies specifically invest as financial regulations do not require detailed CapEx accounts. We know that even if a company is not growing assets they need to be maintained, upgraded and replaced – this spending is also called "Maintenance CapEx". Everything else can be called "Expansion CapEx" associated with new product launches, entry to new business area or geographies or expansion of (manufacturing) capacity.
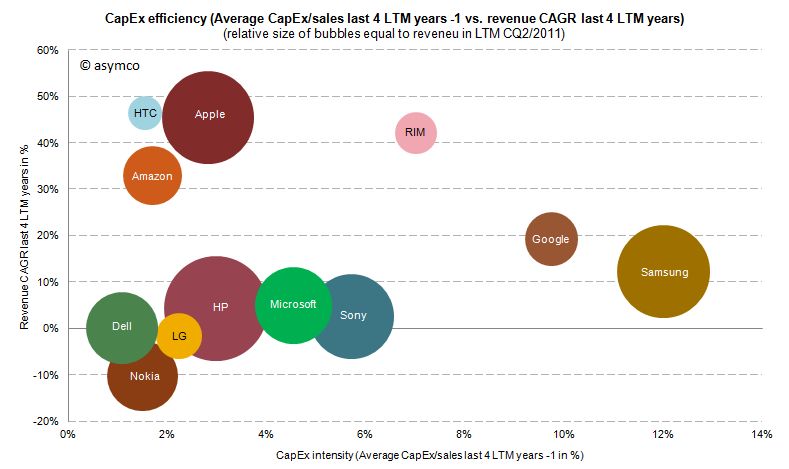
Therefore, Expansion CapEx is closely linked to expected organic sales growth in the future. So let’s go ahead and link CapEx ratio of the previous years with the sales growth of the following year. The following chart shows the cumulative average growth rate (CAGR) over the last four years versus the average of CapEx/sales ratio of the four last preceding years:
We can see that high CapEx efficiency has been achieved by Amazon, Apple and HTC with sales growth rates of 33-47%. RIM reached similar revenue growth but with higher CapEx intensity. Google and Samsung with high CapEx intensity have only reached modest growth rates. Dell, HP, Microsoft and Sony have not grown significantly but have close to average CapEx intensity.
We cannot state that CapEx in absolute terms have been extraordinary for Apple, but we can witness that with below average CapEx/sales ratio Apple outgrew in absolute terms Dell, LG, Microsoft, Nokia and Sony and has grown close to the revenue size of Samsung and HP in the last four years.
---
Notes:
Excluding Lenovo (not reported) and Acer (extra-ordinary low numbers reported, to be investigated), Motorola Mobility figures only available for the last six quarters
Minor differences may occur due to local Generally Accepted Accounting Principles (GAAP)
HP assumes ownership of these assets and rents them to the customers who in turn have a smaller balance sheet and can run IT hardware CapEx through the income statement as lease expenses
In the last two posts (How much does an Apple store cost?, The down payment on iCloud) I discussed two line items in the PP&E asset class on Apple's Balance Sheet. In isolation, the data is interesting as it gives us an idea of the cost structure of stores and facilities being developed to sustain its current business model. In aggregate, it provides insight into Apple's strategic intent.
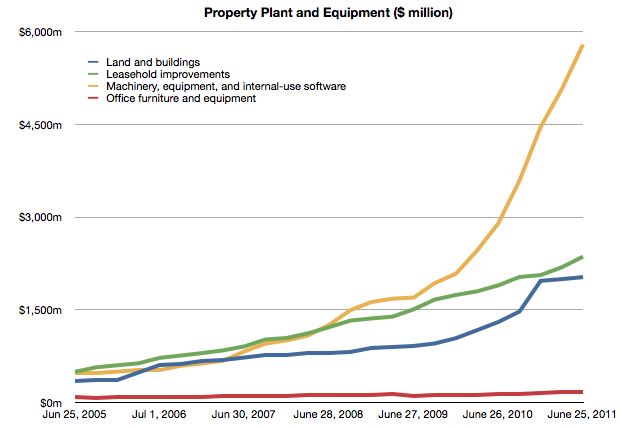
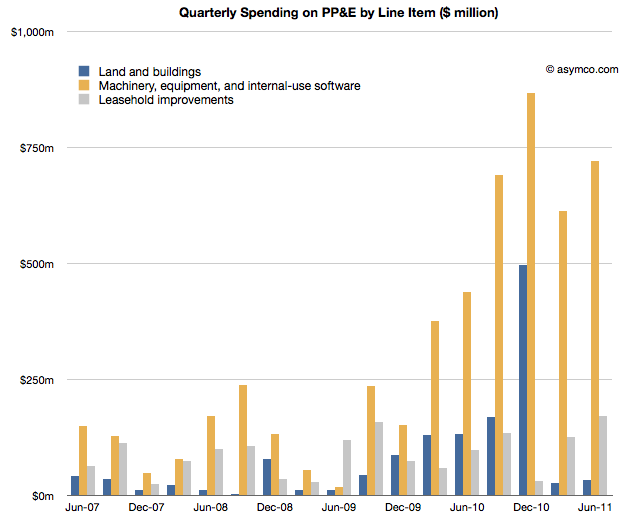
To complete the picture, I will look at the third asset: "Machinery, equipment and internal use software." It's the yellow line in the chart below:
It's plain to see at first glance that it's the most significant asset. What does it represent and what conclusions can we draw about Apple's strategy?
Before I begin, I should make clear what this asset represents and what it does not represent. These expenditures cover equipment used in production. They do not include components used in the production nor loans to suppliers for purchasing equipment. These are fixed assets that can be depreciated on a schedule and have specific tax treatment as a result. These are, in plain language, instruments used for producing things to be sold. They are things Apple owns.[1]
Using the same method as in the other asset analyses I took a measure of the sequential change in that asset over the time period and tried to see if there is a correlation between that spending and some other measure of output from the company.
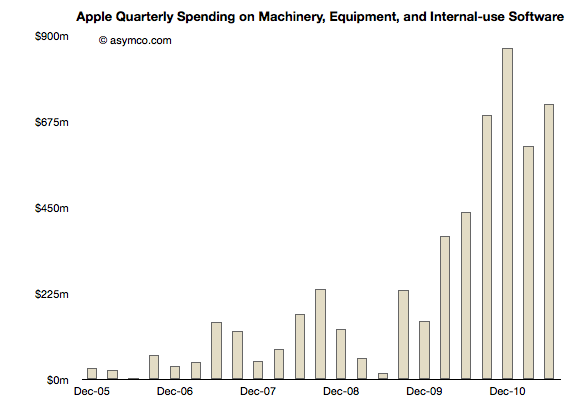
Here is the sequential change chart since the end of 2005:
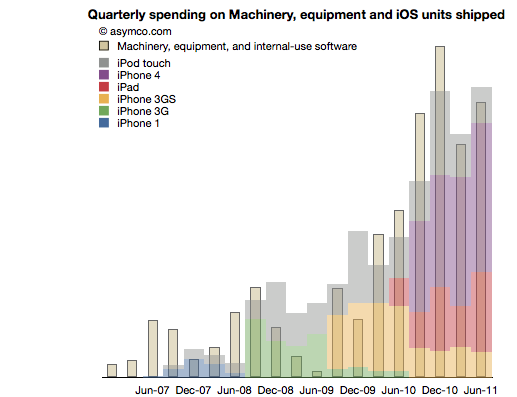
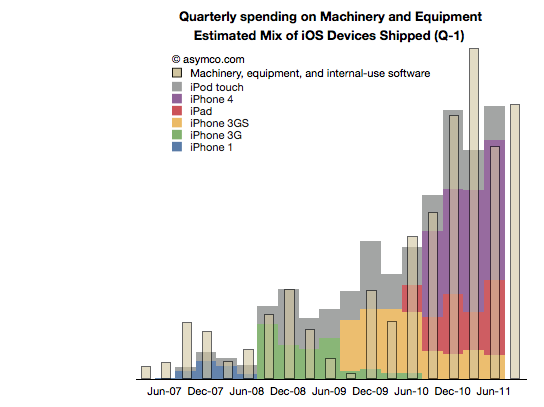
I noted that the pattern seems to relate closely with the increase in shipments of iPhones. More specifically, iOS devices. To test this I overlaid the overall volumes (with estimates of product types) of iOS shipments. This is a modified version of the chart published here.
There is a broad similarity. But again, as in the other analyses, the spending on assets typically predates the "output" from that asset. As we saw in land and buildings, the operational start of a facility may happen many quarters after the purchase is made. Similarly, stores open some time after the spending on fitting them out.
So it is with Machinery and Equipment. If we time-shift the output one quarter to account for spending before production we have a better fit (note the change in the title with "Q-1" indicating that the dates for the iOS shipments are offset by 1 quarter to the left).
We can even take the analysis further by breaking the spending and output into Phases corresponding to specific product cycles and introductions.
Phase 1: The original iPhone
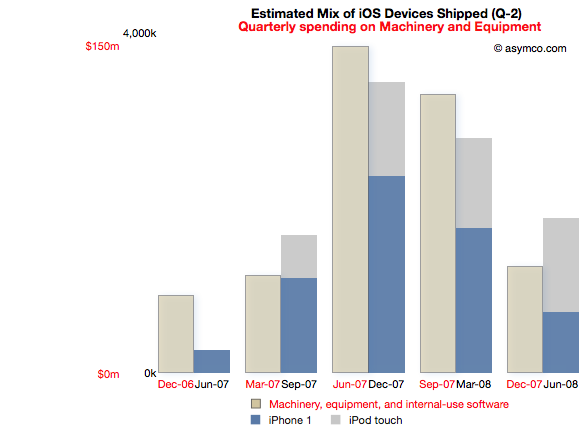
Spending on M&E prior to the iPhone launch began two quarters in advance of sales. The following chart reflects this delay. Note that the M&E payments are marked with quarters ending six months earlier than the shipment schedule. Note also the scale (red denoting the M&E spending and black the units shipped). I also separated the two product types (iPod touch are my estimates, iPhone numbers are published by Apple).
This Phase corresponds to the first "bump" in the expenditure chart but offers more detail. There is an evident relationship between the "input" expense and the "output" of units shipped.
The cost of Phase I was $408 million.
Phase II: The iPhone 3G series
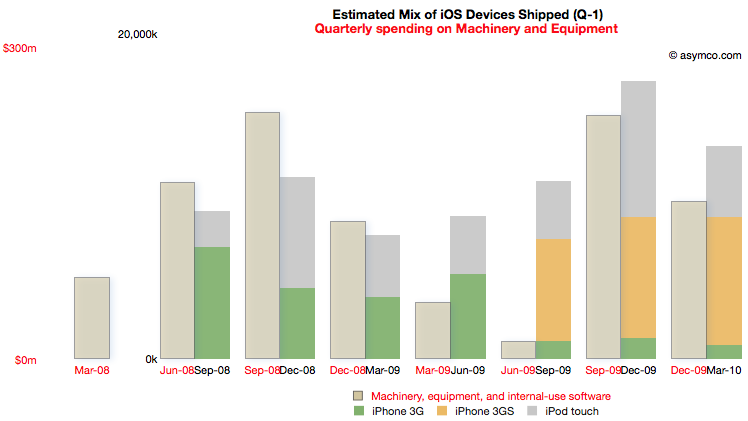
Phase II covers spending from the quarter ending March '08 to December '09 and production from September '08 to March '10.
For this Phase the time shift is only one quarter but there is a quarter's worth of spending that is initiated prior to any shipments. I chose to demarcate this Phase to cover production for both the 3G and 3GS as they probably shared a lot of common equipment. Some spending on new production lines however still had to happen as volumes increased during 3GS production.
Note the scale change from the first Phase. Whereas the maximum in Phase I spending was around $150 million per quarter, the peak is nearly twice as much in the second Phase. The peak output is 5x higher.
The cost of Phase II was $1 billion.
[I had to guess whether the Sep 09 and Dec 09 M&E spending was for 3GS or whether it was to prepare for the ramps in the new products about to be launched in the third Phase.]
Phase III: The iPhone 4 and the iPad
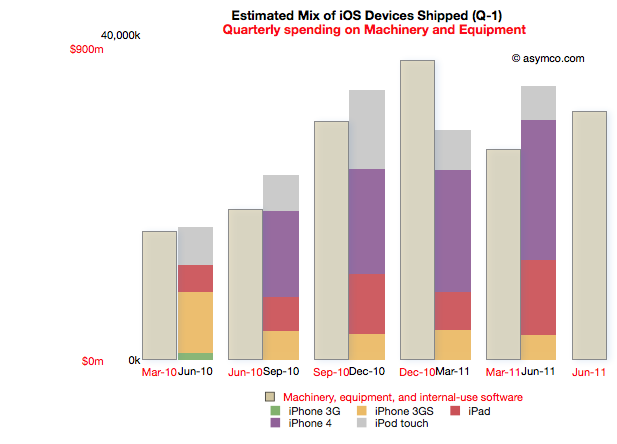
Phase III begins with spending prior to the launch of the iPad 1 (March '10) to the last quarter (ending June 2011). Coupled to this is production starting in quarter ending June '10 and ending in the last quarter.
Note that due to the time offsetting on production, the output from the spending on the quarter just ended will not be known until Apple publishes their shipments for the June quarter (scheduled for October 18th).
The relationship between pre-dated spending and production one quarter later holds quite well. There is a "surplus" of spending in December 2010 but that could be seen as the ramp being prepared for the second iPad.
Phase III cost is $3.7 billion so far.
Note again the change in scale from the previous two Phases. Peak M&E expenditures are around $900 million per quarter while production peaks at around 35 million units. This is a tripling of spending coupled to about a doubling of output.
Observations
The data suggests spending on equipment is correlated with the volume of production of its iOS devices. However, Apple is understood to be a company that outsources its production and does not "own" its own factories. Claiming that it keeps equipment used in the production of iOS devices on its books is an extraordinary claim.
I make a further claim that the scope of spending itself is extraordinary.
The following chart shows the three asset classes discussed in the three latest posts relative to each other (quarterly change in asset value).
In How much does an Apple store cost? I noted that the spending on leasehold improvements of $2 billion over a few years is significant and sustaining and largely asymmetric to competitors. You can see that spending in the grey bars above.
In The down payment on iCloud I noted that spending on Land and Buildings is significant and sustaining to iOS but not on a scale many can match. Those costs are shown in the blue bars above.
If, as I claim here, the yellow bars show the spending on Machinery and Equipment used in the production of iOS devices, then the commitment Apple has made to controlling production is even higher. In December 2010, M&E expenses were 50% higher than the spending on the data center and the new Cupertino campus put together.
The M&E assets have cost a total of $6 billion. The Apple stores have cost $2.3 billion and land and buildings $2 billion. In other words, Apple's machinery and equipment is worth much more than all its buildings and stores put together.
Compared with what Apple spends on other fixed assets, M&E is spectacularly significant.
In the twelve months ended June, Apple will have spent $2.9 billion in M&E to manufacture 118 million iOS devices. To put that in perspective, Nokia, which manufacturers a large (if not majority) of the 340 million phones it sells, expects full year 2011 capital expenditures of $1.1 billion.
Correcting for amortization and depreciation and deducting some spending on Mac M&E, it's very likely that Apple spent twice as much as Nokia on the instruments of production for one third the number of devices.
Conclusions
It may be too early to draw conclusions from this analysis. The claims should be debated and the claims should be tested, but I can suggest some tentative strategic implications.
Last December I wrote that I thought Apple should use its capital to own the means of production for iOS. I reasoned that device supply was its biggest deficiency and that perhaps ownership would allow them to become better at it.
Indeed, Apple has used capital to ensure it has better control over the supply of components and to also perhaps ensure capacity of production of those components.
But this analysis shows that Apple has gone much further toward integrating its value chain. It suggests that a large part of the tooling in its supply chain is owned by Apple. It suggests that those tools are put out of reach of its competitors.
The implications could be profound but given the length of this post, I'll leave that discussion for another day.
---
Notes:
Some of the capital expenditures were also allocated to servers or "information systems hardware, software and enhancements." From the Annual Report 2010: Capital Assets. The Company anticipates utilizing approximately $4.0 billion for capital expenditures during 2011, including approximately $600 million for retail store facilities and approximately $3.4 billion for product tooling and manufacturing process equipment, and corporate facilities and infrastructure, including information systems hardware, software and enhancements.
I began comparing Microsoft and Apple's financial performance with a review of "top line" or revenues by product lines over a four year period.
This post is about the "bottom line" for the same companies and products.
Before I jump in I would like to make sure there is no confusion about the terms. I will be comparing "operating income"[1] as a measure of "bottom line". This is a common way to compare the profitability of companies because it excludes taxes and interest income. These non-operating expenses/income can distort a comparison of performance because they can be the result of investment activity or changes in tax law or where the company is domiciled. One should not make judgements of comparative performance on those non-operational bases.[2]
Another challenge is that some companies report operating income by division while others don't. We can usually compare overall operating income but usually not on a division or product-level. This is the challenge I will try to overcome in this analysis between two very different operating models.
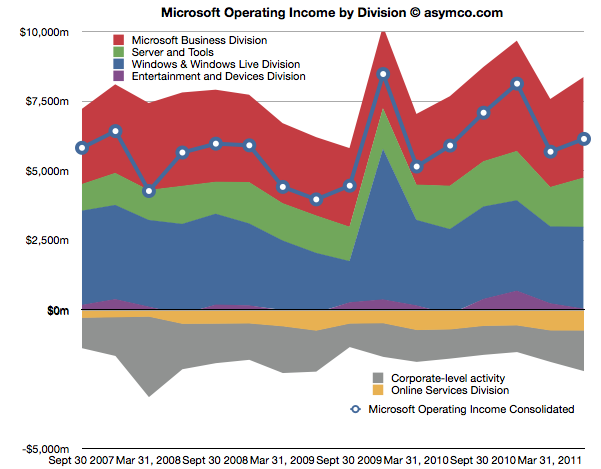
The first chart shows Microsoft's Operating Income by Division as reported by the company.
Each area represents a business division. Note some are showing negative income (losses).I've added a line representing consolidated operating income which is the sum of all areas (including the negatives).
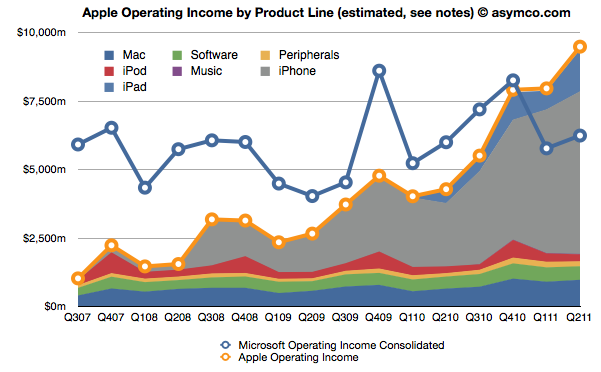
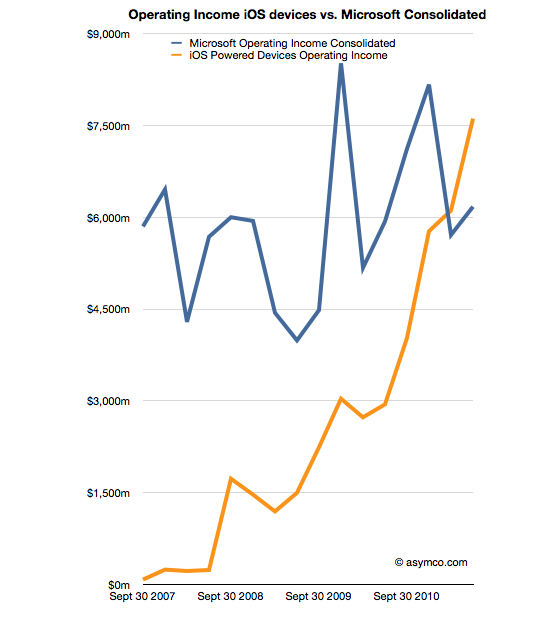
The same line from the chart above is super-imposed on the chart below and is comparable to the orange line that represents the operating income that Apple was able to obtain over the same time frame. Note that both axes are using the same scale.
The Blue and Orange lines are indisputable but the allocation of the areas under the orange line may be open to debate.
As Apple does not report a break-down of each product line or division, getting the areas in the Apple chart is a matter of analysis and estimation. The method I used was to estimate gross margins per product (the overall gross margin is known) and assigning a portion of OPEX (also known) in a ratio equal to the sales level of that product. [3][4]
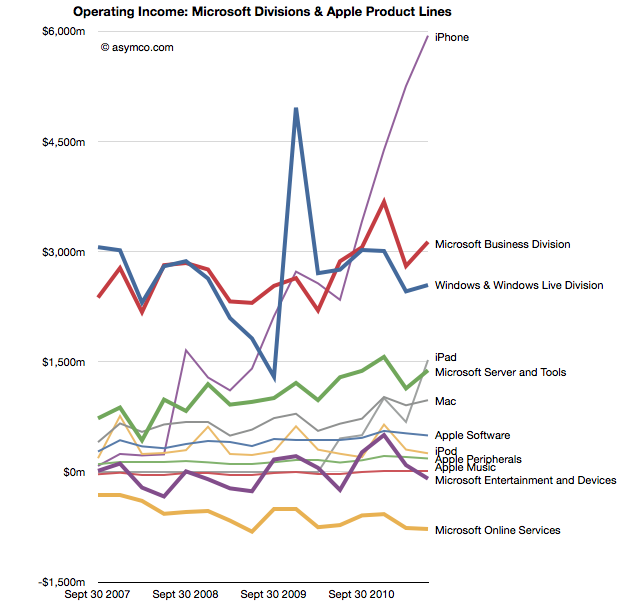
To make the contrast sharper (though more cluttered), I took all operating incomes from all product lines and divisions of both companies and laid them out as time series line charts in the following chart. I allocated Corporate Level Activity as an expense proportionate to each business unit in a ratio proportional to its sales. This allows comparison of product lines individually.
Finally, I combined all the iOS product lines (iPhone, iPad and iPod touch est.) as one line and laid it alongside overall Microsoft Operating Income (consolidated).
The second chart in this post showed that Apple has reached higher operational profitability than Microsoft by the end of last year. This fourth chart shows that iOS products combined are more profitable than Microsoft as a whole.
Microsoft invented the software business and built it to become the world's most valuable business by the year 2000. It's still been growing since and after 35 years it is reaching a profit of $27 billion per year. It did this while maintaining enormous margins and a highly disruptive monopoly business model the likes of which the world had never seen before.
It is scarcely believable then that a device business has been created to overtake it in four years.
On the other hand, one should not use Gross Margins alone. The crucial difference between Gross Margin (Sales Revenue - Cost of Goods Sold or COGS) and Operating Income is that fixed costs are also accounted for. These fixed costs are typically Selling, General and Administrative Expenses and Research and Development Expenses (commonly summarized as Operational Expenses or OPEX) which can be allocated to a particular business or division. For different business models, gross margins can be widely different. In the case of Microsoft for example, software has negligible direct variable costs. A CD or download is of tiny cost compared to the price of the license to use it. As a result software often has 80% gross margins. Hardware on the other hand can have very thin margins in single digits (e.g. PCs). Conversely, Microsoft will have very high fixed costs to pay for developers, product management and sales forces. A hardware vendor may have few engineers and sales could be handled through resellers. Thus Microsoft will have very high OPEX and a PC company will have very low OPEX.
So, for example, In Q2 '11 the iPad had an estimated gross margin of $2.06 billion (which assumed 34% margin on published revenues of $6.06bn). As it also was 21% of total revenues that quarter, I assigned 21% of OPEX to the iPad. That means 21% of $2.54bn or $540 million was the operational expense allocated to the iPad. This results in operational income estimate of $1.52bn for the iPad in Q2.
To summarize, the assumptions this estimate depends on are gross margin estimates and the allocation of OPEX in proportion to sales. Gross margin analysis has been a matter of iteration and peer review for some time and I'm fairly confident in my estimates. The allocation of OPEX is more arbitrary. Chances are that these expenses vary greatly with each quarter where more work is done nearer to launch of a new product and less in late season. If there are better methods available to allocate expenses by product, I'm open to suggestion.
In an Harvard Business Review post Rob Wheeler makes the case for the Kindle Fire as a disruptive innovation. I believe that it is but crucially I disagree that the Kindle Fire is a low end disruption.
My assessment of the Kindle Fire is based on the two attributes which Amazon highlights as the key selling points which offer a basis of differentiation and potential for asymmetric competition: a low price and a new browsing model. I believe that these two attributes result in two opportunities: one for low end disruption and another of new market disruption. I reject the first and tentatively support the second.[1]
The price
It's immediately obvious that the price point of the Kindle Fire is well below alternatives. That forms the basis of disruptive potential, but before we jump to analyzing the disruption hypothesis we should determine whether and to what extent Amazon profits from the device directly. Profitability gives us a clue to where Amazon will apply resources and thus establish its trajectory of improvement.
We know the margin on the Fire is low because we can calculate the bill of materials for 7" tablets. Gene Munster of Piper Jaffray estimates that Amazon "loses" $50 for each unit sold. We also know that the design Amazon used is essentially very similar to the RIM PlayBook and was sourced from the same ODM. RIM priced the product at $499 but has struggled to find buyers and is reluctantly dropping the price. We also can estimate that Apple with a product having more than twice the screen size is keeping modest (~30%) gross margins for at a price point approximately double that of the Fire. It does seem that Amazon does not have much or any margin to dip into.[2]
So the Fire can be classified as a low price product. Does that make it a low end disruption?
Disruption requires asymmetry but it also requires the ability to go up a trajectory of improvement along the basis of performance that a majority of users demand. The first condition is met, but what of the second? In a combined system where one asset is used to leverage another--the subsidized being sacrificed to benefit the profitable--success is conditional on one element being "good enough" while the other "needing improvement". Investment follows accordingly.
But investment decisions have consequences. The subsidized device is starved of investment while the profitable service is nurtured. We see evidence of short cuts in investment in the off-the-shelf nature of Kindle products: from a second-hand (unsanctioned) OS to a second-hand (ex-RIM) hardware. Meanwhile, Amazon spends heavily on capex for the infrastructure that delivers the profitable content.
If the hardware is indeed commoditized and cannot be usefully improved, then this model works. If, on the other hand, the hardware and systems software can benefit from dramatic improvements in technology then the model fails. The very asymmetry of a service vs. a product turns into the latter having all the advantages and the former failing to gain traction.
I'll give three examples of this how service model creates limitations which lead to a failure to disrupt a product model.
The Game Consoles
The first is the game console business. In consoles, the vendors maintain long hardware product life-cycles to recover their hardware investment and subsidy by maximizing the number of games attached to each console. If you plot product cycles you realize that the bigger the subsidy, the longer the hardware lifecycle. The result is a very wide turning circle which prevents innovation in new dimensions.
Consider that the Playstation or the Xbox could have been a low end computing disruption. The original Xbox was in fact a PC. It was supposed to bring PC dynamism to the console business and create a cottage industry of new developers building games on commoditized hardware. However by the second generation the Xbox was a locked down, custom architecture, pure gaming machine. Gone was Intel, gone was the PC architecture and gone was any dream of cheap development.
This is entirely due to the economics of subsidized hardware. It compelled Microsoft, the world's greatest software company, built on the open and cheap PC architecture to make closed, expensive hardware. Sony followed in kind as did Nintendo. Each generation of consoles was a sustaining improvement on gaming and had no ambition beyond gaming[3]. The subsidy and the dependence on an integrated content value network led to a distinct lack of disruption and an insular industry which continues to seek out increasingly immersive experiences for increasingly demanding customers while itself being disrupted by casual, mobile gaming.
The Set-top boxes
The second example is the TV set-top box business. There again, the vendors maintain long hardware cycles in order to recover subsides. There too, the main value driver is the content and its distribution which stipulates the architecture, and through subsidy, defines its evolution. This offers the vendor no motivation to improve the user experience[4], secondary uses or the absorption of new streams of content (like those the internet can offer.)
Again, the set-top box could have been a budding disruptive opportunity for Microsoft. They invested billions in the 1990s to acquire placement of software on set-top boxes in an attempt to penetrate the living room. And again Microsoft was not alone. Since then Tivo, Google and Apple and many others tried to attach cheap hardware to video streams. They all failed to get on a disruptive trajectory. And again, the blame can be placed on the stifling effect of subsidies and dependencies on services or content which dictate where the value and hence the investments should go.
The Blackberry
The third example is the RIM Blackberry. Although RIM made most of its money on hardware and was by no means subsidizing it, the differentiation of their product was undoubtedly its service value. Both as a corporate device with BES and as a consumer device with BBS, customers "hired" the product as a service. By being committed to this model RIM management became blind to the hardware and client OS software innovations coming down the pike.
Through their own admission, they could not accept a touch screen because it would make the messaging experience too slow and it is messaging that sells Blackberries. They could not accept apps (and hence platform orchestration) as a differentiation because their customers did not hire Blackberries for "lifestyle apps". Merely being differentiated as a service leads to blindness and enough hesitation that you run off the disruptive rails.
People ascribe myopia or incredible absence of mind to RIM's management but the opposite is true. They were deeply committed and observant of the things which made the Blackberry successful. It just happened to be something that stopped being relevant.
The iPhone
I'll add one more "bonus" example on this. The iPhone is also a subsidized product and it seems very successful. How come it won? The answer is in details. As I mentioned, the other products ended up in poor life cycles or incorrect motivations. The iPhone differs in that the lifecycle of the product is much shorter (2 years ownership with 1 year for product updates). The shorter lifecycle works for the iPhone because it has a very high service revenue base to dip into to offset the subsidy. Something none of the content models above could count on.
Consider that each game console subsidy needs to paid off by a handful of game titles whose royalties to the console maker are modest. Or that the TV box needs to ride on top a service that also has thin margins from a stable or slightly shrinking user base. In contrast, the iPhone enables vast new consumption worth thousands of dollars to the operator. This is the famous ARPU uplift that smart phones enable. Users are doubling their telecom spending when they move to smartphones.
The margins for Kindle content are thin. Very thin. Apple runs its content business at break even though it transacts billions of items per month. The amount of content that needs to pass through the Kindle ecosystem (with lower prices than Apple charges) will need to be astronomical to make it profitable on the shortened cycle time the iPhone enjoys. Thus the Kindle is likely to languish in a leisurely update cycle with users encouraged to hang on to their devices for years. This is the case at least with the original e-Ink Kindles. How eagerly awaited are new generations? How many users stampede to update the hardware or even upgrade the software? How many users have owned every version of the Kindle?
Service Scale
Finally one last point about services. As Amazon asserts, they see Kindle as a service, which, I concede, is asymmetric to a product business. The problem is that services don't scale as well as products. Consider that none of the content streams that Amazon will depend on are available outside the US. The Kindle has not been a strong seller internationally. This is because book rights are limited to national boundaries as are movie rights and song rights. Apple has only this week finally completed the rollout of iTunes music to all of Europe! A process that took almost a decade. And they are still unable to sell music in most of Asia and forget about movies or TV shows.[5]
The reality is that there are no global service brands. Not in telecommunications (operators are, at best, regional), not in Media (TV, radio, publishing are a local businesses), not in Banking (not even in commercial banking) and not in Retail (even Wal-Mart was humbled trying to export its disruption). The internet has not broken down any of these boundaries and even Amazon has modest reach outside the US for any of their franchises. Services are local but products can be global.[6]
To wrap up, this discussion on the asymmetry of device-based services to product models leads me to conclude that the Fire will not have the opportunity to disrupt the iPad or tablets in general. Amazon sees the hardware and software of a device as a commodity and the content and its distribution as valuable. This assumes that the device is "good enough" and will not require deep re-architecting or that new input methods can be easily absorbed. In short, they see the tablet as at the end of its evolutionary path. Apple sees the exact opposite. The iPad is 18 months old, and as they say in the ads, they see it as only the beginning.
---
Notes:
Due to length of discussion, in this post I will make the case against the low end disruptive potential and use a second post to make the case for it being a new market disruption.
Presumably, Amazon will also distribute only through Amazon.com and thus not incur channel mark-ups. This means that comparisons with other tablets should be at a price nearer to 70% of retail.
Gaming networks and video streaming are extensions but neither leveraged open architectures.
Apps are another story. Because it controls the medium, Apple can and does sell apps in every country where the iPhone or iPad or iPod touch is available.
Note also that because of distribution through Amazon.com, the Kindle cannot reach as many buyers as a tablet selling through the tens of thousands of points of purchase that operators and retail shops offer.
Almost all valuation models for Apple assume it's a hardware company. The modeling algorithm for hardware is simple:
For each year in near future
For each product line
Compute contribution
Determine company value by summing contributions and multiplying by a P/E ratio
The major difficulty is in predicting the growth of each product line. This is difficult because buyers can be fickle. Companies employs all sorts of tools in order to secure repeat customers but if switching costs are low, the company can crash in value. For this reason, analysts pick various ways to predict device sales. Some choose to index each product on production (channel checks), demand (customer surveys,) or even on a top-down share of total (market research on growth of whole market and assumptions of share).
Although simple and convenient, this model does not probably match the way Apple is managed. The company does not build hardware products to sell and forget. It builds platforms which are best seen as sources of recurring revenues. Users are incentivized to continue buying devices. iCloud, iTunes and other Apple properties are expressly designed to that goal--and they are not cheap to run. So, the company must see the world through a different set of lenses than the default model shown above.
To think about the business like they do, we need to put the data through a similar set of lenses. I began with a modest proposal last month to value each user as a source of recurring revenue. Now it's time to expand on this method.
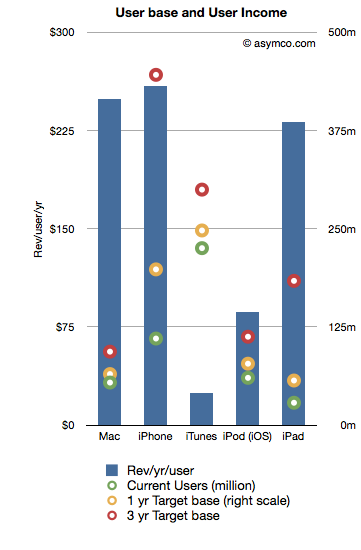
The following chart shows the recurring revenues per user by product and the current and possible future size of user bases.[2]
Revenues/yr/user are bars with the left axis and the User bases are various colored circles indexed with the right axis.
The assumptions that went into the data are as follows:
Device life span is as per previous article linked above
User base growth for 1 year is: Mac 20%, iPhone 80%, iTunes 10%, iPod 30%, iPad 100%
User base growth for 2nd and 3rd years (recurring): Mac 20%, iPhone 50%, iTunes 10%, iPod 20%, iPad 80%.
The Revenue per user is assumed constant
Note that the user base growth figures are lower than the product growth levels seen historically. Obviously, the model is highly sensitive to these growth assumptions so they need to be scrutinized and tested rigorously.
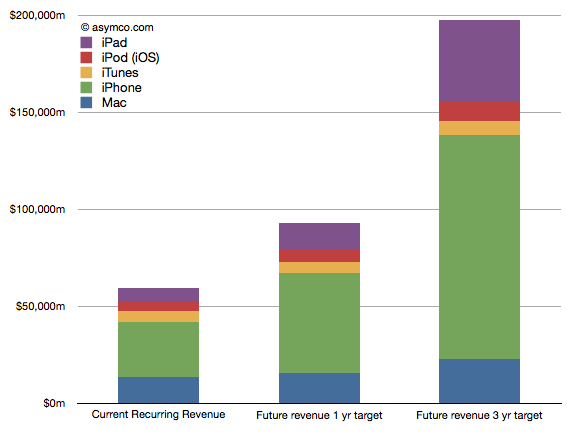
Nevertheless, as a straw-man proposal, the recurring revenues for all these products[1] is shown in the following chart:
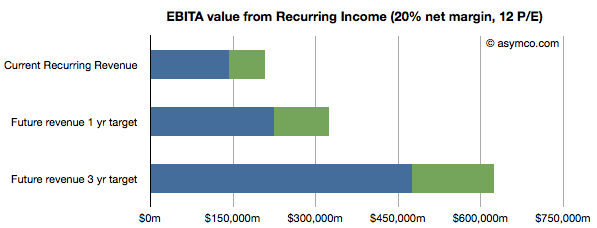
Once the income is estimated, we can take that value and assume a profit margin (net) and then multiply the earnings by a multiple. Using a 20% net margin and 12x P/E yields the following chart.
(I added an assumed level of cash in green.)
This model would imply that the company today could be valued at $208 billion on the basis of its installed base alone. That value would be about $323 billion in one year and $620 billion in three years. Dividing by the number of shares outstanding (935m this year increasing at 2% a year) yields a share price of $222, $339 and $629 by mid 2014.
These values can be considered "lower bounds" on valuation since they assume income from previously secured customers. The speculative part of investment would be based on what the future bases will look like (so, for example, if one believes these assumptions, the $629 figure could be considered a target to be discounted to today).
---
Notes:
Excludes Software, Peripherals, non-iOS devices, and any other service revenue.
Steve Ballmer stated and Andy Lees confirmed that Microsoft views iPad and other tablets as "just PCs". From a market measurement point of view Canalys agrees. IDC and Gartner don't, calling the new devices "media tablets."
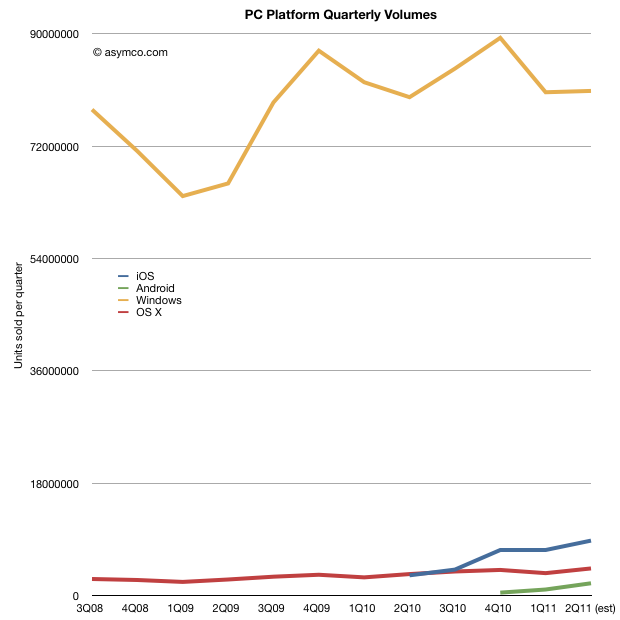
Before deciding whether tablets belong with PCs in market metrics, it would be interesting to look at what the data shows. When seen as a combined market, the focus should be on platforms. The following chart shows the four main PC+tablet platform volumes since late 2008 [1].
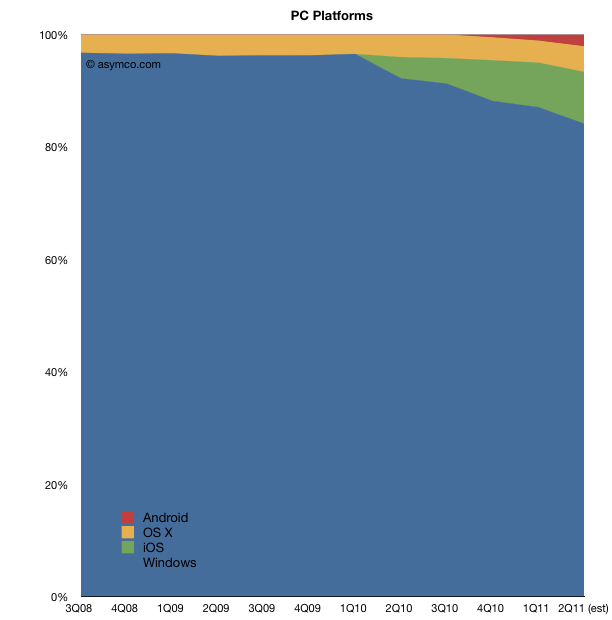
The second chart shows the same data as share of total market:
This comparison allows for some fresh observations:
Excluding iPads, Apple is very close to being 5th largest global PC vendor. Global share likely to be above 5%. Including iPads, Apple would be 2nd.
Platform year-on-year growth was Windows: +1.3%, OS X: +26%, iOS: +170%. Android growth cannot yet be measured since Android tablets have not been on the market for more than 1 year.
In Q2 2011 one million more Windows PCs were sold than in Q2 2010. In same time, 903k more OS X PCs and 5.5 million more iPads.
Excluding tablets, nearly 50% of the global PC growth was due to the Mac. Including iPad, Apple was responsible for ~70% of the growth in the PC market in Q2.
The picture that emerges is that while Windows continues to be dominant with 84% of units sold in the last quarter, the growth belongs to tablets which captured about 90% of it. If Windows remains marginal on tablets, the "PC market" will likely tip away from Microsoft in two years (depending on how quickly Apple can build iPads.)
Microsoft is making the commitment to move Windows to a tablet form factor but they are doing it while retaining the user interaction model of a desktop. This may or may not work but they are also conceding that a separate experience is also necessary. By rejecting the notion that a mobile OS alone can do the job, they are essentially building a "hybrid" tablet/laptop/desktop product which may be challenging to use but preserve their presence in the form factor.
Whether Microsoft succeeds or not will depend on whether the new form factor is disruptive in more than user experience. In other words whether this is just a "new PC" or a "post-PC". The argument comes down to business model changes. For example the new model comes with different cycle time of product development (deep, integrated, yearly changes), different ecosystem (apps), different cost structures (high R&D in hardware), vast scale (device economics, components, ramps), and potentially new distribution (operators in the channel mix.)
Summed up, the real challenge for Microsoft is whether they can keep their business model (selling OS licenses to hardware vendors) as PCs become more device-like. Not only is iOS setting the benchmark for performance but Android is potentially ready to take share if the market turns slightly more modular. Microsoft's differentiation looks to be primarily its legacy of PC software.
It may also seem that much remains to be discovered in this market but I think the main bets have already been made. The PC market as we know it is in the end game.
---
Notes:
I used Gartner data for overall world-wide PC market and merged it with Mac and iPad data from Apple. Android data is estimated.
Ever since the iPhone launched four years ago (to the day), the question on everyone's mind has been: When will Apple expand the portfolio to reach into all market segments? I remember thinking in 2007 whether it would be in six months or a year that they would create a "mini", "nano" and "classic" line-up which served them so well with the iPod.
Apple however took a different approach. To their credit, they focused on the platform and built a consistent experience around a fixed screen size to nurture an ecosystem. They also improved the power of the device so that experience would improve to be better and more robust. In other words, they treated every iPhone as not being good enough, needful of every megahertz of power, every pixel of screen and every minute of battery life. They polished the OS constantly and added APIs by the thousands.
In other words, they acted like a computer software company, not like a "device vendor" or like a handset manufacturer which was everyone's (including mine) frame of reference.
Having expanded from iPhone to iOS and built the platform into non-cellular centric computers like iPad and iPod touch, they clearly showed a nonchalance about the operator channel and the amplification power it offers (an amplification which comes with a hefty price of dependency and strategic illusion.)
But the mind always wonders back to the question of portfolio. Now that the product is maturing, the hardware is getting nearly "good enough". Perhaps even Apple might now consider letting go of the "frontier" of what's technologically possible and consider expanding its reach to the broader audiences it has willfully kept out of reach.
And broad they are.
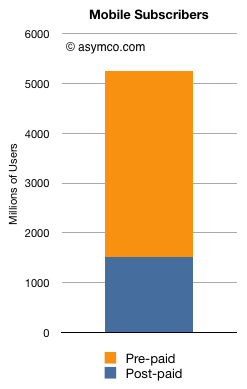
Based on data published by Deutsche Bank and the ITU, we can calculate roughly how many customers Apple's current iPhone positioning has left unserved. I chose to use pre-paid/post-paid split as a proxy for unaddressed/addressed. This is an imperfect proxy but a pretty good one as most pre-paid subs see a full price for the iPhone (retail around $700 to $1000) vs. post-paid customers seeing a price of $200 or below. The $200 happens to be an important psychological price inflection point where volumes increase dramatically.
The first chart shows the global split between pre-/post-paid subscribers as of 2010. Roughly 1.5 billion are post-paid and 3.7 billion are pre-paid. That means that nearly 70% of the world is not being addressed by the iPhone as it currently stands. Put another way, a shift in positioning might result in a 250% increase in addressable market.
Tim Cook alluded to this in the last conference call when he said pre-paid markets, especially in China, are huge with share figures "starting with a nine". He also said separately that they would not be ceding any market--a hint if there ever was one, given the broadening of Android into previously feature-phone price bands.[1]
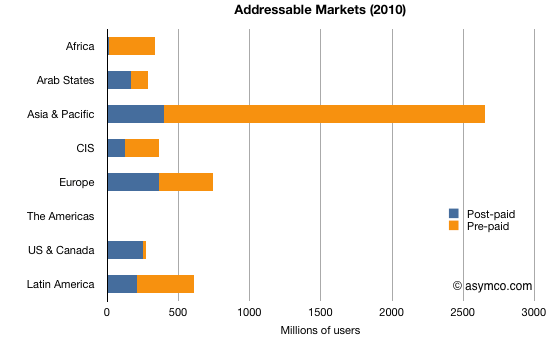
We can even see the situation more clearly on a regional scale. The following chart shows the same pre-/post-paid split by region.
You can visualize the iPhone having spent the last four years penetrating into the blue areas of the chart through the expansion of carrier agreements. With half the US & Canada area being finally filled in this year, most of the blue is now more-or-less within reach.
Given the constraints on production, and given the improvements in the product and the improvements in the hardware (learning curves and price points) it may mean that Apple could finally be turning its attention to those orange areas.
The time may be soon at hand that maturity coupled with limits of organic growth are leading the four-year-old iPhone to finally be re-defined as more than a post-paid skimming entrant. It may be time for the iPhone to more than just grow. It may be time for it to grow up and take on the whole market. Five billion people are waiting.
---
Notes:
Contrary to a commonly held belief, Apple does not shy away from market share. In the case of the iPod and even the original Apple 2, the company sought and obtained the top share ranking. In fact, the decision to pursue share vs profit is "context sensitive". Steve Jobs, at least, thinks so.
Andrian Georgiev, a reporter from the Bulgarian business newspaper "Capital weekly" wrote an article for which he asked me some questions. My answers are below. The article is available here (Bulgarian). Q: How many tablets will be sold worldwide this year and in 2012? A: We can only guess the answer. The total will be constrained by parts shortages for 2011, but my estimate [through the end of 2012] is over 100 million. Perhaps even 120 million is possible.
Q: Do you think Amazon is working on a tablet? Could it be a game-changer? A: If Amazon (or Facebook or Baidu) were to build a tablet the greatest innovation will be in their business models. In other words how they make money. I suspect Amazon's hardware will be free or nearly free but users will be incentivized to buy content or other goods from Amazon. Similarly for other businesses that will take a hardware product and make it an accessory to their core business. In that regard the "game will change" because hardware will conform to "the application" above it. In other words, that the device will be an accessory to the service, not the other way around.
Q: Why is it so hard for manufacturers to create a tablet that rivals iPad? A: The iPad is a collection of components. Some are easy to duplicate or to source. This includes memory, microprocessors, communications components. Other components are harder to find and may be expensive once found. This includes the right kind of batteries and the screen. Yet other components are impossible to find or duplicate. That includes software.
--
Some additional thoughts:
The changing of the game may not happen for some time. "Feature tablets" (analogous to feature phones) will however be viable as niche businesses quite soon. I believe "conforming" operating systems will be more popular with tablet makers than with phone makers.
The following interview was conducted by Bruno Ferrari a writer about technology for EPOCA, the weekly magazine of Organizações GLOBO, the largest Brazilian media company on March 30 2011. The article (published in Portuguese here) is an edited subset of the following exchange.
Q: In your analyses, you mention tablets as part of a new era, the “Post PC era”. Why do you think the PCs will be replaced by tablets?
This is not quite correct. Post PC does not mean the end of the microcomputer. The way to think about it is this: The stone age did not end because we stopped using stones. Same with the iron age and the industrial era. The era of jet travel did not end automobile or even ship travel (though that changed to recreation rather than transportation for passengers.) Each phase of technology does not fully replace its predecessor. It offers a new set of solutions and perhaps a slightly different way of solving old problems. We'll still have PCs but we will use a new type of computer, an even more personal computer. The world still uses the microcomputer's technological ancestors.
In terms of what new jobs will we hire the tablets to solve, they will vary greatly from what we used PCs for. Just like we used microcomputers for different things than we used time-shared minicomputers and mainframe computers. I expect social interaction, media consumption and entertainment will move from a PC to a tablet. New uses will emerge from the vast experiment that is the app phenomenon.
Q: What are the new ways to interact with machines? With gestures? How will this change the market?
Each major disruption of computing came from a new generation of input and/or output methods. Terminals (vs. punch cards) enabled minicomputers. The GUI enabled the rise of the microcomputer and touch is enabling the rise of the tablet. Perhaps this era will last decades perhaps only years, but there will be new input and output methods available. The world's research laboratories are filled with ideas from projection screens (from high brightness LEDs) to motion sensing (as implemented partly by Kinect) and even novel voice control methods. I believe that each major innovation will create a new wave of growth and, if coupled with a new business model, a new set of companies and platforms.
Q: What are the main differences between PC and Post PC era?
The main difference will be in the context in which the product will be used. Tablets and smartphones allow "computing" to be done in previously non-consuming contexts: while standing, while in the active company of others, while commuting or while lying back and relaxing. It will also allow more individual use. Like the transistor radio allowed teenagers to listen to rock-and-roll out of hearing range of their parents who had control over the family stereo, a truly personal computer will allow people to "escape" into a world of more intimate consumption and communication.
Q: Do you think physical keyboards and mouse will be extinct?
Even physical keyboards have been evolving dramatically. If you look back to the earliest IBM PC keyboards, they were mechanically complex and had a rich feel. Modern laptop keyboards are flimsy things with barely any feedback. Early PC keyboards were patterned after the needs of professional typists (aka secretaries). Current keyboards are designed around space constraints. Same with mice. They went from two to three to one to no buttons. With laptops we ended up with track balls, little knobs in the middle of the keyboard or with trackpads. Users adjusted over time.
What changed with tablets is the removal of an on-screen pointer. The pointer was there because the mouse/touchpad was one layer of abstraction for controlling what was on screen. Without a pointer you have direct manipulation. I'm sure many people who never used a mouse would find the direct method more intuitive and in a generation people will wonder how we put up with mice. Conversely, those who are used to a mouse will find it uncomfortable at first. Remember that in the 80s many keyboard experts found mice something that slowed them down.
So I believe that people will adjust to a world without mouse pointers. I suspect children born today will grow up without ever using a mouse (or a phone with a wire permanently attached to the bottom).
Q: Apple has more than 90% of tablet market worldwide. Do you think Apple will be the leader of technology market in the next few years?
The challenge for Apple is that they cannot serve the whole world. They can only grow so fast. On one hand we have their inability to meet demand and on the other we have alternative products which can. Market leadership may not be sustainable just because the market is so big and no single company can supply it. I do believe that Apple is not sitting on its hands however. Their culture promotes pushing forward.
Q: At smartphone market, do you believe on a risk of a new duopoly, Apple-Google? Some analysis says that they’ll control the channel sales of software, content and hardware. The conclusion is companies like RIM, Nokia and HP (Palm) will not be able to keep up.
Analysts differ in their opinions. IDC just released a forecast that shows Microsoft growing beyond iOS in four years. I don't try to make this type of prediction. At least not to a high degree of precision. I do believe that there will be more than two platforms. This is because the market is so large and so diverse and there are so many ways to reach customers (through operators, through retail stores, through online).
Q: Can we compare the beginning of the tablets with PCs? Apple developed the interface and made the first computers nice and easy to use. But Windows has allowed hardware manufacturers to invade the market, popularizing it. This will be repeated with Android? Or with other systems?
Innovations are always copied. Even when protected by all sorts of laws or patents. What makes a company successful with innovation long term is to always keep innovating. Often coming up with the next big thing means damaging the old thing. That's hard to do for many companies so they don't do it and somebody else does. This is why great companies end up as formerly-great companies. As I pointed out above in the discussion about input methods, innovations are always bubbling up. As long as Apple takes these ideas and polishes them and brings them to market, they'll do all right.
Q; How about Microsoft? Do you think the company will lose the podium in Post PC era?
Microsoft already has lost its position as leader in personal technology. The end actually came in about 2000. Once Windows became "good enough" and did not crash so much, they have had a hard time finding something to improve. If you go back and watch every CES keynote that Microsoft presented since then it's been a litany of dead end ideas.
Every major innovation since 2000 has been in consumer technology and that's never been an attractive business for Microsoft (with the exception of XBox which was really aimed at Sony and Nintendo without the intention of creating a new market.) Microsoft struggles not because they lack talent (engineering or management) but rather because their business model is relatively rigid. They make money through software licensing. You can see how that's a hard thing to sell to consumers ("I'm buying what?") Consumers tend to pay Microsoft through the purchase of another product. If the market demands hardware/software integration (like in a phone or tablet) or making money by giving software away (like Google), they struggle. This business model rigidity is present in almost all companies, so Microsoft is not uniquely troubled.
Q: Most of the tablets will use mobile networks to connect to the internet. Do you think the world is ready with an infrastructure that supports this growth in access via mobile networks?
This is a good question because the growth of mobile broadband is a major enabler (or constraint) on growth. Fortunately, the roll-out of mobile broadband is fairly predictable and it looks good. There are some challenges for operators long term in paying for the infrastructure, but they don't lack for financing today and the business case for more infrastructure seems to be very attractive. It will take time and it won't be even globally, but the incentives are clearly there. A lot of value is being created with mobile computing and much of that value will end up paying for the bandwidth.
Q: How about the App Market. You posted recently a chart showing how fast developers are buying thickets for both Google and Apple developer events. You said that it is one signal of the Post PC Era. What will be the importance of apps on the next years. Do you think Apps market will be more important than hardware, content and OS market?
Developers are one more sign that something big is happening. It's not the only sign and may not be the cause of the change, but it's yet another signal. But apps are a phenomenon that will result in something bigger than we can imagine. The way to think about apps is as a new medium, similar to the emergence of radio, television, cinema and even books. The app is a new art form as well as something that provides functional value. We don't know whether the app phenomenon will be tied to one platform or will evolve to something like HTML5, a common standard. But the value of having an app for everything is plainly evident. The economics, creative energy and dynamism of apps cannot be overestimated. I will write more about this subject as I think it's one of the most important consequences of the post-PC era.
Q: What’s the destiny of the PC? Are they on their last years?
Again, it's not so much that PCs will disappear any more than mainframes or servers have disappeared. What is more likely is that they will be used for isolated, focused jobs. The "end of an era" is the end of growth, not the end of existence. The PC has arguably reached end of growth in most developed markets. There is still strong growth in emerging economies but even there, much of that growth will probably be replaced with smart devices growth.
Q: We had the Mainframe Era, the Terminal Era, the MiniPC Era, The PC Era and now we starting the PostPC Era. Do you imagine what Era we'll se after the tablets? When do you think is it going to happen?
I don't try to be a futurist who can see with clarity technological change. I try to see the patterns of markets through the motivation of companies. With that in mind, my answer will be that large companies will acquire promising new technologies from start-up companies and implement products with global distribution. To see the future you therefore need to look at what small companies are doing today. I note that there is a lot of innovation in new communication methods (social media) and new input methods around gestures and display technology. I am skeptical about the power of voice controls.
I'm most confident that there will be a re-definition of television, a "socialization" of almost all media. So I'll abstain from answering directly what happens after the Tablet Era. Perhaps something more personal and more of a companion than a tool.