Asymco

Asymmetric Intelligence

iPhone

  1. The platform as a promise

    Research · 39 comments

    In a recent answer on quora, I wrote that I did not believe developers are tempted primarily by economic incentives when choosing which platforms to work on. I suggested that they hire platforms because of their star-making potential and that star-making value is not a something that money can buy. Using Hollywood as an example I suggested that subsidies decrease the perceived value of a talent-oriented platform.

    The notion that a platform signals meaning to developers led me to think about how mobile platforms signal meaning to consumers. I have a hypothesis that platforms can and should be treated as brands. This point of view allows platform orchestrators to develop a comprehensive market-driven strategy for platforms that transcends technical debate.

    First a word about what a brand is.

    Brands are vaguely defined. They are identities, names, symbols or attitudes or all of the above. Marketers struggle to define brand value because they are trying to encapsulate what they sell into a single symbolism. The problem is that there are vast varieties of things being sold. Every product or service has different meaning to buyers and it cannot be captured the same way. Because I cannot rely on a single definition I have to create a specific definition of brand to the context of mobile platforms.

    I choose to define brand in this context of platforms as the "promise of the platform". A platform is a promise that the products will function in ways beyond what's "written on the box"; that the product is extensible and has value provided by an ecosystem bigger than the original vendor.

    For example, although the iPhone is based on iOS platform, iOS is not the brand. "iPhone" encompasses the platform brand and it's a promise to users that they can expect apps and content and an extended flow of innovation to continue well beyond the initial purchase of the device. This brand value is attached to iPod touch and iPad even though it's not communicated as a unified platform. In other words, consumers don't look for "iOS inside" but the implicit value of "there's an app for that" covers all the products.

    When looking at platforms as promises or brands, we can observe how some are more powerful than others.

    Symbian or Series 60 was never marketed as a brand and Nokia users are generally unaware of what OS or platform their phone runs. Does Symbian make a promise of an "extended flow of innovation to the device" after the time of purchase? It's hard to make that promise when you can't communicate clearly anything but device specs.[1]

    Conversely, Android has become a strong brand. The Android label (and mascot) is frequently used by device vendors to signal platform brand value.

    How did Google achieve in a year this value with Android while Nokia continued to squander any brand goodwill around Symbian for a decade? The answer lies in marketing decisions. Nokia wanted to focus on the hardware as value (and the Nokia brand as the way that value is encapsulated). Google and Android OEMs wanted to lift their own device brands into becoming smartphone brands and attached the value of Android branding to them.

    Which brings me to the question of how to design platforms as powerful brands. Creating awareness of extensible value is the way to signal to developers and all members of an ecosystem that a platform is valuable. Apple did this very well with their iPhone ads which focused on the app value of the product. They showed the product in use and did not rely on metaphors. Developers saw other specific apps being advertised by Apple and it engendered huge star value in the platform. Every developer wanted a shot at being featured in an iPhone ad. The iPhone could and did make stars.

    But you can't make the great promise of the platform without the ensuring consistency, reliability and longevity. Fragmentation, malware, copyright infringement and arbitrary termination amount to the confiscation of platform value by the orchestrator. Poor custodianship results in the destruction of both ecosystem and end user value.

    --

    Notes:

    1. The lack of platform promise for Symbian may also explain why Nokia believes they can sell 150 million Symbian devices which have a deprecated platform. Those devices could be sold as feature phones, not platform products. The challenge for them will be to get a smartphone price for a feature phone product.
  2. Google and Apple as mobile co-belligerents

    Research · 94 comments

    The relationship between Google and Apple is an interesting one. It's enticing to declare them "at war" with one another, but that type of relationship does not account for the collaboration and partnerships they enjoy. To wit:

    • Google pays Apple for default Search placement on Safari. This means that Google treats Apple as a distributor.
    • We can presume that there is a deal between the two over Gmail and Maps on the iPhone as well.
    • AdMob is available on iOS without hindrance.

    The business relationships between the two companies are self-evident. However, I would suggest that there are more important strategic reasons why Google and Apple are in fact implicitly collaborating against a common goal.

    The concept of "co-belligerence" may describe the relationship: The state of fighting against a common adversary without a formal alliance and without a guarantee of non-agression against each other.

    The common adversary is the telecom industry. It's an industry being undermined by the technological change of mobile computing and its profits are up for grabs. Apple and Google have different approaches in implementing this change but in the end they dismantle and absorb profits from the same target.

    They are also benefiting each other. Apple benefits Google by creating user experience innovations which Google can rapidly copy. Google benefits Apple by increasing smartphone consumption--educating markets to the value of mobile computing and crippling the profitability (and thus the ability to innovate) of Apple's direct competitors.

    If I may belabor the point, it's like the concept of fast food. One company invents the fast food franchise process, another popularizes it and creates demand. Finally, the innovator comes in with a premium brand to split the market.

    Apple innovates in product innovation with Google as a fast follower. Google then innovates on distribution and penetration enabling Apple to follow with a skimming strategy.

    The end result is a more rapid and thorough profit evaporation from incumbents with corresponding condensation around the entrants.

    To visualize it further, consider what the market would look like if one or the other of the co-belligerents was not participating. Could Google have developed their software without the iPhone as a reference design? At the same time, as Android eliminates the opportunity for alternative software investments by competitors[1] could Apple have remained the only integrated vendor with a uniquely high profit margin?

    Of course, this is not a guarantee of success. New platforms may still take root and integration by HP may actually pan out. But the point I'm trying to make is that, for the time being, Google and Apple are not so much adversaries as comfortably busy winning against a rather weak common target.

    ---

    Notes:

    1. Consider how hard it is for OEMs to justify investing in their own OS post-Android. Consider the desperate status of Nokia who abandoned a broad ecosystem and the paucity of alternatives.
  3. Nokia employs as many people to develop its smartphone software as Apple does to develop all its products

    Research · 106 comments

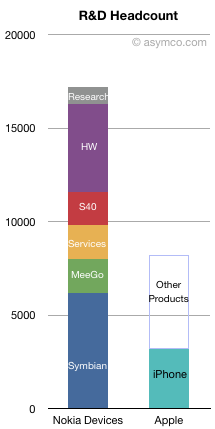
    In a recent post I pointed out that Apple's R&D was about 2.2% of sales in the last quarter. Bernstein took a look at the R&D for Nokia and presented a chart showing the difference between the mobile industry players in terms of total expenditure on R&D.

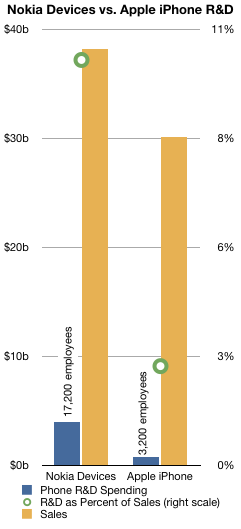
    I took inspiration from that to plot the Devices R&D for both Nokia and Apple over the entire 2010 period. I also compared that with sales and computed the ratio between R&D and sales.

    The result is shown in the chart on the left.

    Bottom line: Nokia spent 10.2% of phone sales in 2010 on phone R&D while Apple spent 2.5%.

    Bernstein goes on to argue that at least for Devices,

    Nokia spent $3.9bn in R&D in 2010, almost 3x the average of its peers, 31% of the industry's R&D total spending, for an output that we can qualify as visibly disappointing.

    To relate the $3.9 billion for Devices into head count, they estimate that Symbian projects employ 6,200 people; MeeGo and Qt 1,800; Services 1,800; and S40 1,800. Hardware headcount is assumed to be 4,700 and 900 more for fundamental research.

    So Nokia's total software headcount adds up to 11,600 people. Nokia smartphone headcount adds up to about 8,000.

    Applying a similar formula ($240k/employee[1]) to Apple's estimated iPhone R&D (from Bernstein's chart) yields a headcount of about 3,200 and a total Apple company R&D headcount of 8,200.

    So Nokia employs about the same number of engineers[2] for its smartphone software platforms as Apple does for all its product lines[3].

    In fact, Symbian alone may cost twice as much to develop than the iPhone (including the hardware).

    ---

    Notes:

    1. The cost per employee is obviously different between the companies as they operate in different countries. However there are enough sources of error in these estimates that they probably overwhelm the cost of living/tax differentials.
    2. I know that engineers are not all that R&D headcount covers, but let's assume that the mix of overhead is similar for the two companies.
    3. The total for Symbian + MeeGo is 8000 and the total for Apple overall is 8,200, however one can comfortably allocate 200 out of 900 researchers out of Nokia research to their mobile software effort.
  4. The iPhone share: 17.25% of smartphones, 4.2% all phones

    Research · 13 comments

    The mobile phone market is growing rapidly. It grew 18% in the last quarter. The smartphone market grew even faster, about 75%.

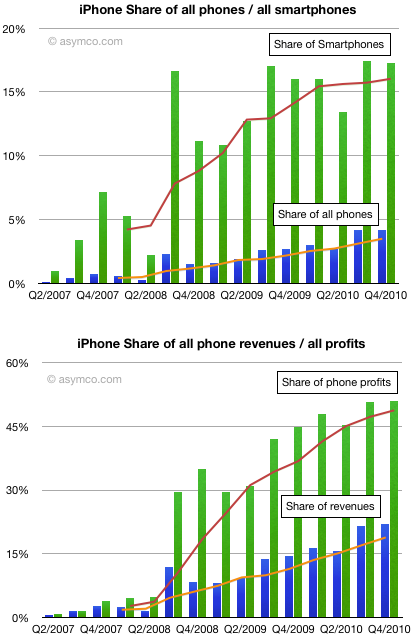
    To grow share in this market means growing even faster than the market. What we can see from the following charts is how the iPhone as a product grew in share since it was launched 3.5 years ago:

    Unit share growth slowed in the last quarter but the fourth quarter is not usually the most expansive for Apple. That is usually the third quarter which is the first full-availability launch quarter.

    The iPhone ended the quarter with 17.25% smartphone share and 4.2% phone share. Share of revenues was about 22% and share of earnings was about 51%.

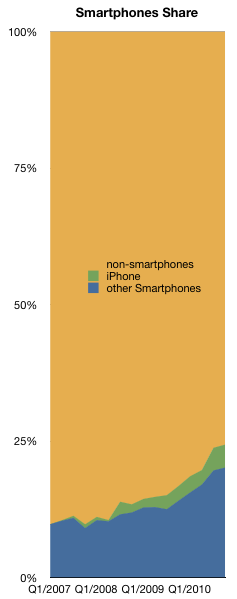
    I still hold that 20% smartphone share is possible for the iPhone. As the smartphone market slowly becomes the entire phone market (see chart to the left) that share will be worth something.

  5. Summary view of Apple's income statement [Updated]

    Research · 22 comments

    Since reporting on the 18th, I've mostly finished going over the the fourth quarter Apple data. Here is a quick summary of the articles that covered the financial and product performance:

    SubjectArticle
    CashHaving added $20 billion last year, Apple’s cash growth suggests total could top $100 billion next year
    GrowthApple’s Growth Scorecard: 63% average earnings growth over 16 quarters
    iPhone pricingThe end of exclusivity doesn’t change the price operators pay for the iPhone
    Sales by product65% of Apple’s sales came from iOS powered devices
    Next quarter’s estimatesEstimates for Apple’s second quarter earnings (ending March)
    Share price/valuationIs Apple a candidate for acquisition?
    Margins and platform mix of profitiOS enables 71% of Apple’s profits. Platform products power 93% of gross margin
    CannibalizationiPhone and iPad: Fine Young Cannibals?
    Operational Expenses$76 billion a year from a tableful of products

    That leaves one more: Summary view of cash flows.

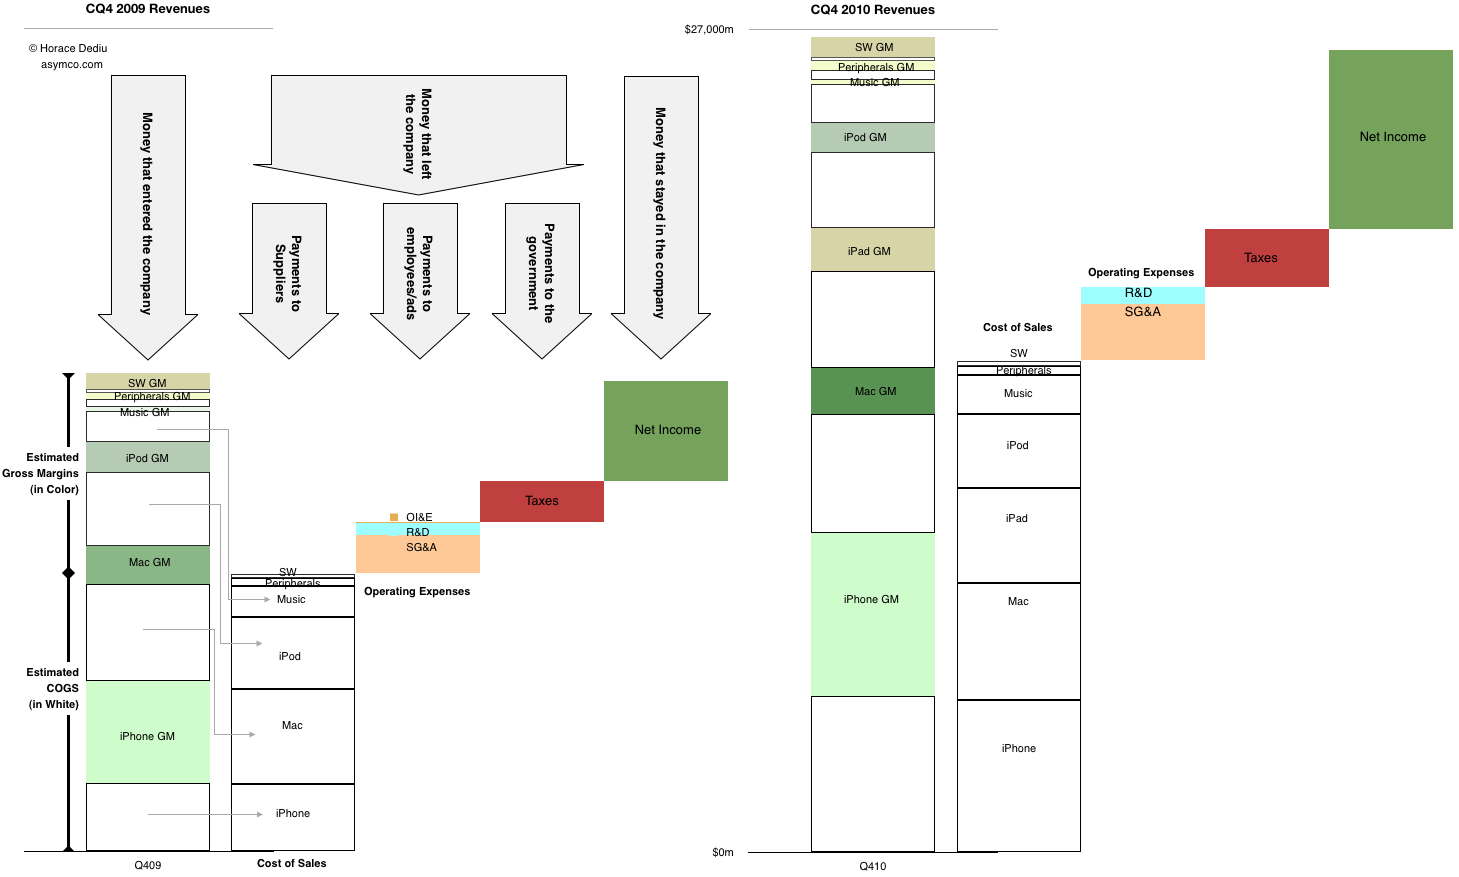
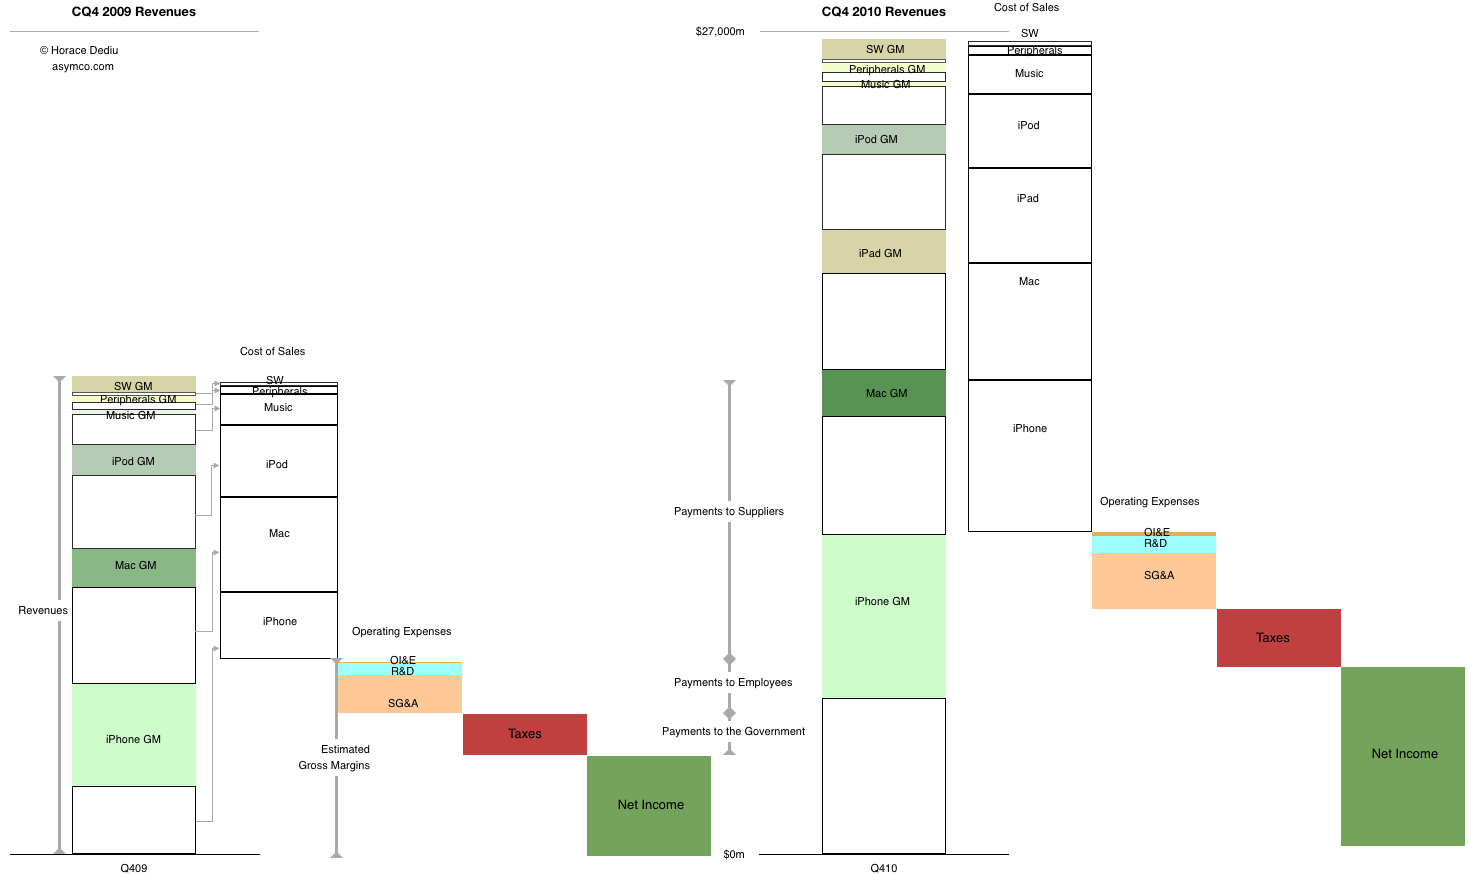
    After introducing it last quarter, this is a chart that I'm trying to improve and use as a single snapshot of growth, product mix, profitability, cost structure and overall sales. The purist in me likes to see the chart clean but it can be a puzzle to some.  So for the sake of explanation, this time I've added some annotations to the year-ago quarter.

    The left half shows flows in the same quarter a year ago and the right side shows the flows in the fourth quarter just ended December 2010. You can see where sales came from, how much of each product's sales went to suppliers and how much was available to pay employees (and who got what). You can also see how much was paid in taxes and what was retained.

    Please click on the figure (requires no scrolling when viewed on screens wider than 1464 pixels).

    [Update] Alternate view using "waterfall".

  6. iPhone and iPad: Fine Young Cannibals?

    Research · 35 comments

    The iPad and iPhone came, saw and conquered new markets. But since the products launched the question on every analyst's mind has been on how much have these products "cannibalized" their brethren the iPod and the Mac.

    This notion of "cannibalization" applies when a product is designed to compete and "eat" the share of another product in a company's portfolio. It has some negative connotations since it implies loss but many times the thinking is that it's better to cannibalize oneself rather than have it done by a competitor.

    But have iPhone and iPad taken share from their competitors?

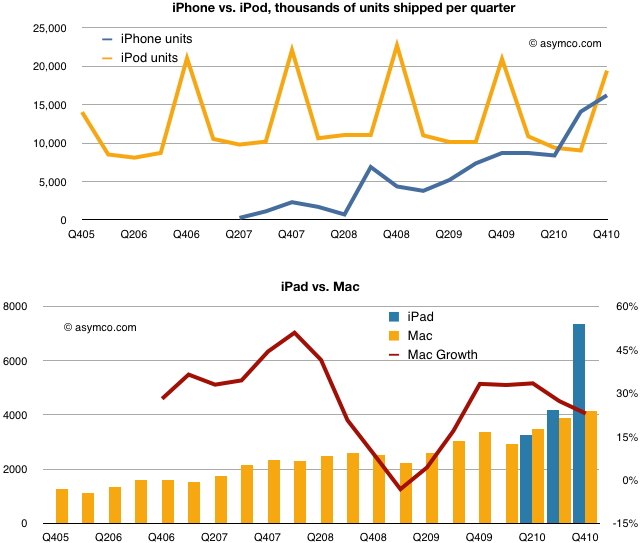
    The following charts compare the total units of iPhones vs. iPods and iPads and iPads vs. Macs.

    The evidence does not show cannibalization.

    Although both iPhone and iPad have crossed over and are selling more units than their internal competitors, the old guard has not faded away.

    Indeed, the Mac shows resilience and the iPod, although not growing in units has maintained sales value. What we don't see is a clear gain for the entrants at the expense of the incumbents.

    We can't be sure how long this happy co-habitation will last, but for now the new products are fine and young but not cannibals.

  7. iOS enables 71% of Apple's profits. Platform products power 93% of gross margin

    Research · 17 comments

    As the highly profitable iPhone makes up an increasingly larger proportion of Apple's sales, the overall gross margin would be expected to grow.

    Sure enough that's what's been happening.

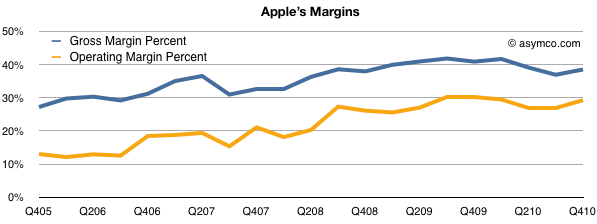
    The gross margin percent, which measures the direct or variable costs of production vs. price, shows a healthy rise in the last five years from slightly below 30% to around 40%. The Operating Margin, which also includes the overhead or fixed costs like R&D and SG&A, shows a similar rise, reaching about 30%.

    Margin expansion while sales quadruple is a good indicator that a company is producing real value not just trading sales volume for profit.

    Focusing attention on individual product lines, it's clear that the iPhone is the largest component of sales and of profits. We don't have specific product line-item gross margins from management, but we can estimate a figure for the iPhone by several means.

    First, we can work out roughly what every other product line's margin is due to their longer histories. (Mac and iPod have reliable profitability estimates). What's left can be deduced to make up the iPhone's margin.

    Alternatively, we can get estimates of the bill of materials and add in some of the other direct expenses like manufacturing, warranties, shipping and incidentals to get an estimate of the cost of production.

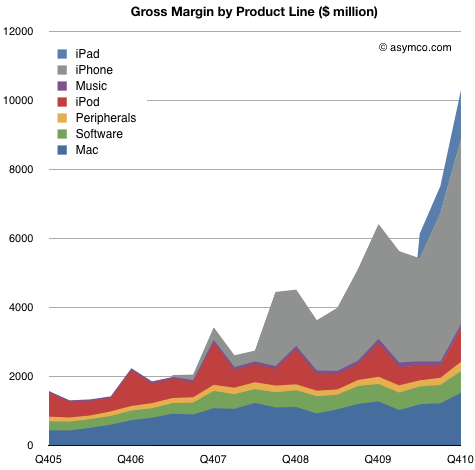
    These methods allow me to guess at a margin for the iPhone of about 50% for the last quarter. Based on these inputs we can plot the gross margins for the entire company's product lines:

    Overall, gross margins have reached over $10.3 billion in the quarter, increasing 543% from five years ago and 61% from a year ago.

    That's great, but by knowing product line profitability we can get a better feel how the company changed strategically.

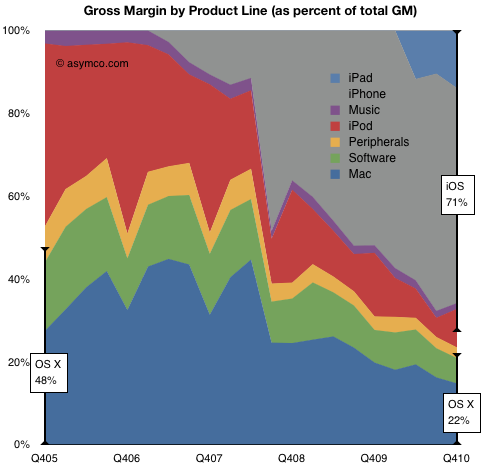
    In the following chart I show the percent of gross profit captured by each product line.

    What we can observe is that at the end of 2005, OS X based products made up nearly half the profits. The rest was mostly the iPod, which was not a software platform product.

    A short five years later, OS X products which, although having grown in volume, made up only 22% of total margin. The rest was mostly iPhone but with significant contributions from iPad and iPod. What's most important to note is that the non-OS X profits are almost all powered by iOS.

    iOS powers about 70% of Apple's current gross profits. Combined with OS X, 93% of profits are from platform products.

    So again the question about Apple being a software, hardware or media company comes back. Perhaps, those categories are not relevant. Perhaps Apple is a platform company.

  8. The end of exclusivity doesn't change the price operators pay for the iPhone

    Research · 55 comments

    AT&T does not pay a higher price for iPhone exclusivity | asymco.

    At the risk of repetition, there are three instances in conference calls that Apple management has stated that the iPhone has a fixed price for all operators and resellers.

    The first was in October 20, 2009:

    “So when you go from exclusive to multiple, you don’t change the charge to the carrier?”

    Cook answered: “Correct.”

    The second was a year later, October 18, 2010:

    Chris Whitmore – Deutsche Bank:  And what is your experience then when you’ve gone non-exclusive from a subsidy and margin standpoint on the phone, have you had to give anything up in the past?

    Tim Cook: We don’t give specific information out on the margins. But I think you can look at our ASPs and see that they’ve generally stayed above $600, and that’s despite opening up several markets from an exclusive market to a non-exclusive market.

    And the third was a few days ago on January 8, 2011:

    Toni Sacconaghi - Bernstein Research:  You've said on previous earnings calls that the move to iPhone non-exclusivity in regions of the world has had no impact on your ASPs. Can you comment on whether that is it still the case today and whether we should expect any impact in the migration away from U.S. exclusivity?

    Timothy Cook: I don't envision the overall iPhone ASP decreasing from the December quarter that we just completed to the March quarter that we're currently in.

    But, as always, we can confirm and validate using the data on pricing we have available.

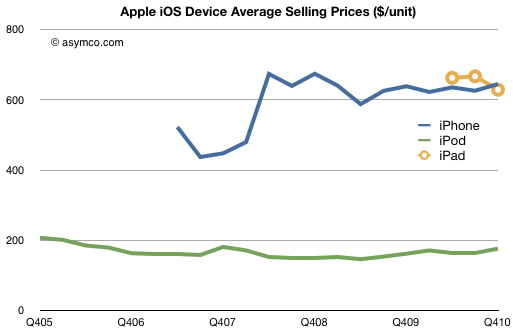
    In this case in the financial reports (take iPhone revenue and divide by units sold):

    You can see that after the first iPhone "2G" which had a peculiar pricing that included revenue sharing with the operator and which showed up differently in the accounting, the iPhone has had a steady price slightly above $600 for over two years[1].

    This is despite having more than 60% sales outside the US and being non-exclusive multi-operator in many countries. Despite being available locked, unlocked and everything in-between.

    We can even confirm what one particular operator paid exactly. In October 2008 AT&T reported that they had paid $900 million for 2.4 million iPhones. That's $375 per phone. Assuming a mix of $199 and $299 3G phones that gives something around $600--below the global ASP for that quarter of about $676. Here exclusivity would imply a discount to average price! The reason for the discount is most likely volume as AT&T was by far the largest buyer of iPhones globally.

    Still unconvinced? Try shopping for an unlocked iPhone at any of various retail locations where it's available unlocked. Accounting for VAT or other taxation, the price is always the same and is a slight mark-up to the operator ASP due to retail margins.

    Judging from comments on this site, the myth that loss of exclusivity in the US will change profit margins for Apple still persists no matter how many times I repeat this story.

    -----

    Notes:

    1. The steadiness of the price should give another huge clue as to the effect of competition on the product.
  9. How exclusivity distorted the US smartphone market

    Research · 69 comments

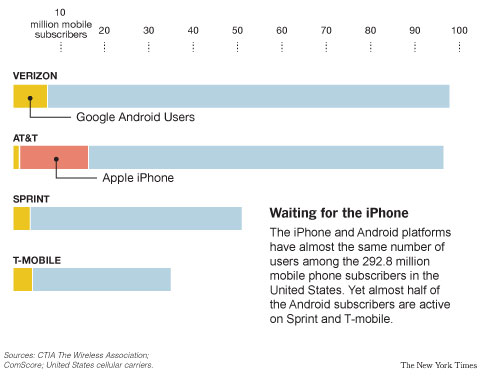
    Here's a wonderful chart from The New York Times:

    Will Apple Put the iPhone on Other Carriers? - NYTimes.com.

    Although the population of Android users is near in size to the population of iPhone users, the concentration in one carrier shows how distribution agreements hamstring platform choice.

    The chart also shows how the iPhone had a huge effect on smartphone adoption at AT&T and how it sucked the oxygen out of the segment for competitors.

    It is possible that we'll see more Android at AT&T and a lot more iPhone everywhere else, but on balance, the chart shows how exclusivity distorted the market.

    It sounded like Tim Cook was really relieved to announce in the earnings conference call that:

    We are not under a contractual exclusivity now in any country in the world. The last one was the United States. We have moved away from those.

    ...

    What I've said before and we have seen this in every case, literally, that we've done, is where we've moved from an exclusive carrier arrangement to a dual- or multi-carrier arrangement, our growth has changed significantly and our market share has increased.

  10. Apple's Growth Scorecard: 63% average earnings growth over 16 quarters

    Research · 30 comments

    In the last quarter Apple's top line grew by 70% and the bottom line by 75%.

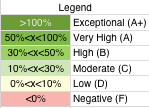
    For a historical perspective, the following table shows year-on-year growth for products[1] and sales/earnings color coded with an arbitrary scoring range.

    The major changes from the last quarter were the acceleration in software sales and the return to growth in iPod sales. iPod benefited from the continuing shift to iOS as the mix is now 50% touch in the portfolio.

    Software growth reached a level not seen since 2008. It's not clear to me yet  which products drove this increase.

    Overall the growth is both wide and deep. I'm most impressed with the iPod as it was a surprise to hear such a high mix of touch.

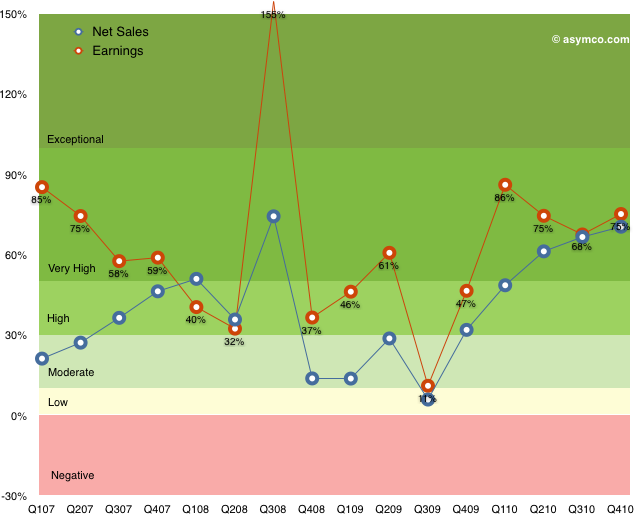
    The following chart shows the top and bottom lines plotted over time with color bands corresponding to the score system in the table above.

    Note how earnings growth has been in the high or very high or exceptional range for all but one quarter over in the last four years[2].

    Apple transcends the mythical "rule of large numbers"[3]. It's not only a mega-cap, but the second largest company in the world by market cap. Not only has this enormously valuable asset just grown in intrinsic value creation by 75% but it has maintained a growth of 70% for the last five quarters.

    If that weren't enough, the average earnings growth has been 63% for the last sixteen quarters.

    ------------

    Notes:

    1. The iPad is not included since we don't have more than one year of sales and this is year-on-year not sequential growth.
    2. The low growth for Q3 '09 was due to the corresponding spike the year before when the iPhone 3G was launched. That launch quarter in 2008 was a seminal turning point in the history of the phone industry when it became clear that the iPhone was not a passing fad. Steve Jobs famously participated in the conference call calling attention to the data which was obfuscated by subscription accounting. Alas, the news was lost in a sea of credit crunch panic.
    3. I have an aversion to this rule as "large" is never defined except in relative terms. For example a $1 trillion market cap may be large because it's unprecedented, but it may be a trifle if the company is priced at book value.
  11. More than 60 apps have been downloaded for every iOS device sold

    Research · 33 comments

    The iTunes App Store is about to reach 10 billion downloads. That makes this a good time to revisit app growth metrics and compare them with the other digital media store that we have data for: the iTunes Music Store.

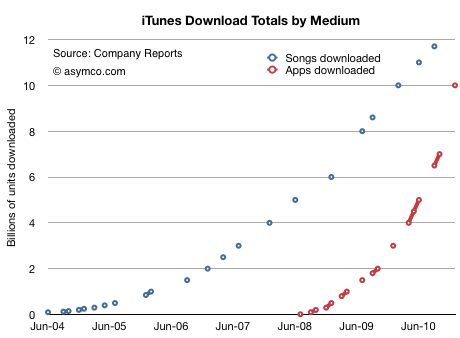
    First, the download totals as time series[1]:

    Assuming that 10 billion will be reached this month, we see how the steepness of the app curve implies that apps will overtake songs within a few months. I suspect by March.

    In September I made the prediction that total apps would overtake total songs sold by the end of 2010. That has not yet happened, but it's close.

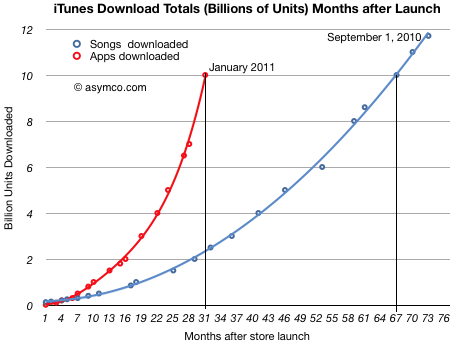
    If we measure downloads as a function of the number of months since store launch, we can see that Apps reached 10 billion downloads in less than half the time it took songs (31 vs 67 months.)

    I used polynomial curve fitting to draw the lines.

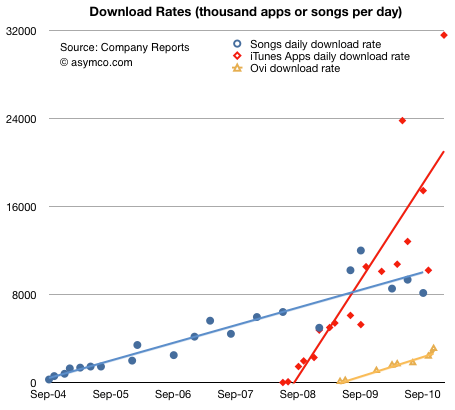
    The other way to look at the data is by measuring the daily download rate. The data is more scattered, but the trend is still clear:

    (The solid lines are linear trendlines. I added the known data from Nokia's Ovi for comparison.)

    The amazing story of this chart is not that apps are running at above 30 million download per day, but that the figure is growing. Growth like this is hard to get one's mind around. Not only are downloads increasing, but the rate of increase is increasing.

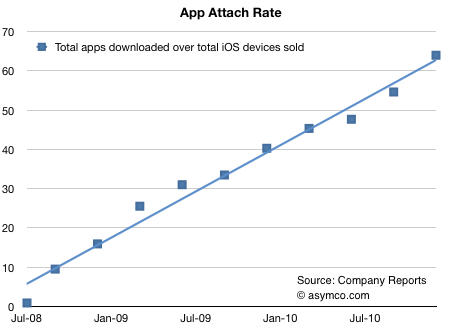
    There is one final piece to put in place on this puzzle. Some might argue that the reason these download rates are increasing is because the installed base of devices is increasing at the same rate. In other words, app consumption could be steady on a per user basis.

    To answer this we need to divide the cumulative apps downloaded by the cumulative devices sold. Using a reliable estimate for iPod touch units sold, we can get a pretty clear picture:

    The number of apps downloaded for iPhone/iPad/iPod touch is running at more than 60[2].

    In the fall of 2008, there were about 10 apps downloaded for every iPhone/iPod touch. Two years later the rate was more than five times higher. There are significant implications for the network effects related to the iOS platform. End user investment in apps is even higher than end user investment in music which created a very tight lock for iPod users.

    I draw three conclusions:

    1. Apps overtaking digital music is a watershed event. Apps are a new medium: they will impact all other media.
    2. As the number of apps attached to any single device continues to increase, apps create increasingly higher switching costs for users.
    3. Apps consumption is increasing at a rate to overtake the PC software market.

    ---

    Notes:

    1. The total apps does not include updates.
    2. The attach rate is actually higher since the figures above assume all devices are still in use.