Asymco

Asymmetric Intelligence

iPhone

  1. The iPhone is not superfluous, not easily copied, not revolutionary and not a premium product

    Research · 61 comments

    The release of the iPhone is rightly acclaimed as a watershed event in the history of telecom. It was a sensation. But it was also a product that was widely underestimated and dismissed. Even today expert opinion is divided. The critics of the product transitioned directly from labeling it a superfluous bauble to an obvious and copyable sustaining innovation. Advocates of the product describe it as revolutionary and dazzling with the potential for capturing significant profit share due to premium pricing and positioning.

    So which is it?

    I'll argue that it's none of the above. The iPhone is not superfluous, not easily copied, not revolutionary and not a premium product. What it is is disruptive.

    First, we have to quickly define disruptive potential.

    A product is disruptive if it competes with an existing, incumbent set of products on a new basis. It competes along a new measure of performance. That means it's either "low end" and hence cheaper, simpler, more modular and conformable, or it creates a "new market" where completely new measures of performance or quality are relevant.

    In both "low end" and "new market" disruptions the product is usually wrapped in a business model that insulates it from incumbent response due to inherent asymmetries. Incumbents will find the economics of the entrant product unattractive and will be motivated to ignore it or actively avoid copying it.

    The consequences of disruptive product entires are often catastrophic for the incumbents because, over time, the disruptor product vacuums up all the profits in the industry, robbing the incumbents of the fuel to respond by the time they become motivated to do so. In essence, the transfer of value to the new basis of competition happens so slowly that the threat is imperceptible until it's too late.

    If we look at this definition, it's startling that the iPhone does not seem to fit.

    As a phone, it's not cheaper, nor modular and hence not "low end". It did not create a new market.  As a phone, although it did recruit more regular phone users into becoming smartphone users, it was not the first or last phone to do so. Its phone business model was not a radical departure. It was not ignored by the mobile phone incumbents who reacted with various degrees of urgency and vigor. It was actively copied in every way from the UI to the ecosystem to the pricing model and distribution.

    The only thing that seems to have happened according to the disruptive formula was the transfer of profits from incumbents to Apple, at least temporarily.

    So the iPhone seems to be correctly classified as a sustaining innovation. Something that moves the phone market forward and which, except for a temporary misallocation of profits, will entrench the incumbents after they manage to copy it effectively.

    However, here is where we have to dig a little deeper.

    Market analysis easily becomes myopic when looking only at a market defined by a product. I've argued in the past that strategic insight comes from looking at products that cross over their market boundaries. Especially products that are hired to do different jobs than the same products in their categories. The iPod may seem like an MP3 player but it caused catastrophic profit collapse in multiple industries. It knocked out the CD business, it crippled the component audio system "Hi-Fi" industry, it razed the music retail business and affected the entire music value chain. It's still pounding at the gates of video and TV production. And, almost as a side-show, it crushed the Walkman.

    Even though it was a music player, the MP3 device market was the smallest target for the iPod. It turned out to be far more dangerous to ancillary industries. The reason is subtle: it competed as an integrated ecosystem. You hired the iPod to serve you music everywhere, not just in your living room. And it did the job in an integrated way from source to earbuds taking what was a hodgepodge of modular components built around analog music and smoothly integrated them to deliver music in new, non-consuming contexts.

    The lesson is therefore that when looking at the iPhone one has to look at ancillary industries not just at phones.

    Phones have always been a component in a wider inter-related telecom value network. Even today they are often called "terminals" in the industry meaning that they are the end points of a network. Similar to the PC, the iPhone enables a migration of intelligence away from the center toward the edge of the network resulting in a de-valuation of the network itself.

    I argue that the real disruption of mobile computing (i.e. iPhone) is made possible not by the smartphone technologies but by mobile broadband. Once broadband became mobile with 3G the smartphone could shift its focus (jobs it's hired to do) from voice to data. That shift is disruptive to incumbents because they built their businesses around operator distribution and operator service economics. With apps, mobile computing brings with it services which allow all communications to be independent of operators. Selling ringtones, maps, email and video-on-demand are all dead business plans today. But operators clung on to these hopes for many years and forced vendors to comply to this strategy.

    The incumbents relied so much on the telecom value chain, where the value flows from the monthly service charge, that they would not deploy technologies or business models that were asymmetric to operator business models. This is the root cause for Nokia and Samsung and Motorola and LG "missing the boat" on smartphones. All the vendors had the pieces of technology on their shelves. But when they took these technologies to their customers, the customers rejected the package.

    This is why entrants like RIM and Apple could easily gain a foothold and grow. They had modest volumes, sold new concepts like business email and new UIs with iconic designs, but did not go after the core business model. This is similar to how iPod/iTunes got a toehold with the record labels. By the time the disruption took hold, operators were addicted to the new high-ARPU being generated even though they were all pure bitpipe plans. A bird in the hand is worth two in the bush, so the new device brands stuck.

    Do the incumbents still have time to respond effectively? It's less and less likely. They cannot build the new computing ecosystem without the distribution power of operators. Note that iPhone 'clones' in Android are still sold via operators and that nobody is interested in making either iPod touch clones or iPad clones sold independent of the operator channel/subsidy model. This is not because of technical or economic reasons but because of a lack of distribution (and lack of integrated content).

    When you step back and look at the phone in the context of the network business model as well as the shifts in consumer jobs to be done you realize the potential is far greater than taking share from incumbents. The iPhone is not divided into a portfolio of different phones, but it's a part of a portfolio of new mobile computing products. It just happens to be the only one which still depends on the cellular operator distribution network.

    Seen as part of a new mobile computing paradigm and following the trajectory of the mainframe, mini-computer, PC and laptop, the iPhone is an essential, non-superfluous device for a vast population of new users.

    Seen as an integrated app ecosystem with strong network effects, it's not easily copied. Responses that only account for it as a glass and metal object of desire will fall way short of being competitive. As the hardware was always available to competitors, it's not a revolution in hardware or even in user experience.

    Most importantly, seen as a computing alternative merged with a communication appliance, it and its siblings are not premium products. The pricing and service structure around it make it seem a low cost alternative for solving the jobs it's hired to do.

    In other words, it is as disruptive as it gets.
  2. Measuring iPad enterprise use

    Research · 25 comments

    I've noticed that there is a lot of speculation on the prospects for iPad use "in the enterprise". Business users could sure benefit from the device and anecdotal evidence does point to many cases of use in business.

    But anecdotes are not conclusive evidence. How can one make a better guess? Based on reader input, I thought I'd test this hypothesis directly on my own stats.

    As pointed out a recent posting on my stats, the iPad has been a popular device in accessing this site. 102k out of 1.06m views came from iPad users. A statistically interesting number.

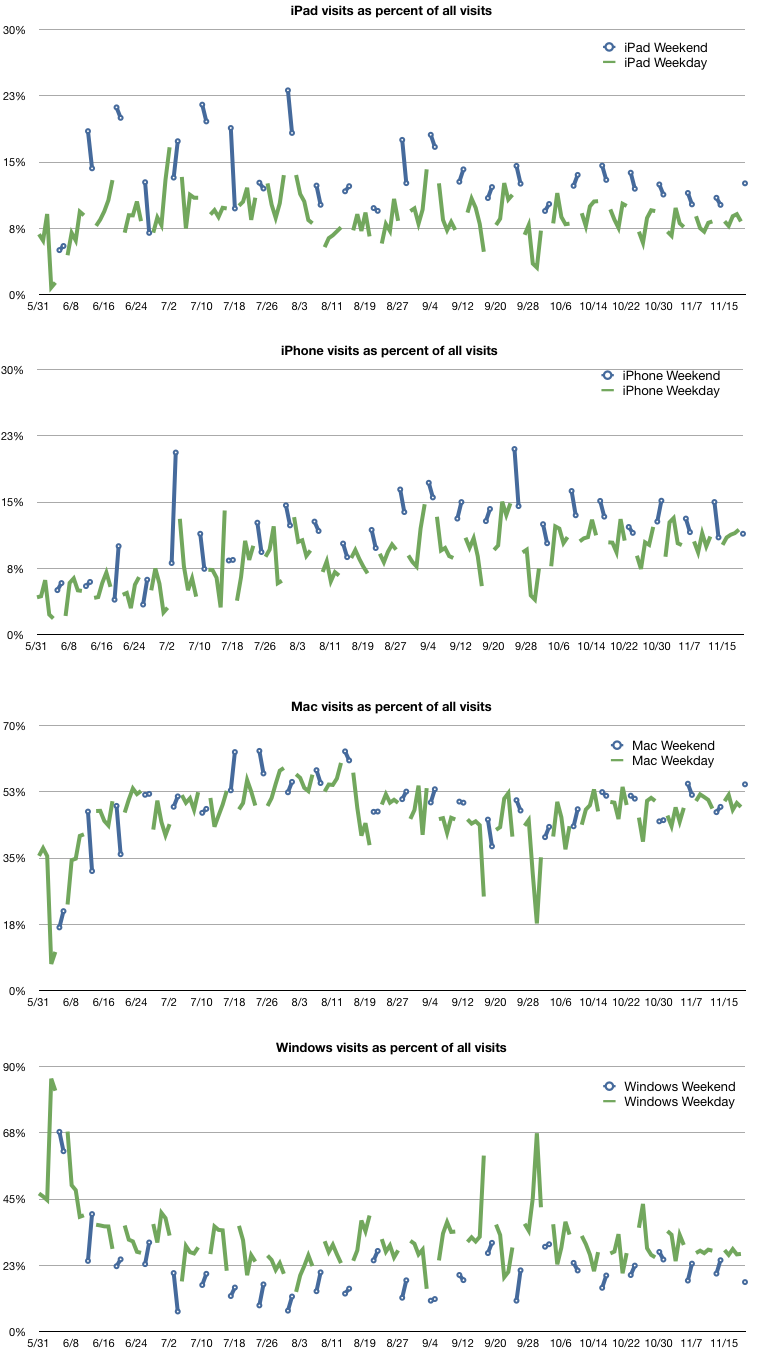
    One way to check enterprise use is to measure the ratio of use of the product during weekends vs. use during weekdays. The logic being that weekend use is almost strictly consumer use and weekday use is mixed. Any normalized significant difference between the two measures should indicate a bias toward consumer use or vice versa.

    The following charts show the percent of each platform's use with weekends separated from weekdays.

    The larger the delta the more likely the more the bias one way or the other. To that end I measured the average percent of visits from iPad (as a total of all visits) for weekends and weekdays and measured the delta between the two. On the weekend the iPad was accounting for 13.3% of visits. On weekdays it was 8.8%. A difference of about 4.5% in favor of weekend use.

    To calibrate that figure I did the same for iPhone, Mac and Windows use.

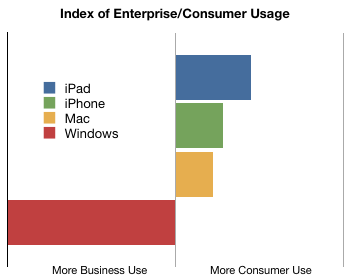
    The following chart shows this ad-hoc index of "enterprise use".

    Essentially the data is inline with assumptions. The iPad is the most likely to be hired by consumers. The iPhone is more than the Mac and they're all far more likely to be consumerized than Windows.

    The average consumption of Asymco.com through Windows was 32% of during weekdays but only 22% during weekends.

    In order to make this measure more meaningful, the evolution over time of these figures should be tracked. If the Blue bar above moves more toward the center then the chances are that iPad will be more adapted by business users, or at least more in use at work.

    Does this seem like a valid method for measuring relative enterprise use?

  3. In three years Apple will still have a minority market share in smartphones

    Research · 36 comments

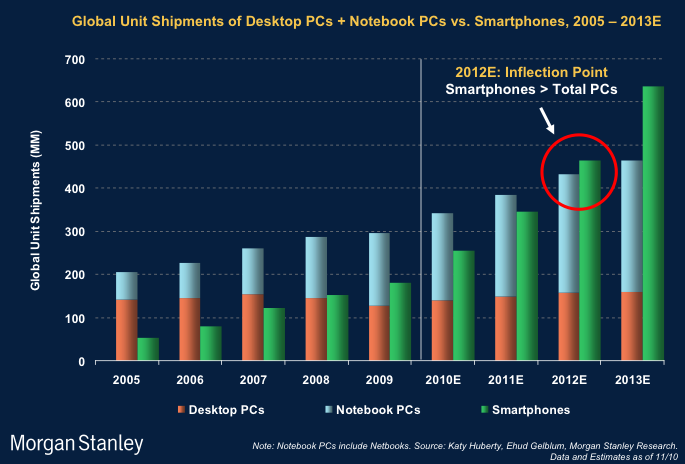
    Morgan Stanley's Web 2.0 update came out yesterday and it's full of nice charts. Here is one:

    Note that the expectation for smartphones to overtake all PCs (including netbooks) will happen when smartphones sell more than 450 million units per year.

    In 2013 nearly 650 million smartphones are forecast to be shipped.

    My estimate for the iPhone in that year is 180 million. That would give iPhone (excluding iPad and iPod) about 28% share. The last quarterly figure is around 17%.

    Perhaps 180 million iPhones per year will be defined as failure by those who consider over 80% share as a threshold for success but I still think it will be a healthy business.

    Even assuming a cut in ASP to about $350, Apple will still be able to get about $62 billion in sales from phones (a bigger number than 2009 total sales for the whole company).

    I would also add that by the end of 2013 Apple will have sold about 470 million iPhones. Though many will be out of use by then, the installed base will not be small (I'd guess about 300 million). Including all iOS devices, 500 million is a credible estimated audience for developers.

    It's entirely possible that Android variants, offshoots and forks will add up to a bigger number by then, but to pre-emptively declare the platform "war" won because the also-ran Apple will only have half a billion users seems disingenuous.

  4. 14 Percent of App Store apps target the iPad

    Research · 9 comments

    From Distimo (registration required):

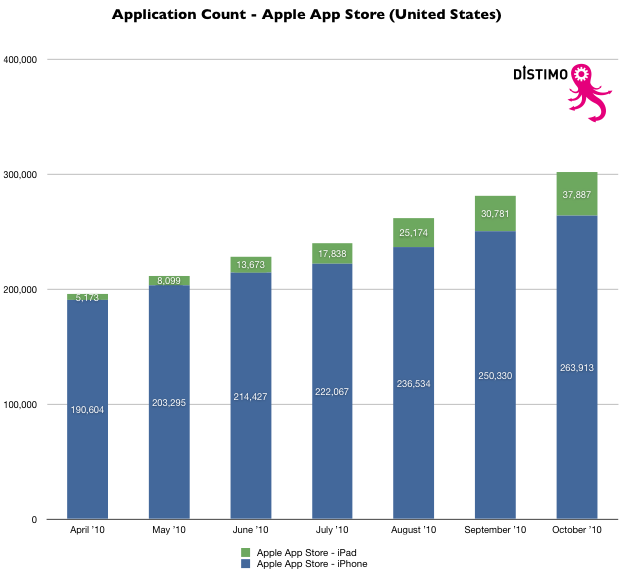
    • The number of applications in the Apple App Store has grown from just under 200,000 in April 2010 to over 300,000 in October 2010.
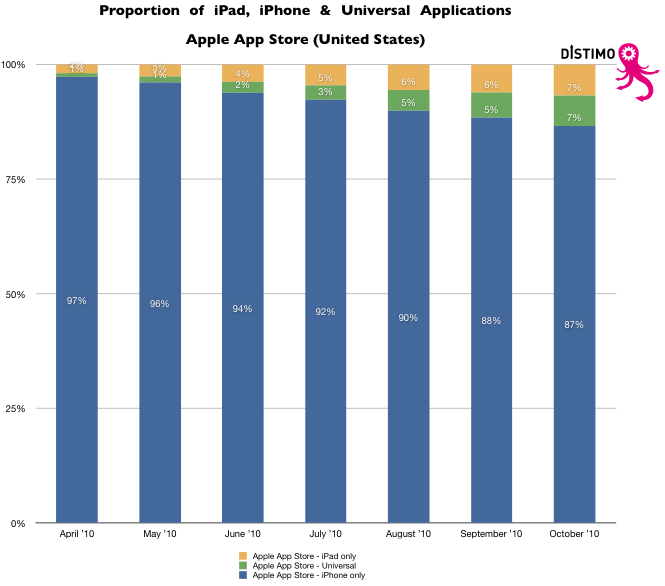
    • The proportion of iPad only applications outgrew the proportion of universal applications during the second quarter of 2010.This trend reversed in July 2010 with the proportion of iPad and universal applications in November being equal (7%).
    • The average price for an application in the Apple App Store for iPad increased from $4.34 in April 2010 to $4.97 in October 2010 (+14.5%). During the same period, the average price of an application in the Apple App Store for iPhone increased only slightly from $3.94 to $4.03 (+2.3%).
    • The average price of the top 100 paid applications in October 2010 is 171% higher in the Apple App Store for iPad than in the Apple App Store for iPhone; $5.80 compared with $2.14, respectively.
    • The lower average price of applications in the Apple App Store for iPhone is due to the fact that a large portion of paid applications are priced at $0.99 (45%), while only 24% of applications are priced at this price-point on the iPad.
    • Angry Birds was the top paid application in both the Apple App Store for iPhone and Palm App Catalog in September 2010. Angry Birds HD was the number three paid application in the Apple App Store for iPad.
  5. Competing with non-consumption: Can Apple sell 100M iPhones next year?

    Research · 30 comments

    [Wedge Partners analyst Brian Blair] also contends that Apple’s production forecasts suggest the company thinks it can sell 100 million iPhones next year. “While a staggering number any way you look at it, our checks reflect full calendar 2010 builds in the 48-50 million unit range,” he writes. “While this number can change and adjust downward or upward  based on demand, we believe it is incredibly bullish that Apple feels it is possible that they could see nearly 100% year over year growth for iPhone in 2011 as this would mean that exiting 2011, Apple would have approximately 10% share in the global handset market.”

    via Apple Can Sell 100M iPhones, 48M iPads in 2011, Analyst Says - Tech Trader Daily - Barrons.com.

    Apple is, in my estimate, likely to sell at least 47 million iPhones in calendar 2010. (16 million in the current quarter, or 85% y/y growth).

    The 100 million in 2011 estimate assumes 100% growth on average. Is it really "staggering" to forecast another year of triple digit growth?

    The history of growth is one indicator. There the news is good: the product has been able to sustain that level of growth for three years.

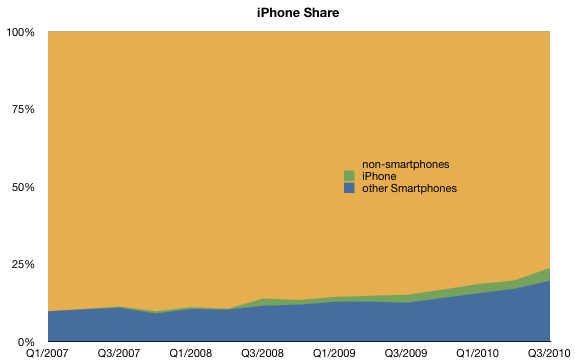
    The second indicator is room to grow. Apple largest competitor is smartphone non-consumption. This competitor holds 76% share, but is rapidly losing share. Consider the the following chart:

    I've heard the mantra that smartphones are not for everybody and that the vast bulk of consumers will opt for voice-oriented phones indefinitely, especially in low-GPD/capita countries.

    To this I point out that there are no technical obstacles to implementing smartphone technology in all price points nor that there are any constraints on distribution, network technology rollouts or shortage of capacity to produce these products for all current mobile users (5 billion at last count). I also believe that user demand for this level of product utility will shift rather more quickly than supply.

    So, in my mind, the headroom looks pretty good as well.

    Lastly there is the question of alternative platforms. I'll get to that shortly.

  6. Postcards for Asymco: metropolitan distribution of views by operating system

    Research · 26 comments

    Based on a reader query, I tried to find out where, by city, my readership is concentrated. I also sought to break this audience down by operating system.

    Here are some observations:

    For the last 30 days, here are the top operating systems used to reach Asymco.com, with the number of views from each.

    1. Macintosh 153,768
    2. Windows 101,329
    3. iPhone 78,716
    4. iPad 34,878
    5. Linux 7,262
    6. iPod 5,516
    7. Android 4,869
    8. (not set) 1,236
    9. BlackBerry 447
    10. SymbianOS 396

    Looking at each OS, I can list the top cities where readers came from.

    Macintosh 153,768

    1. London 6,513
    2. San Francisco 5,316
    3. New York 5,089
    4. Cupertino 4,293
    5. Austin 2,589
    6. Sydney 2,182
    7. Helsinki 2,131
    8. Los Angeles 1,918
    9. Seattle 1,847
    10. Portland 1,482

    Windows 101,329

    1. London 3,827
    2. New York 3,275
    3. Helsinki 1,598
    4. San Francisco 1,504
    5. Seoul 1,409
    6. San Jose 1,260
    7. Chennai 1,226
    8. Sydney 1,116
    9. Seattle 1,100
    10. Melbourne 1,035

    iPhone 78,716

    1. San Francisco 5,203
    2. New York 4,406
    3. London 4,053
    4. Chicago 2,328
    5. Seattle 1,836
    6. Los Angeles 1,638
    7. Melbourne 1,430
    8. Seoul 1,402
    9. (not set) 1,376
    10. Sydney 1,261

    iPad 34,878

    1. London 1,759
    2. New York 1,060
    3. San Francisco 1,020
    4. Chicago 857
    5. Melbourne 739
    6. Outremont 694
    7. Santa Rosa 585
    8. Seattle 555
    9. San Jose 456
    10. Santa Clarita 440

    Linux 7,262

    1. San Francisco 376
    2. London 233
    3. Helsinki 180
    4. New York 131
    5. Cambridge 126
    6. Bangalore 109
    7. Nantes 109
    8. Sydney 107
    9. Perchtoldsdorf 93
    10. Paris 86

    iPod 5,516

    1. Eau Claire 471
    2. Melbourne 396
    3. Seattle 290
    4. Abuja 248
    5. San Jose 214
    6. Hudson 197
    7. Sydney 195
    8. Budapest 109
    9. Boston 95
    10. London 86

    Android 4,869

    1. Seoul 761
    2. (not set) 325
    3. Dallas 248
    4. New York 169
    5. Amsterdam 148
    6. Calcutta 131
    7. San Francisco 81
    8. London 74
    9. Los Angeles 74
    10. Bergen 72

    BlackBerry 447

    1. New York 121
    2. (not set) 78
    3. Waterloo 56
    4. London 50
    5. Buenos Aires 16
    6. Hong Kong 9
    7. Oldsmar 9
    8. Fairfield 7
    9. Wappingers Falls 6
    10. Boston 5

    Symbian OS 396

    1. Helsinki 216
    2. Kauniainen 23
    3. London 21
    4. Seoul 13
    5. Tehran 10
    6. Frederiksberg 6
    7. (not set) 4
    8. Chennai 4
    9. Krakow 4
    10. San Francisco 4

    The first surprise for me is that Seoul is the most popular source for Android views.

    The second is that London is so prominent. Although the US is the biggest source of traffic by far, London is a very concentrated source from the UK.

    The third is how there seem to be no Blackberry readers in the SF area.

  7. iPhone share of all phones sold is now above 4% and continuing to rise

    Research · 22 comments

    I am dead serious. I am now convinced that we have enough data to determine for a fact that Apple will not only see a dramatic decline in quarter-on-quarter sales in units of the iPhone this January-March quarter (which is the predictable pattern and no surprise) but that we will also see a decline in iPhone market share against at least HTC and Blackberry;  that would be demoralizing news in itself. I know now that the numbers are clearly stacking up so, that the annual sales level of iPhone units, will result in a decline in iPhone annual market share in 2010.

    via Communities Dominate Brands: iPhone in Memoriam: A History from its Peak Moment of Success. But who copied whom?.

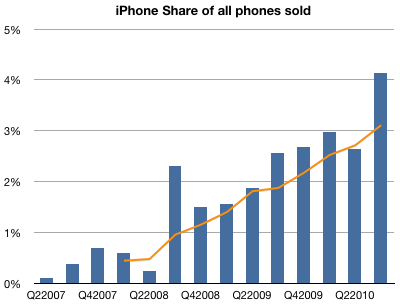
    Contrary to the loud and emphatic proclamations above, the data shows that the iPhone's market share gains have been steady.

    The following chart shows iPhone market share by quarter with a 4-quarter moving average. Total market size is reported by IDC.

  8. Apple's Growth Scorecard

    Research · 14 comments

    Every quarter I try to score growth by top, bottom and product lines. As unforeseen growth is the only driver creating shareholder value, it's of paramount importance to measuring a company's performance.

    For Apple, the analysis is fairly straight-forward. There are relatively few product lines (seven including the iPad). I measure y/y sales growth and try to form a picture that is easy on the eyes and mind.

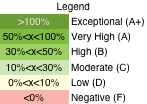
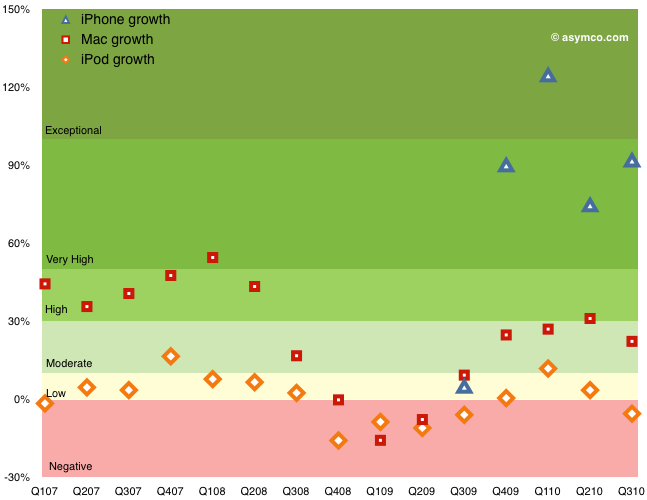
    The method I'm using now is color coding growth for each line according to the legend to the left.

    The table that follows shows each product plus the Net Sales and Earnings lines according to this color coding. I also added an average column for reference.

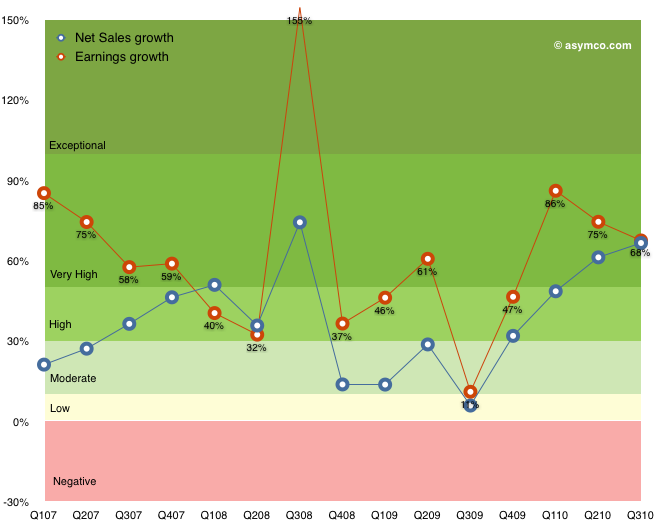
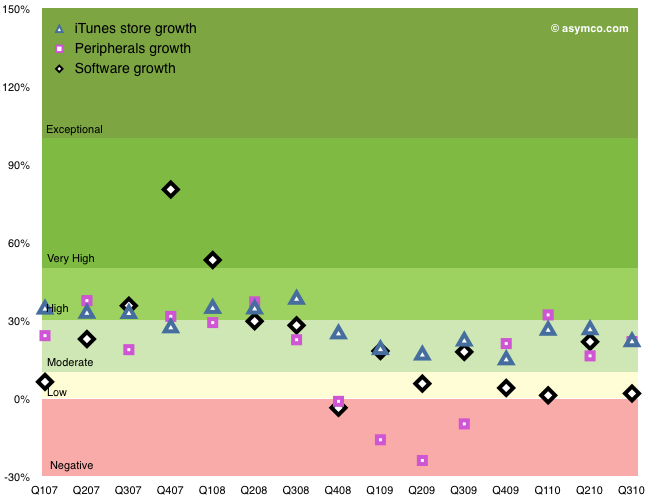
    The following graphs show the same data with color coding for the rates as they change over time. I broke the data into three charts: Top/Bottom lines, Hardware Products, Other Products.

    Discussion

    Hopefully this representation describes the company's growth without requiring too much explanation. Earnings growth, which determines ultimate value created is near all-time highs, well into the "Very High" (A) growth band. Apple have recovered from the Moderate-to-High (B/C) bands during the recession and are near the levels of 2007 when the company was trading at a P/E of 50 (today's P/E for Apple is 20). Sales growth broadly followed earnings growth.

    Within the products, the iPhone again shows exceptional performance. The growth during the first five quarters was (literally) off the scale (above 150%--see table for actuals). The average quarterly y/y growth has been 234%! Last quarter's 92% growth is very near the 100% threshold for exponential growth. This after three years in the market.

    The Mac growth is Moderate (B) and that may be because it was not a launch quarter for portables. The Mac underwent Very High (grade of A) growth for a period of 2008. The iPod shows weakness. The product has been in a Low-to-Negative  (D to F) band of growth since the iPhone launched. Clearly a mature product line but one which has been largely subsumed into the iPhone and iPad. The iPod touch is increasingly a large proportion of the iPod line.

    The non-hardware product lines are Low-to-Moderate growth products. The Peripherals business tracks very closely to the Mac business and dipped negative during the recession.

    Overall, the growth scorecard is in the "Very High" category, or a grade of "A", mostly driven by the iPhone and iPad. Whether this growth will be reflected in the share price is a question reserved for a future discussion.

  9. Visualizing Apple's Profitability

    Research · 26 comments

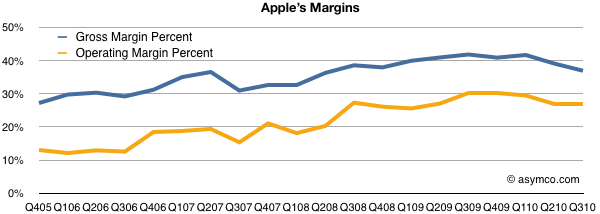
    After the last earnings report, many noted that Apple's gross margins dipped. Turley Muller noted in a letter to PED that the cause was probably the aggressive ramp in iPhone 4 production which broke new records at 14.1 million units.

    That may be. My estimate of iPhone margin shows it dropping to about 49% from the more usual 55% (sometimes even higher).  We'll never know exactly how much, but sometimes margins drop. RIM and Nokia are punished for drops in the GM percent so why shouldn't Apple?

    However, there are some other factors to consider: the overall margin is currently historically very high. As the high-margin iPhone makes up more of the total product mix, the overall margin should be growing. And it is. The chart below shows the trend since 2005. GM was in the high 20's five years ago.

    Note however the other margin: operating margin. After taking the fixed costs into consideration (which we saw to be shrinking as a percent of sales), Apple's bottom line profitability has been rising slightly more rapidly than the GM. It has plateaued recently but not dipped significantly.

    Also note that there have been dips in the past from which GM expansion resumed. One such dip was at the launch of the first iPhone in 2007, though we can't be sure that was attributed to the iPhone itself or to other factors like that most cited by management: components costs.

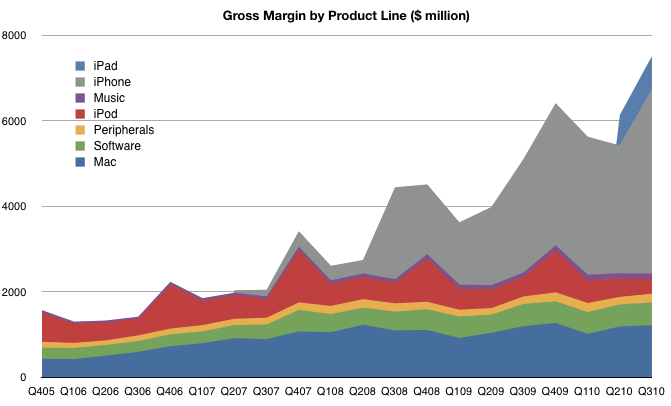
    However, the bottom line profitability is only part of the picture. It would be instructive to look at which product contribute how much. You won't see this analysis often because the gross margin by product is not published by Apple and it takes quite a bit of guesswork to get there.

    I maintain product-level gross margins and compute the overall GM bottom-up. The product-by-product line profitability is based on several assumptions which I won't detail here, but those assumptions lead to the following contribution chart:

    There are several takeaways here:

    1. The iPhone is huge (57% of gross profits). It is far more important than most people assume. Without it, the company would not have materially grown EPS since 2007.
    2. The "Music" which includes iTunes revenues is tiny. Many people assume that iTunes is a large contributor to Apple's operating profitability but operating margins on the store are 10 percent. Peripherals add more to the bottom line than the iTMS/App Store. The benefit of the iTunes/App Stores is in the hardware sold.
    3. Software contributes more now than the iPod. This is completely under everyone's radar but Apple's software business has been growing and with 80% gross margins (assumed) it's a big part of the profit picture.
    4. The iPad margins are lower than the iPhone. As it grows in volume, the profit share will grow, but it's a long way from being the profit share leader.

    This picture should also be a warning to Apple's competitors. If they seek to grow shareholder value and shift profits away from Apple they need to see just how much of that profit is captured in hardware. At the same time, they need to realize that it's the non-hardware businesses which make the hardware so desirable. Like it's products, Apple's income statement is very inter-dependent.

  10. 63 percent of iPhones were sold outside the US in Q3

    Research · 7 comments

    [AT&T] activated 5.2 million iPhones in the wake of the iPhone 4 launch, or about a 62.5 percent leap over an already record spring

    via AT&T blows past records, activates 5.2m iPhones in summer | Electronista.

    This means 63% of iPhones sold outside the US last quarter.  This is down from about 70% earlier this year. As it was a launch quarter and distribution was much more constrained outside the US, the lower figure is not surprising.

    It's still important to note however that sales outside the US are far larger than in the US but penetration and share is far less.

  11. Deagol: Fiscal 4Q '10 actual results vs. estimates

    Research · 9 comments

    Comprehensive and thoughtful review of the performance of the analyst cohorts in predicting Apple's quarter:

    Deagol's AAPL Model: Fiscal 4Q '10 actual results vs. estimates.

    By Daniel Tello's ranking I was first in Q2 but 8th (out of 38) in Q3. Overall, bloggers beat Pros but by a lower margin than in the past.

    I have been ok at estimating product line performance and top line sales but not so good in guessing margins. Last quarter I went for a high iPhone number (13 million vs 14.1 actual and 11.39 Pro/12.07 Blogger consensus) and middle-of-pack on iPads (5 million vs. 4.2 actual and 4.79 Pro/5.52 Blogger consensus). The total iOS units I forecast was 18 million and Apple sold 18.3 so I was fine on units and pricing.

    My guess on the cause of my estimate failure on margins was iPhone 4 rollout ramp. I had to take iPhone margin down to below 50% (about 49%) to make the reported total GM. iPhone has been, on average, running at 52% over the life of the product.

    PED's rankings are here.