$50 billion in cash and Apple execs bawling that they can't ship enough product.
"iPhone 4 demand remains very robust and despite efforts to close the supply-demand imbalance and the continued supply ramp, Apple still cannot meet iPhone demand,"
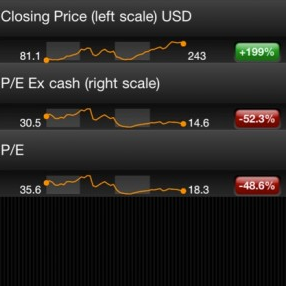
Apple's continuing valuation struggle continues to fascinate. While underperforming on a multiple basis both the S&P 500 and its own historic value, Apple is nearing bargain bin pricing.
To illustrate this further, get the new Asymco Data Download for the iPhone.
You can now use an iPhone to visualize how the owners of the company that created it are being punished.
In first half of 2010, iPhone and iPod touch traffic increased from 33.9% to 41% in Finland. Apple's devices account for a very small percent of the total phones in use in Nokia's home country.[1] The analysis was performed by QAim on a sample of 64 million "mobile downloads".
Taiwanese operators Chunghwa Telecom and Taiwan Mobile have reported much interest in iPhone 4 pre-orders. Both operators announced at 9pm on 26 August they would open pre-ordering at 10am on 27 August and both operators saw their websites crash, the China Post reports. By noon, some 10,000 users had signed up with Chunghwa Telecom and by 11am Taiwan Mobile had sold out all of its 3,000 iPhone 4 handsets available for pre-ordering. Rival Far EasTone said between 30,000 and 40,000 people signed up for a phone on its website and the operator will notify people that will be able to get the handset.
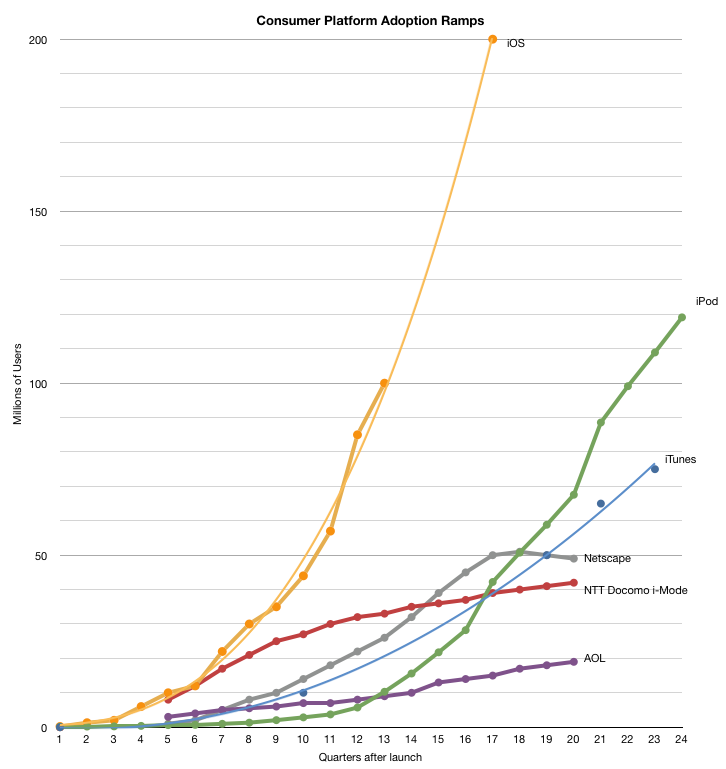
Brian Marshall, an analyst with investment firm Gleacher & Co., predicts that Apple will have sold 200 million iOS devices by this time next year. He expects the iPhone and iPad to represent 68 percent of gross margins for 2010.
My expectations for the next 100 million were made in June:
My expectation is that well over 100 million iOS devices will sell during 2011, but even during the next 12 months (2H ’10 and 1H ’11) the total may well reach 100 million, making 200 million installed by June 2011 very likely.
My current expectation is that iPhone and iPad will account for 70 million additional iOS units for the twelve months following this June quarter. This excludes any Apple TV units moving to iOS.
As iOS moves to more of the iPod line-up it's quite possible that another 30 million iPads with iOS will ship in the same time frame making Marshall's forecast sound reasonable.
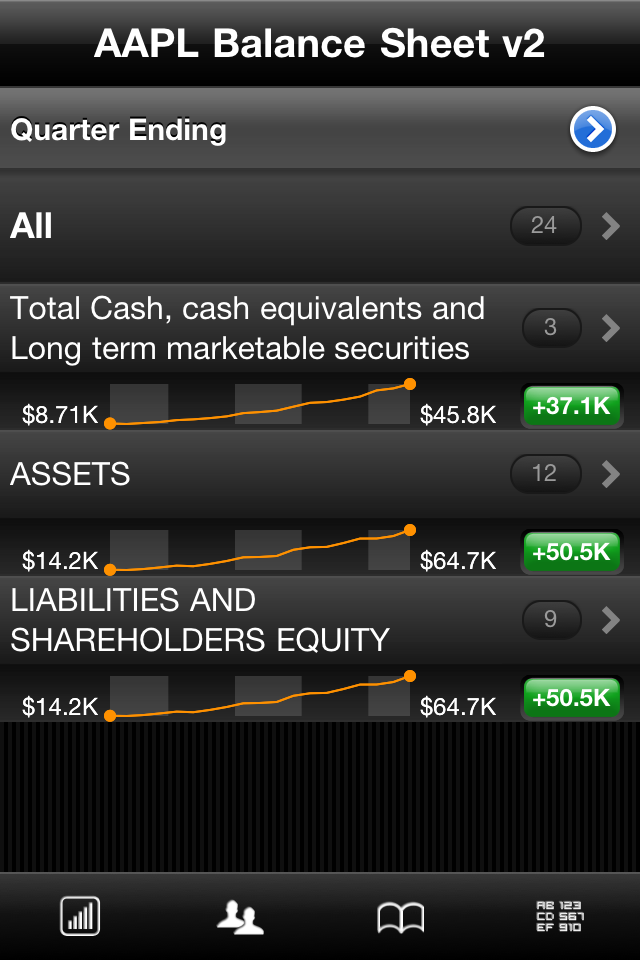
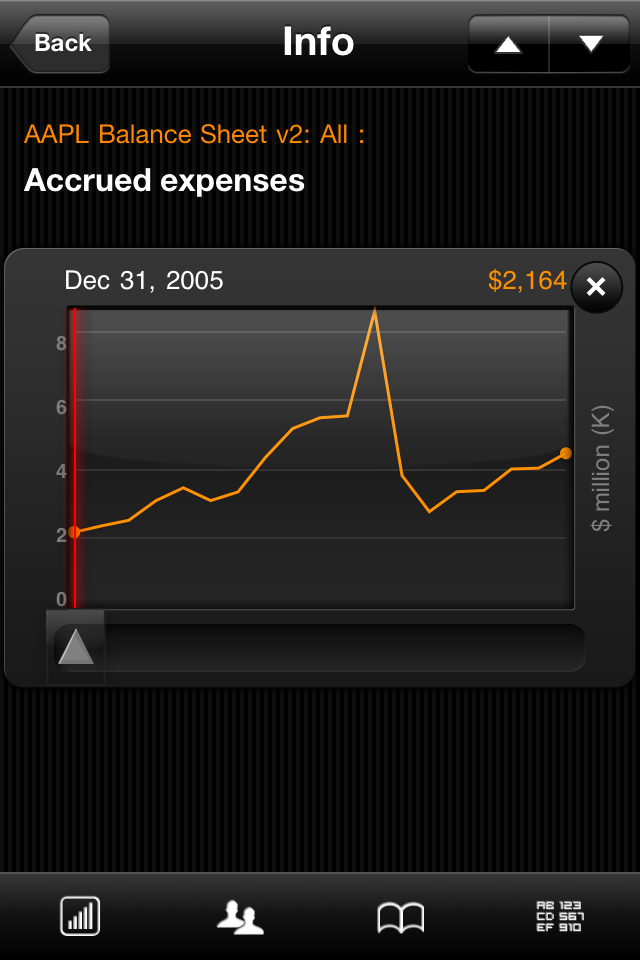
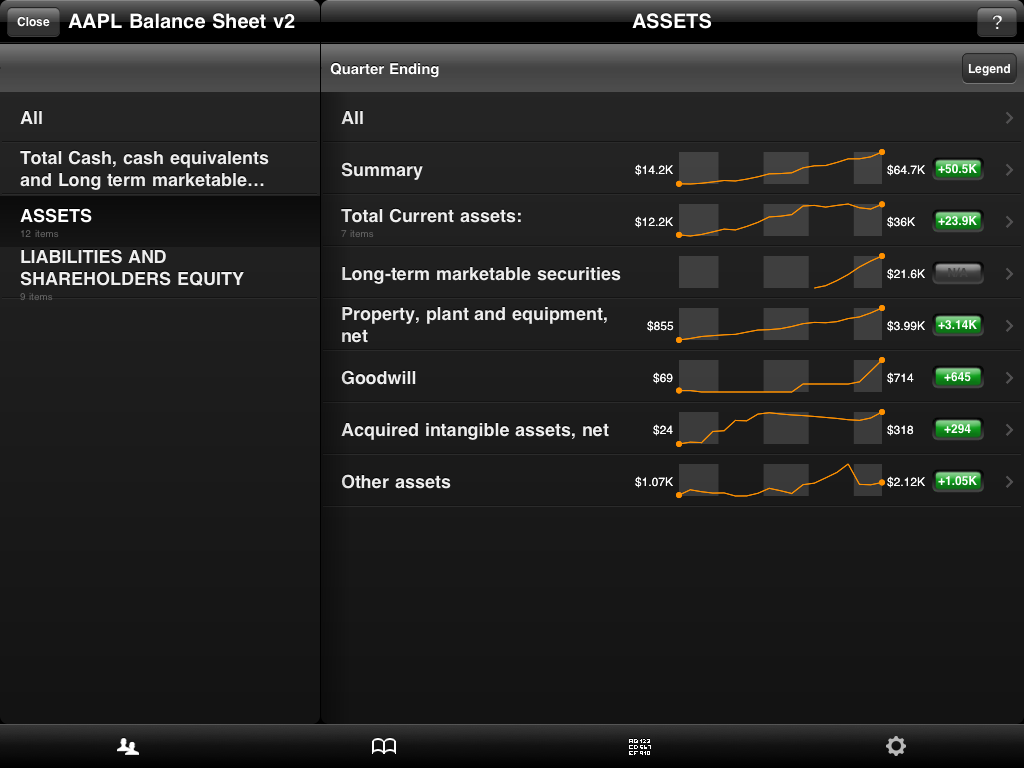
Let your fingers do the walking through Apple's income statements since FQ1 2005. Glide effortlessly through juicy bits of assets and liabilities. Slide your finger through nineteen quarters of financial goodness.
A special bonus: included is a separate visualization of Apple's liquid assets: cash, cash equivalents, Short-term marketable securities and Long-term marketable securities. $$$$$!
Brilliant to use and look at on both iPhone, iPad and iPod touch:
Much of what is published here relies on data, lots of data. It's important that data be published along with conclusions, but data in spreadsheets is often difficult to read. Spreadsheets are not "productized" so they are hard to explain and therefore impossible to share.
However, I am considering sharing the data I have in a format that is easier to read than a spreadsheet but richer than a screen shot of a chart.
To that end I've begun experimenting with a solution based on a service called Roambi. Interested readers can download Asymco authored "roambi" files which I call ADDs (Asymco Data Downloads) will display rich data sets on iOS devices. These representations are interactive and easy on the eyes.
Rather than bore with details, the following images should be sufficiently descriptive.
A: Hopefully you won't need help, but there is help in the app and at Roambi's site.
Q: Will ADDs work with Android?
A: No.
Q: Will ADDs work with <insert non-iOS device here>?
A: No.
Q: Can I see ADDs on a Windows PC or with a Mac?
A: No.
Q: Can I download the actual spreadsheets?
A: No.
Q: How much does it cost?
A: ADDs are free.
Q: What if I see an error?
A: Send me a message.
Q: Will you publish more of this data, like the Apple financials?
A: Yes. I hope to publish all my data. Stay tuned.
Q: I don't have time to read your blog every day, can I just get the data?
A: I'm considering ways of creating a "premium" service. If you are interested send me a message that you would like to receive email-based links. Send request to: horace.dediu -at- asymco.com.
I installed HTC's leaked version of 2.2 on my incredible last month. It has been noticeably faster, has better battery life, and the extra features are nice. As expected, Verizon put a lock down on the wifi tethering feature, and if I want to use it I have to pay an ADDITIONAL $25/month, which is completely ridiculous. Luckily, my phone has been rooted (it was the only way to get froyo on there) and I can use a number of FREE wifi tethering applications that don't cost anything extra per month either.
It's pretty sad that the only way to enjoy an android phone is to hack the crap out of it, and doing so requires relative technical expertise.
Reminds me of Windows Mobile in another way: the only real fans were those who could play with cooked ROMs. Conversely, imagine if the only iPhone fans were those who jailbroke/unlocked iPhones.
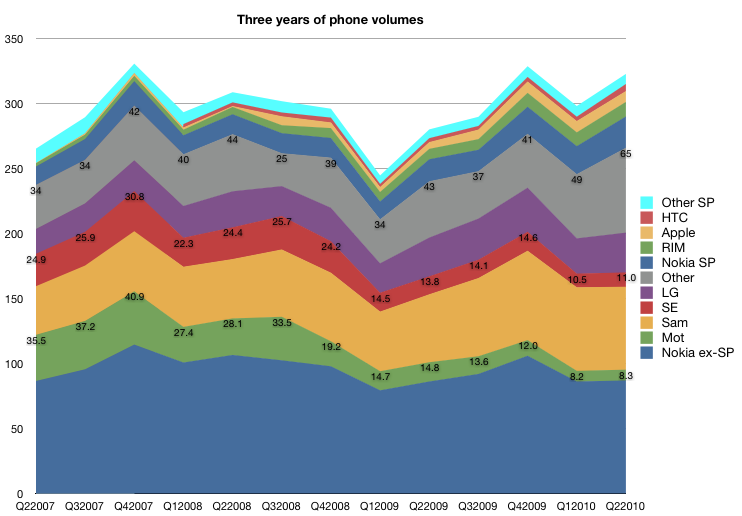
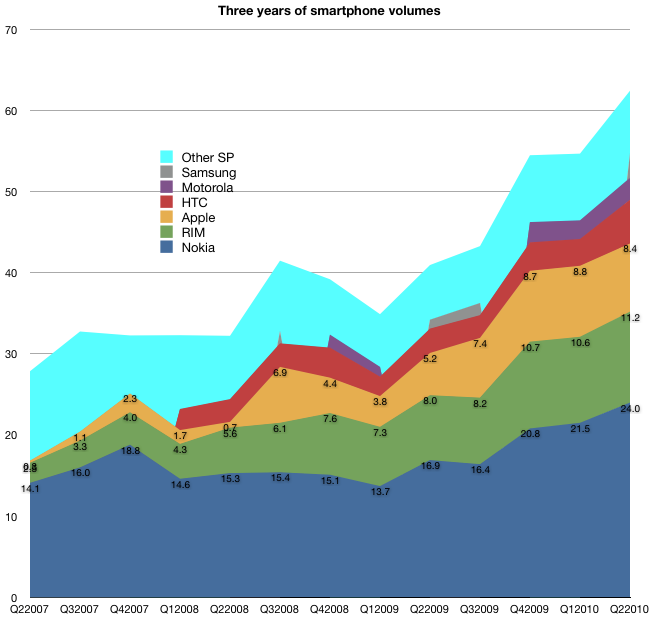
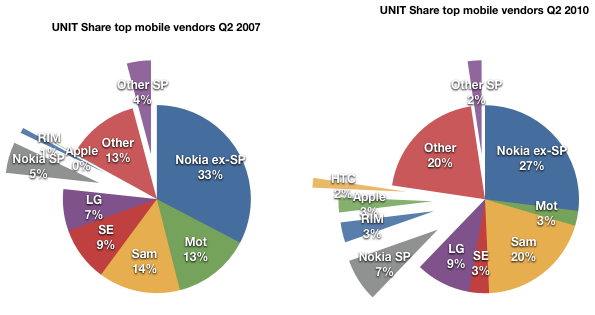
I did not include all vendors for various good reasons. The first survey (market share) did include an "others" category that made the volume data complete, but in the financial data sets, I chose to include the top 7 vendors that make up 80% of device volumes.
One noteworthy vendor that was not included was HTC. HTC is an important vendor for several reasons:
it's a pioneer in smartphones having made the first Windows Mobile devices and the first Android devices
at one point it sold 80% of all Windows Mobile devices
even if it did not brand its devices, it was the name behind many re-branded or white-label operator branded phones
it has a brand of its own today and is expanding its reach
HTC has been around building devices since 2001 and so it would be a pity to exclude them from any analysis of the effect of iPhone on the market or any discussion on the effect of smartphone disruption on feature phones.
The challenge with HTC was that historically their branded devices and white label devices were not reported by the company separately. This matters because white label devices are valued differently. Typically these devices are not marketed by the original manufacturer so SG&A is not applied to their cost base. Operating margins, ASPs and hence profitability is not directly comparable with other OEMs.
But HTC has recently changed its reporting. Thanks to a reader I discovered that, since 2008, HTC has been listing its ASP and Operating Margin making direct comparisons possible. I still don't have all the data, but enough to add HTC to the analysis.
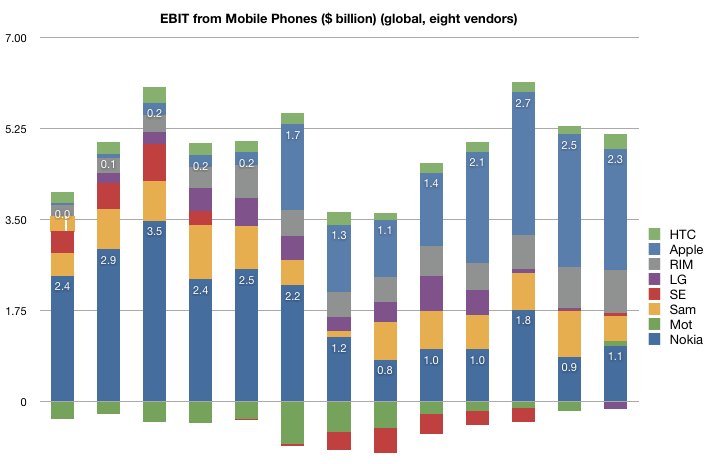
So, here are the 5 industry performance criteria, now with eight vendors listed.
Volumes
Note that HTC volumes start in 2008.
The volume of units HTC sold has been increasing at about the rate of market growth.
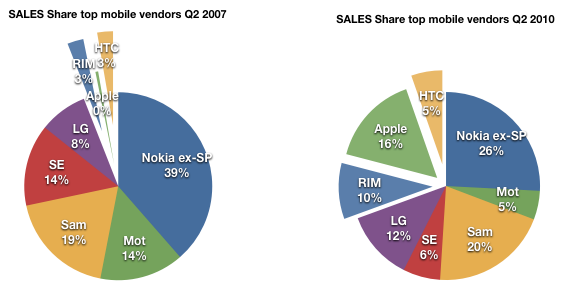
As a result, HTC's share has not increased as dramatically as those of the other smartphone entrants.
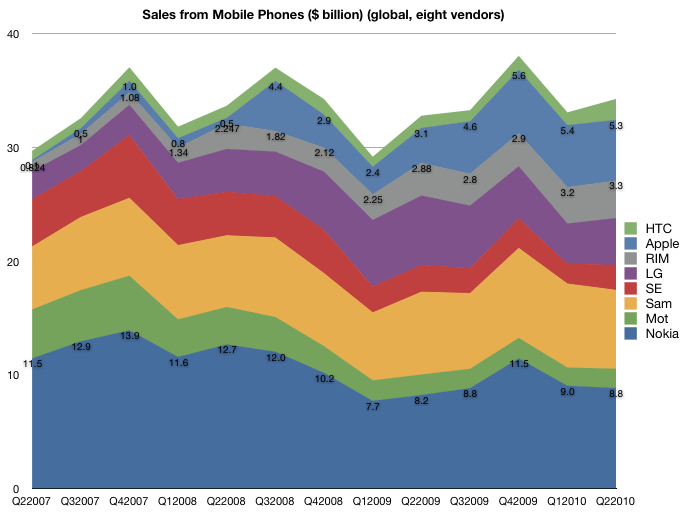
Sales
A similar story in the sales picture. Although a consistent performer, the growth has not matched that of RIM and Apple.
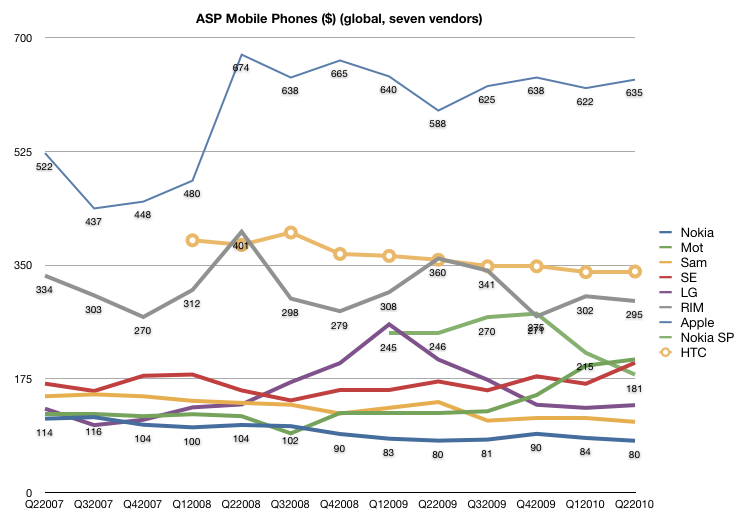
ASP
The pricing story is also a mixed one. Although HTC lies between RIM and Apple in price, the erosion is more consistent with RIM and the rest of the industry.
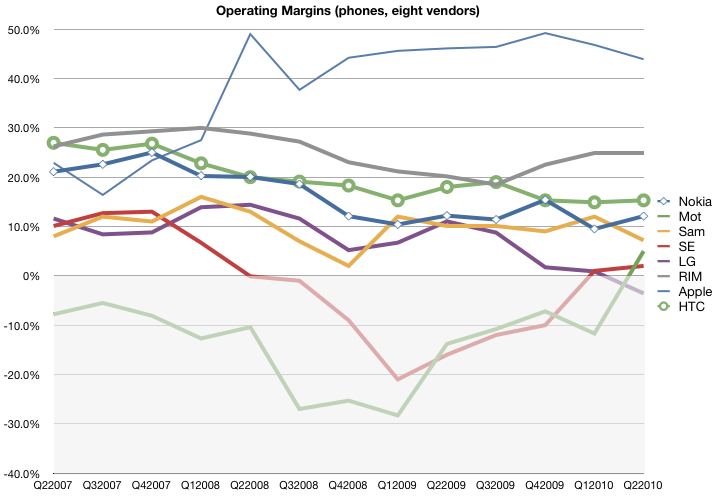
Margin
The margin story is also not as positive as one might expect. The margins for HTC started out above Apple and RIM but have dropped to closer to industry average. This is not what one might expect from an exclusive smartphone vendor.
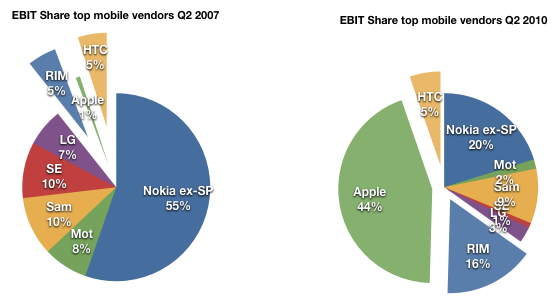
Earnings
The share of earnings has remained unchanged at 5% over the period of iPhone presence. It's perhaps a credit to HTC that they did maintain their position in the market with the massive change that has come to pass.
However, here we also have to ask if HTC is riding a disruptive wave.
When I wrote the last series, my definition of “loser” was a company that had faced a long series of operating losses and has no viable software assets of its own, making it vulnerable to Android (and Windows Mobile). Motorola first, Sony Ericsson second and LG now coming into the picture. Nokia is not a loser in this sense since it has remained profitable and does maintain an investment in software. Same with RIM and Samsung (now with Bada). When/if they do have the near death experience, they might opt for the Android lifeline (flimsy as it is).
However HTC does not fit the mold of either "winner" or "loser". It's the Goldilocks company, not too hot, not too cold.
But I would add that HTC is not an example of a winner because of its adoption of Android. HTC’s dependence on Windows Mobile made their move to Android the most desperate of all. Unlike the larger OEMs, who had their low end devices to fall back on, they are completely dependent on a smartphone OS vendor. When WinMo was showing the first signs of crisis in 2007, they were the first to flee to Android (think of why they would risk the wrath of Microsoft for something so fragile as Android in 07). They are also trying hard to escape the dependence by building up their own UI (SenseUI) and I would not be surprised if they move to their own OS in the future. Being associated with Android does not confirm them as "winners" but in fact, shows their vulnerability.
What does this all say about Android?
Again here my thesis is that Google chose to sustain the industry rather than try to upend it. I don't judge their motives, but the fact is that with Android, Google is not in a position to disrupt telecom. There were high hopes dashed with the Nexus One and hearts broken with net neutrality and now there are patent wars to be fought. Android, with its licensees, is still at the mercy of operators.
On the iPhone, the firm raised their production forecasts from 14 million units to 18+ million, aided by easing constraints of display panels. Checks show consistent shortage of iPhone 4 inventory at Apple stores and there continues to be a three-week shipping delay from Apple's online store, the firm notes. As a result the firm has increased confidence in its 4QFY10 iPhone unit estimate of 11.6 million, which is up 39% sequentially.
On the iPad, the firm's build forecasts were revised up from 6 million to 7 million, which compares to their iPad shipments estimate of 4.75 million. The firm believes [there] is upside to the Q4 estimates and CY10 estimates of 13.4 million units, given the strong demand and anticipated production ramp heading into the back-to school and holiday seasons, as well as the high level of interest from business customers as expressed by AT&T.
These sound reasonable and credible. Note that production forecasts don't translate into sales forecasts as there is inventory, and some of that inventory will be held by Apple and some by the manufacturer.
My Q4 estimate sits at 12.1 million iPhones and 4 million iPads.