Asymco

Asymmetric Intelligence

market cap

  1. The problem with the P/E ratio

    Research · 1 comment

    Why the most common measure for valuation is inadequate in an age of AI

    Software and services companies like Google, Microsoft, Amazon, Meta are spending on Capital Expenditures at the rate of heavy industry manufacturing. This defies their description as "asset light" business models which depend on services, distribution or platform economics.

    The problem isn't just semantic. It is that for their entire existence, these companies were valued for their profitability and measured in terms of a P/E ratio and earnings growth. The situation has changed dramatically. Their revenues are up, the earnings are up and growth is up and share prices are way up. But not their P/E ratios. Why is this?

    Consider the graph below showing the (forward) P/E ratios of the Dot Com market leaders vs. the market leaders today.
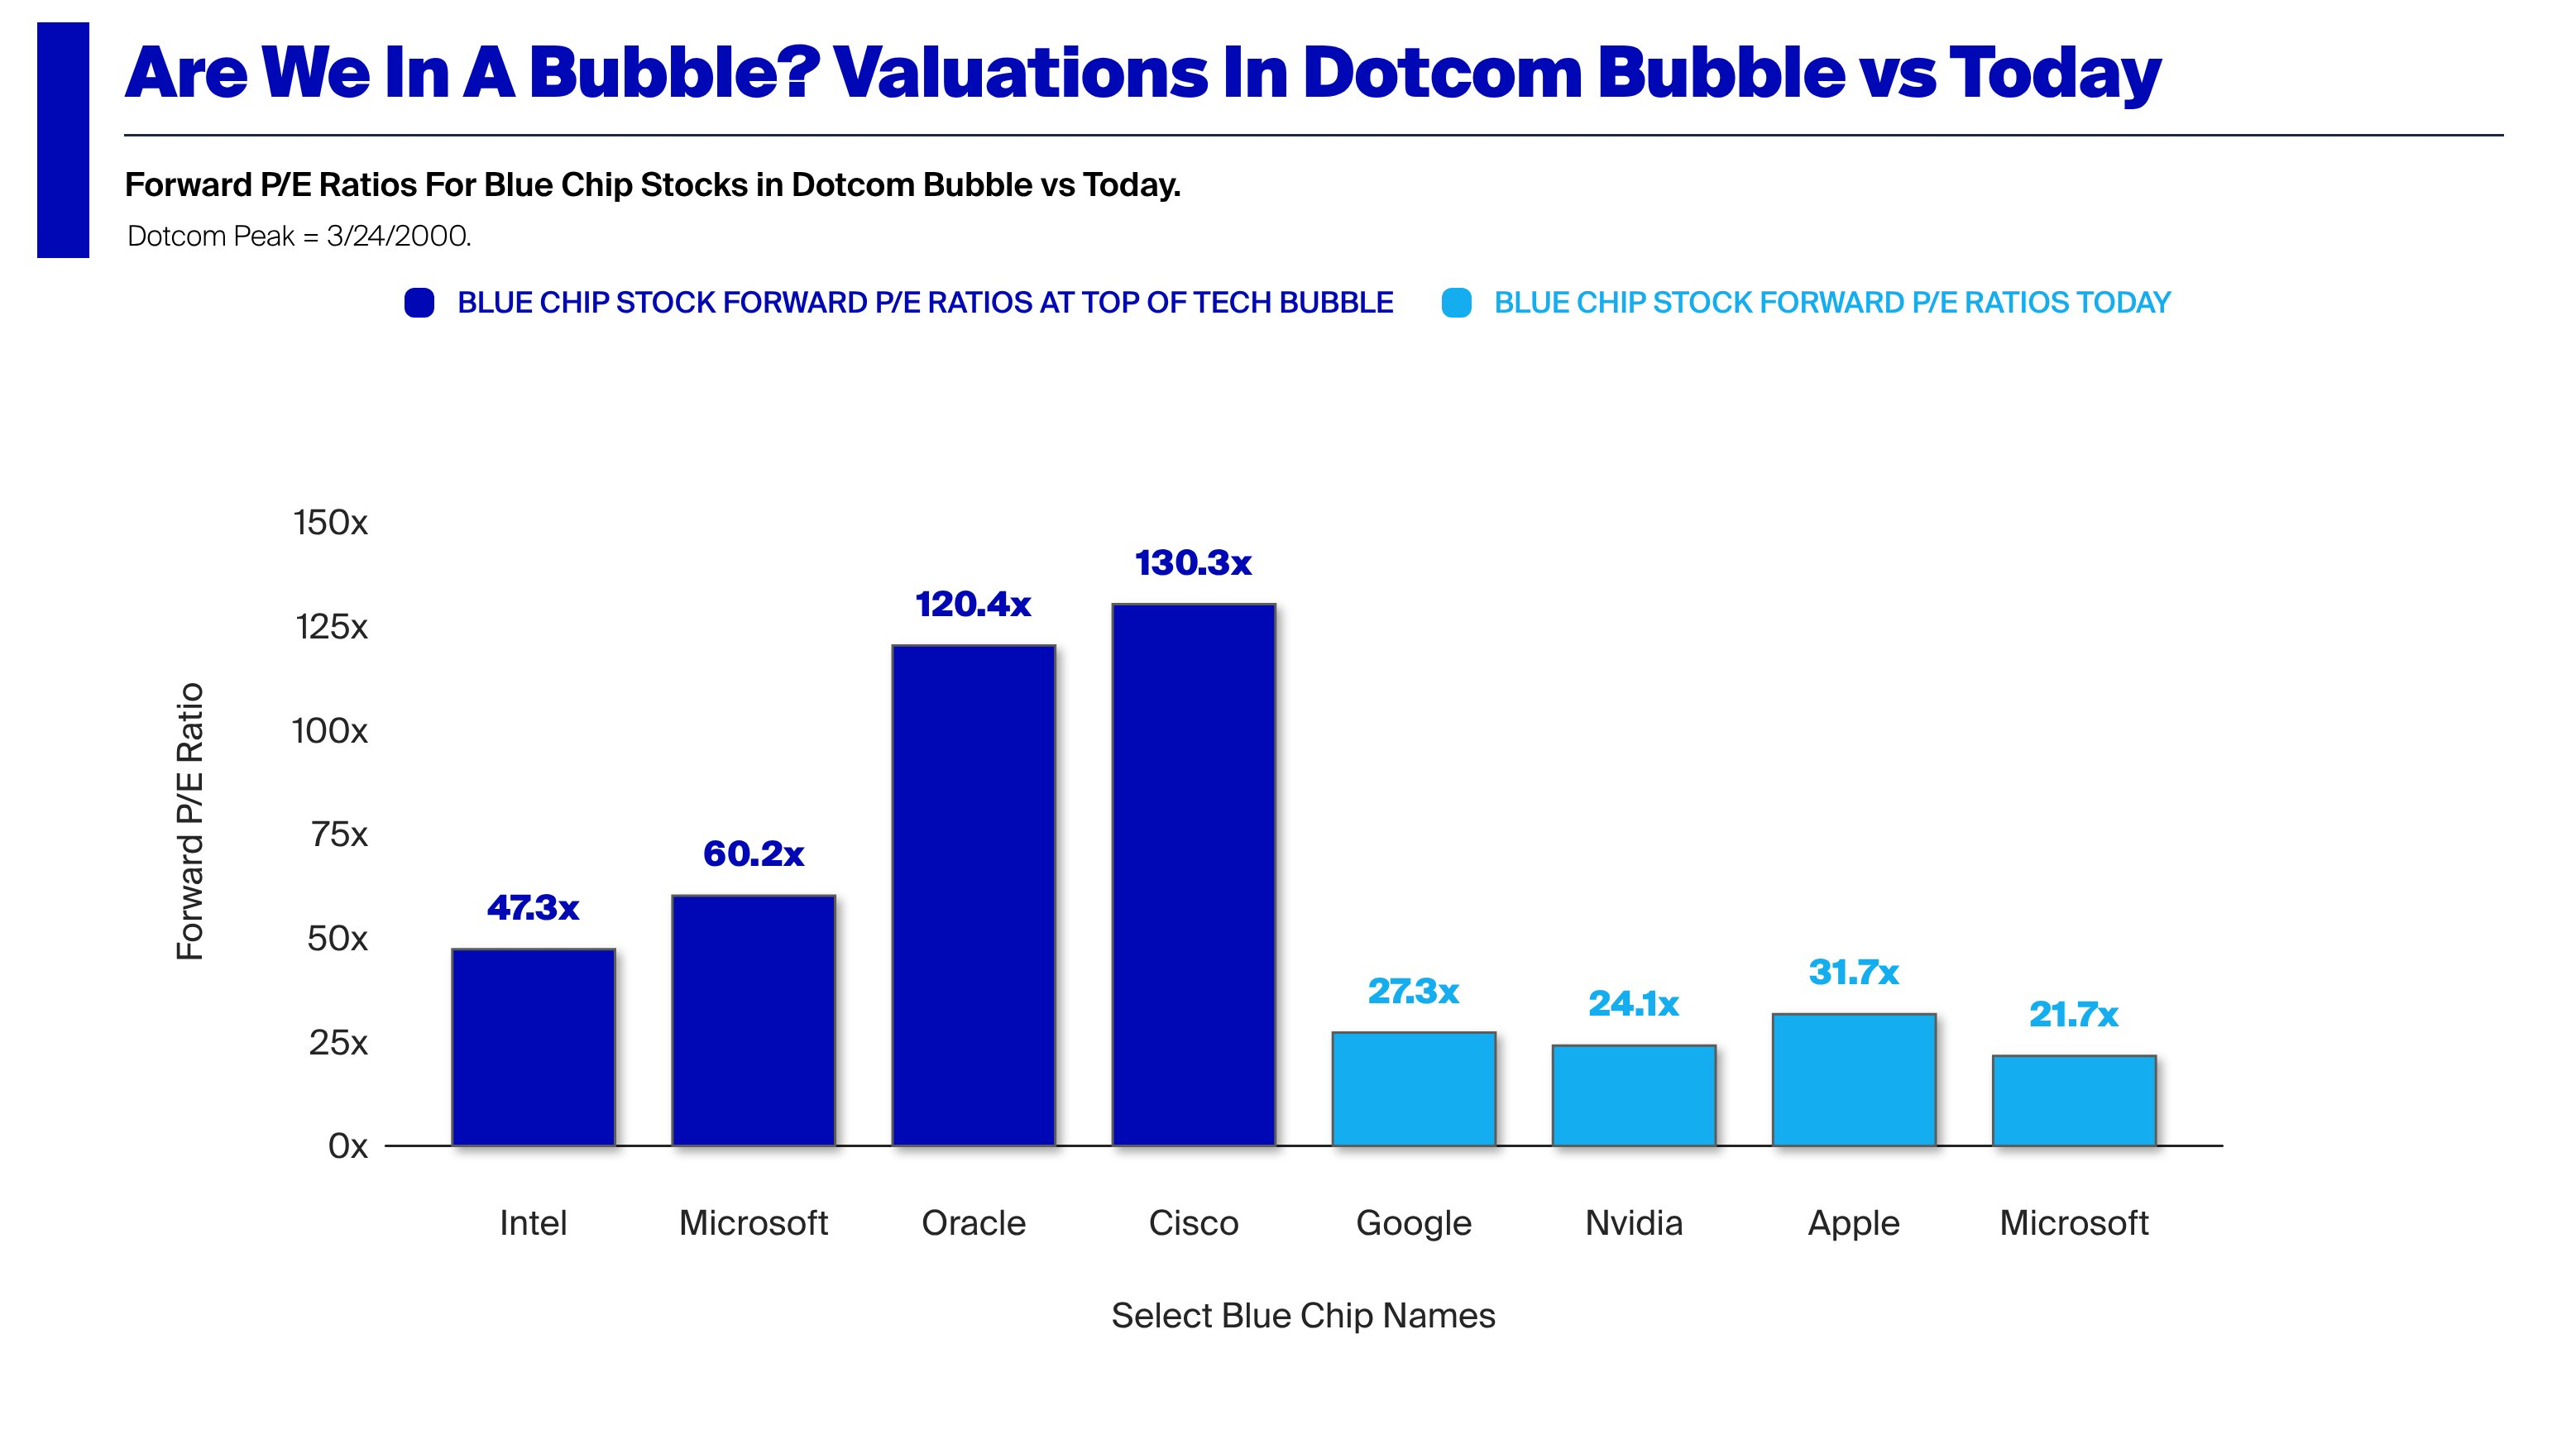
    This even as share prices and value concentration have risen even faster than in the Dot Com era. Seen from the P/E basis, it does not look like we are in a bubble. Earning growth is way up so the share prices are not outrageous on that basis. That is contrary to 1999 when P/E ratios in the hundreds were considered normal. Expectations of an internet fueled boom were speculative. Expectation of an AI earnings boom seem well founded.

    But these companies could still be over-valued. The P/E ratio is not the full picture. It is in fact a simplifying shortcut which ignores significant pockets and omissions of value.

    For this analysis I'll use a sample including some of the largest market caps in the world with two exceptions. The exceptions are Lilly (LLY), Berkshire Hathaway (BRK-B) which are on the list but not in the top 10 (though in top 15) and Saudi Aramco and Broadcom which are in the top 10 but not on the list[1].

    CompanyMarket Cap
    NVDA$5,709,746,405,376
    AAPL$4,379,916,369,920
    GOOG$4,811,891,146,752
    MSFT$3,041,424,048,128
    AMZN$2,874,514,866,176
    TSM$2,166,463,135,744
    TSLA$1,664,912,326,656
    META$1,569,837,154,304
    BRK-B$1,044,046,610,432
    LLY$897,716,060,160

    The following diagram shows the P/E ratios of the sample relative to the top 100 US market caps[2]. Note that, with one exception, the companies are not in the dark red zone with above P/E of 60. The exception is, of course, Tesla, which, at P/E of 400+ is 14x the average multiple.
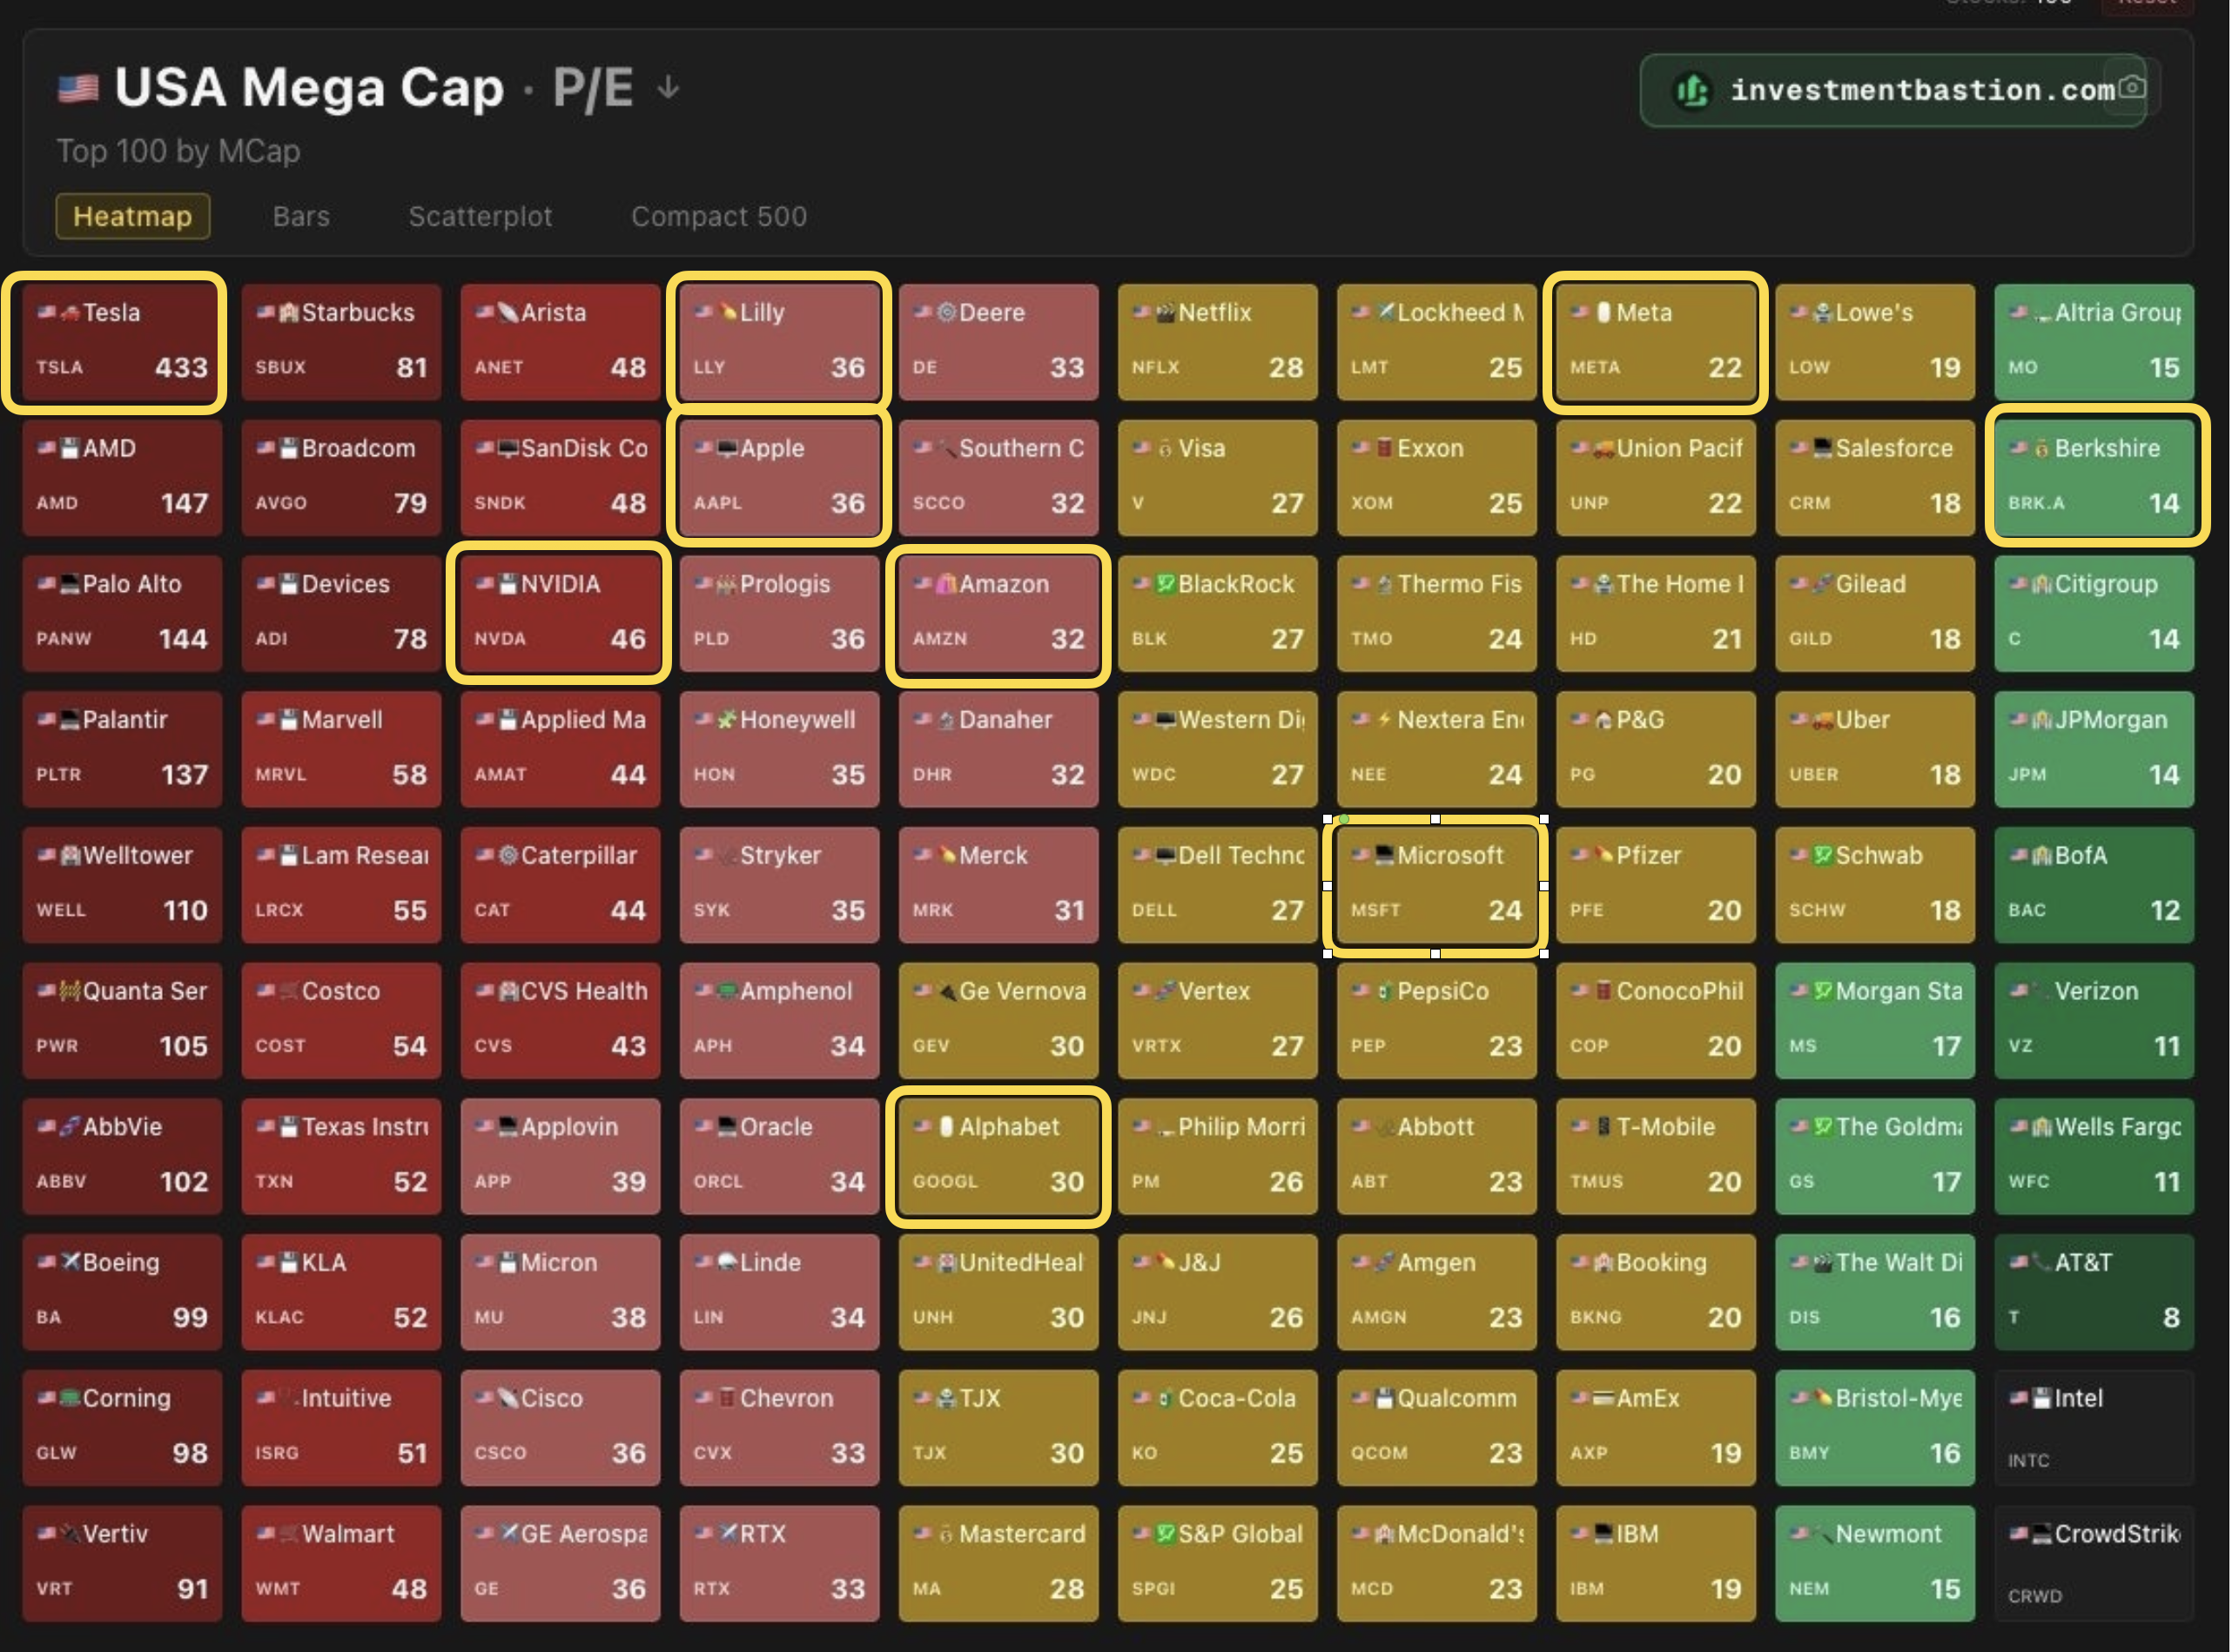
    Moreover, compared with the S&P 500, these P/E ratios are in-line with the median. The following graph shows the sample set with P/E ratio vs. Market Cap.
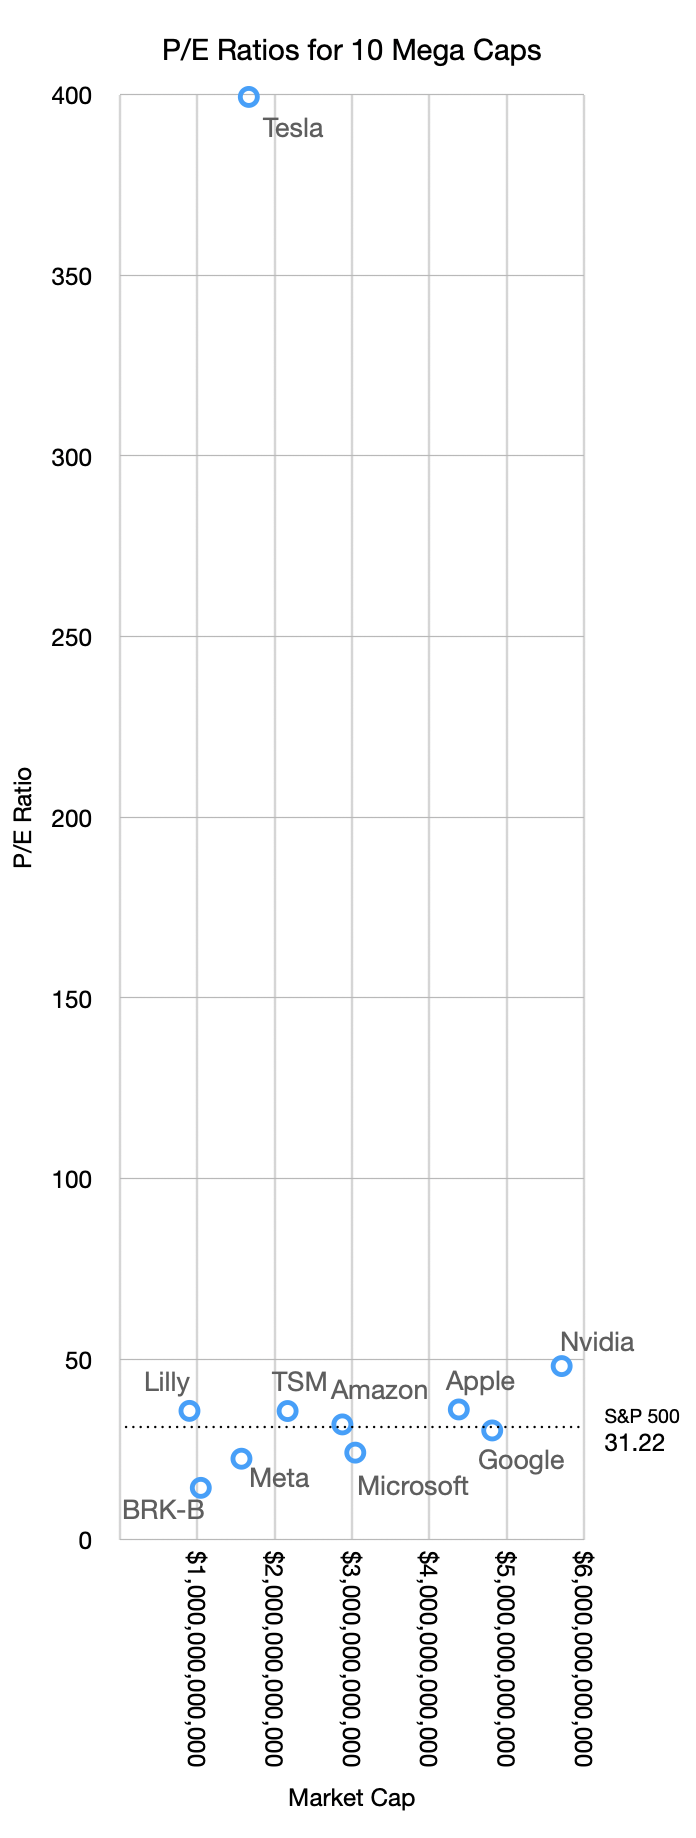
    Excluding the one anomaly the relationship seen is that higher market caps roughly correspond to higher P/Es. Nvidia has a market cap over $5.7 trillion with a P/E of 48 while Meta has a market cap of $1.5 trillion and a P/E of 22.5.

    Higher P/Es should also correspond to higher growth rates. The graph below shows the relationship between P/E and growth, both in the most recent quarter (MRQ) and trailing twelve months (TTM).
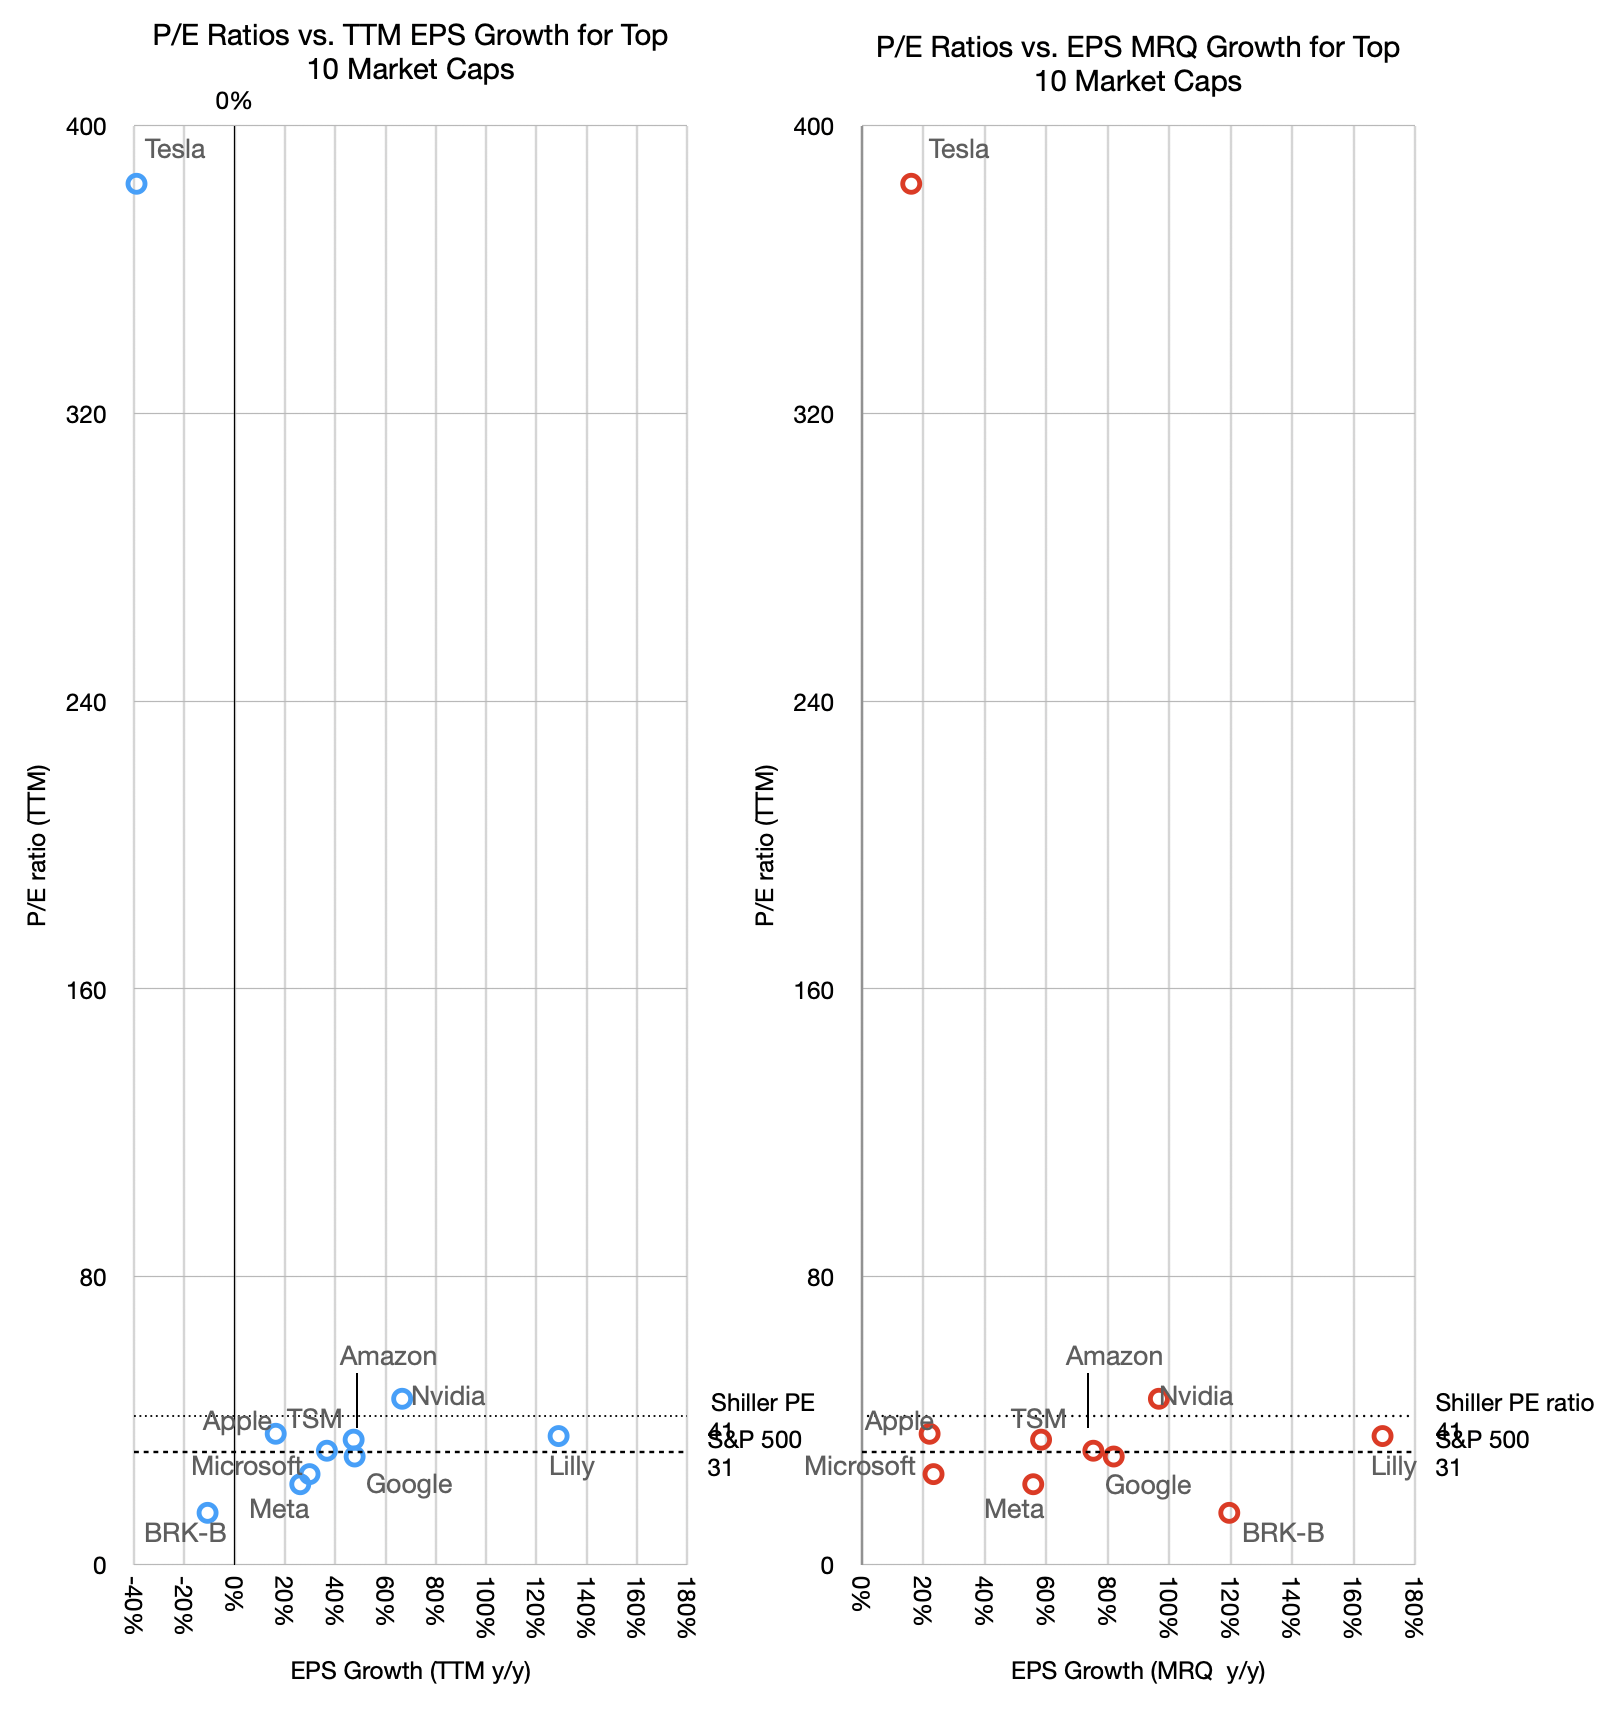
    There is a loose relationship between P/E and TTM growth but not with last quarter's growth. The one anomaly is even more prominent as it shows negative growth with exceptional valuation. Fundamentally however the relationship between P/E and growth is weak. Companies having widely divergent growth show similar P/E ratios. Alphabet for example has seen its P/E ratio in the 20s with growth in the 80s TTM and 50s MRQ.

    This might sound familiar. From 2008 to 2020 Apple was trading at a P/E ratio in the teens and low 20s while growing as fast as 80%. The logic was captured by my analogy of the goose that lays the golden eggs. Apple was able to create extraordinary products but the market considered such hits fleeting. It valued consistency over heroism. Getting on base vs. home runs. And so the P/E began to rise only once Services became more prominent. Regardless of how foreseeable this pattern was, it took a decade and is still ongoing for the pricing to catch up.

    But the situation with AI companies (that is, all the big tech companies but Apple) is that their earnings today are somewhat an illusion.

    An old maxim that says "earnings are an opinion while cash flow is a fact.[3]"

    This is because Net income can be manipulated by accounting abstractions, whereas cash flow is based on bank transactions.

    To wit: Net income (earnings) is calculated using accrual accounting, which relies heavily on judgment calls rather than bank balances. Companies recognize revenues the moment a contract is signed, even if the cash won't be collected for months. Or they can dial in a delay as they desire.

    Because of varying accounting policies, two identical companies with the exact same physical business can report vastly different earnings figures.

    Cash flow is objective and simply tracks the actual movement of money in and out of the business. Real dollars either enter the bank account or they don't. A company can look highly profitable on an income statement but still go bankrupt if its cash is trapped in unpaid invoices or unsold inventory.

    Finally, cash flow can be strongly negative while earnings are strongly positive. This is because investment in capital equipment does not appear in the income statement.

    Therefore true economic value is determined by the cash a company can actually distribute or reinvest rather than how it declares profitability based on accounting abstractions.

    AI companies are not necessarily hiding behind suspect earnings but their extraordinary capital expenditures are draining their cash and thus what investors have access to.

    Earnings seem to be soaring so the ratio P/E suggests a modest valuation. This is based on opinion or at least incompleteness.

    We should look at a better indicator. It's the EV/FCF ratio. We will look at this next.

    1. The top 10 ranking can change rapidly and it makes analysis difficult over longer time periods. The inclusion of LLY and BRK-B allow for visibility outside of the tech sector and they were in the list mid 2025. Saudi Aramco is in a completely different environment influenced by non-economic factors.
    2. TSMC is absent from the table as it is US only companies. It is notable perhaps that of the top 15, three are not US companies (TSMC, Samsung and Saudi Aramco). Furthermore the top Chinese company, Tencent is 25th, valued at $532 billion and the top European company is ASML at 21st and $610 billion.
    3. Attributed to economist Alfred Rappaport.

  2. Asymco Bulletin 008 - Apr 12, 2026

    Bulletin

    Asymco Bulletin is a digest of all the work we have published for the week ending Apr 12, 2026.

    Research

    Can a company outlive its founder? Microsoft at 51, Apple at 50 and The Auteur Theory of Business

    Much more was said of Jobs’ departure signaling the end of Apple than of Gates’ departure signaling the end of Microsoft. And much more was celebrated of Apple 50 than Microsoft 50. Why is that?

    If you were to structure an experiment to determine the influence of processes and personalities on the outcomes of a company, you would be hard pressed to find a better pair to study. Apple and Microsoft were founded almost at the same time, due to the same enabling technologies (microprocessors) and led by two iconoclastic founders of the same age acting out of similar impulses.

    The divergences were that one concentrated on software while the other on hardware. But rather than pairing up in a match made in heaven, both tried to outmaneuver the other in order to avoid dependency. →

    Valuation in a time of AI

    Valuation in a time of AI

    Cash flow is a fact, earnings are an opinion and share price is a dream.

    A company’s total worth is the number of outstanding shares multiplied by their value. This product is called the market capitalization or Market Cap.

    That’s a simplification. If you want to be more accurate, you should take the Market Cap and net out cash and debt–these are not part of the future flows of cash that can benefit shareholders.

    More precisely, there is another measure called the Enterprise Value (EV) which is the total price tag of a company, representing what it would cost to buy the entire business and pay off its debts. EV = Market Cap + Total Debt + Preferred Stock + Minority Interest – Cash and Cash Equivalents.

    This is the precise and complete measure of the firm’s value but we use the shortcut of Market Cap since In most cases the Preferred stock and minority interest are negligible and if cash equals debt then the result is EV =~ Market Cap. it’s easier to calculate anyways as the shares outstanding and share price are easily available. Not so for EV. →

    What are the odds of Apple surviving?

    What are the odds of Apple surviving?

    A tale of two Apples

    What are the odds of it surviving another year, ten years, 50 years?

    Companies don’t last long. A recent study that analyzed thousands of European firms yielded a corporate life expectancy figure of 12.5 years. The Boston Consulting Group analyzed the entry, growth, and exit dates of 35,000 publicly listed companies and determined that one in ten of all public companies fail each year, a fourfold increase since 1965.

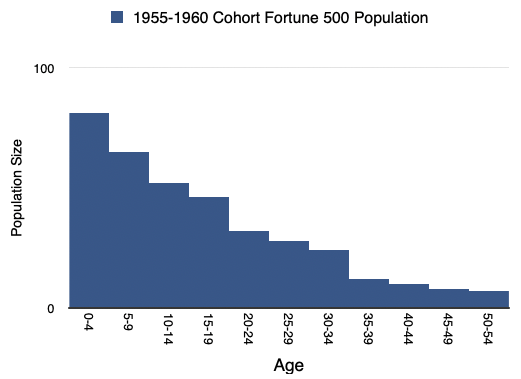
    As I illustrated many years ago in a talk titled “The Unfortunate 500” most companies die not long after adolescence. Of the Fortune 500 1955-1960 cohort, the 81 companies which joined the index in those years, only 7 remain there today. One third of the corporations on the 1970 Fortune 500 list were no longer in existence thirteen years later. Broadly speaking, as a population, large companies that make it to the Fortune 500 listing have life expectancy within that group of 17 years. →

    iPad at 16

    Redundant or Post-PC?

    Today marks the 16th anniversary of when Apple released the first-generation iPad.

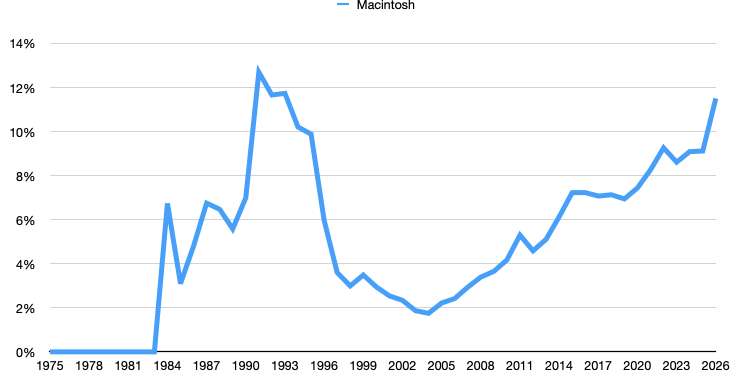
    To many, including Alan Kay, the tablet form factor makes much more sense than the PC form factor. It’s more approachable, more intuitive and certainly smaller and more portable. As the graph shows, quickly after launch, the iPad overtook sales of the Mac.

    The problem arose that whereas the iPad was smaller, the iPhone what smaller still–so much so that users would take phones with them everywhere. At the same time, the “PC” shrank as well so that many notebook (laptop) computers became thin, light and had day-long battery life. The Mac at least became no bigger a burden to carry than an iPad.

    So the iPad was stuck in the middle between an iPhone, that did more and more, and a Mac that was very portable. At this point many said that the iPad was a dead end form factor. →

    AI as Infrastructure

    ON September 3, 1821, 37 years after James Watt invented the concept of horsepower and started charging £5/horsepower/year for the use of his steam engine, the first demonstration of the production of a mechanical force by the interaction of an electric current and a magnetic field was given by Michael Faraday in the basement of the Royal Institution in London.

    1820 is, in many chronicles, noted as beginning of the industrial revolution. It marked the end of 50 years of war, whose conclusion unleashed pent-up demand. That demand was served by relatively free trade, guaranteed by British naval power, coupled with property rights and financial instruments which allowed inventions of the previous century to finally be harnessed for commercial gain. The steam engine is the canonical invention of the era and its implementation as a source of power for factories, shipping, rail and machinery is legend.

    Not usually noted as coincidental to this period is the electric motor. Yet not long after Faraday’s 1821 demonstration in London, the first DC electric motor capable of turning machinery was invented by William Sturgeon. In 1832 he built on Faraday’s electromagnet by incorporating a commutator which oscillated the direction of current to ensure continuous rotation.


    Nota Bene.

    The Motley Fool asks: Where Will Apple Stock Be in 5 Years? → Not reading this article is probably a wise decision. Shares could perform in line with the S&P 500’s long-term average Investors can follow a straightforward exercise to try and figure out where Apple’s stock price will be in late March 2031. It’s important to consider both the valuation and profit gains. We just released a […] →

    Apple’s services continue to see increased engagement, spending

    Apple’s services continue to see increased engagement, spending → The survey of 3,500 smartphone users reveals a significant rise in average monthly spend on Apple services to $13, driven by increased adoption of premium offerings like AppleCare/One, Apple TV+, and Apple Music, with notable shifts towards AI features despite muted upgrade intent, though potential US bias may affect overall accuracy. →

    KeyBanc maintains a lack of clarity of thought → The analyst's note on Apple is overly cryptic and lacks clarity, making it difficult to assess its validity or relevance. →

    iPhone sales continue to surge into February – Bernstein → February saw robust iPhone sales driven by the iPhone 17 line, with global unit sales up 26% and ASP climbing 6.9%, yet January-February revenue estimates oddly lag behind projections, sparking confusion. →

    Morgan Stanley has a stark message for investors in Apple → Morgan Stanley's survey indicates strong potential for Apple stock, highlighting record iPhone upgrade intentions, especially in China, improved switching rates, and significant interest in a future foldable iPhone. These factors support robust FY26 shipment forecasts and suggest a possible revenue boost from new products. Despite some concerns about declining willingness to pay for AI features, Morgan Stanley maintains an optimistic outlook with a $315 price target. The article criticizes TheStreet's editorial approach for misrepresenting the positive survey findings as negative news about Apple. →

    Mac mini and Mac Studio orders booming → Apple's Mac sales are surging due to the M5 chips' enhanced AI capabilities, outpacing other platforms and driving demand despite current shipping delays. →

    Gartner adds their Mac Q1 estimate to the pile

    Gartner adds their Mac Q1 estimate to the pile → In Q1 2026, Apple's Mac sales surged impressively by 10.7% to 12.7% year-over-year, driven by the MacBook Neo's appeal, securing a 10.6% global market share and maintaining fourth place among PC vendors, amidst a 4% rise in overall PC shipments. →


    Office Hours

    Asymco Office Hours Live Q&A with Horace Dediu: April 8, 2026

    Asymco Office Hours Live Q&A with Horace Dediu & Gene Munster took place on April 8, 2026 → Topic dicsussed: Apple Topics discussed: 

    • Geopolitics: China concentration; Taiwan tail risk
    • Financials: Solid near-term growth
    • AI: Critical narrative shift; not yet proven
    • Growth Strategy: User expansion
    • Business Model Evolution
      hardware → services → Personal AI
    • Moat: Privacy + integration; trust;

    Consider subscribing to Asymco One gives you full access to our research, analysis, and commentary. Subscribe with code BULLETIN for a discount.

    Feedback: Have questions or comments? Reach out to us at contact@asymco.com. We’d love to hear from you.

  3. Valuation in a time of AI

    Research · 1 comment

    Cash flow is a fact, earnings are an opinion and share price is a dream.

    A company's total worth is the number of outstanding shares multiplied by their value. This product is called the market capitalization or Market Cap.

    That's a simplification. If you want to be more accurate, you should take the Market Cap and net out cash and debt--these are not part of the future flows of cash that can benefit shareholders.

    More precisely, there is another measure called the Enterprise Value (EV) which is the total price tag of a company, representing what it would cost to buy the entire business and pay off its debts. EV = Market Cap + Total Debt + Preferred Stock + Minority Interest - Cash and Cash Equivalents.

    This is the precise and complete measure of the firm's value but we use the shortcut of Market Cap since In most cases the Preferred stock and minority interest are negligible and if cash equals debt then the result is EV =~ Market Cap. it's easier to calculate anyways as the shares outstanding and share price are easily available. Not so for EV.

    To get a sense of how much you're paying for the company it makes sense to divide the Market Cap by the company's Earnings so you get an idea of how many years it will take to get back your investment. When dividing both Market Cap and Earnings by the number of shares it becomes the famous P/E ratio or Price per share / Earnings per share.

    But if you want to be fully precise, instead of using Market Cap you should use Enterprise Value. In that case the denominator should be Free Cash Flow or FCF[1]. The ratio becomes EV/FCF. Free Cash Flow is a better measure than earnings because it takes into consideration depreciation, change in working capital and capital expenditures. It measures the actual cash a company generates after paying for its operating and capital expenditures.

    EV/FCF takes into consideration unusual situations such as huge amounts of cash or debt or capital expenditures which removes shareholder access to what the company "earns" on paper. This why the adage of "earnings are an opinion but cash flow is a fact" exists.

    I used EV/FCF years ago to value Apple because at a time when it held huge amounts of cash. This was before it began aggressively reducing its cash through its capital return program. The P/E ratio at the time was very low but excluding the cash, it was even lower. It was a huge red flag indicating that the company was being priced for liquidation, or as some analyst put it, priced like a steel mill going out of business. If at that time you did not believe that its demise was imminent you would have surely been richly rewarded.

    Today the anomaly that throws the P/E off is not Cash but CapEx. And it's not for Apple but for the other mega caps or AI "hyper scalers". Without worrying who is or isn't in the "Magnificent 7" I compiled the largest 10 market capitalization companies and looked at their P/E and EV/FCF ratios. At time of writing:

    CompanyMarket CapP/E RatioEV/FCF
    NVDA$4,014,456,963,07233.644.4
    AAPL$3,624,949,514,24031.330.3
    GOOG$3,304,174,911,48825.244.3
    MSFT$2,667,926,257,66422.535.0
    AMZN$2,157,182,320,64028.0297.0
    TSM$1,641,528,688,64030.650.0
    TSLA$1,333,163,982,848332.0225.0
    META$1,356,802,949,12022.832.6
    BRK-B$1,023,780,323,32815.344.1
    LLY$793,550,454,78438.6142.3

    As recently as six months ago, there was a lot of talk about an AI bubble. Back then I looked at the data then and by looking at the P/E ratios convinced myself that the valuations were not "bubble" level. They were in the mid-thirties. These were not historical high especially when considering the growth these companies were experiencing (over 30%). Since then prices have come down significantly.

    This is as the CapEx elephant in the room has been making itself known and there is renewed alarm at the scale of capital spending. This is reflected in the EV/FCF number but not in the P/E number.

    The table above shows how much more elevated the EV/FCF ratio is relative to P/E for many of the companies. This "truer" measure of what you are paying as a share buyer is now reflecting in reduced share price and hence reduced P/E.

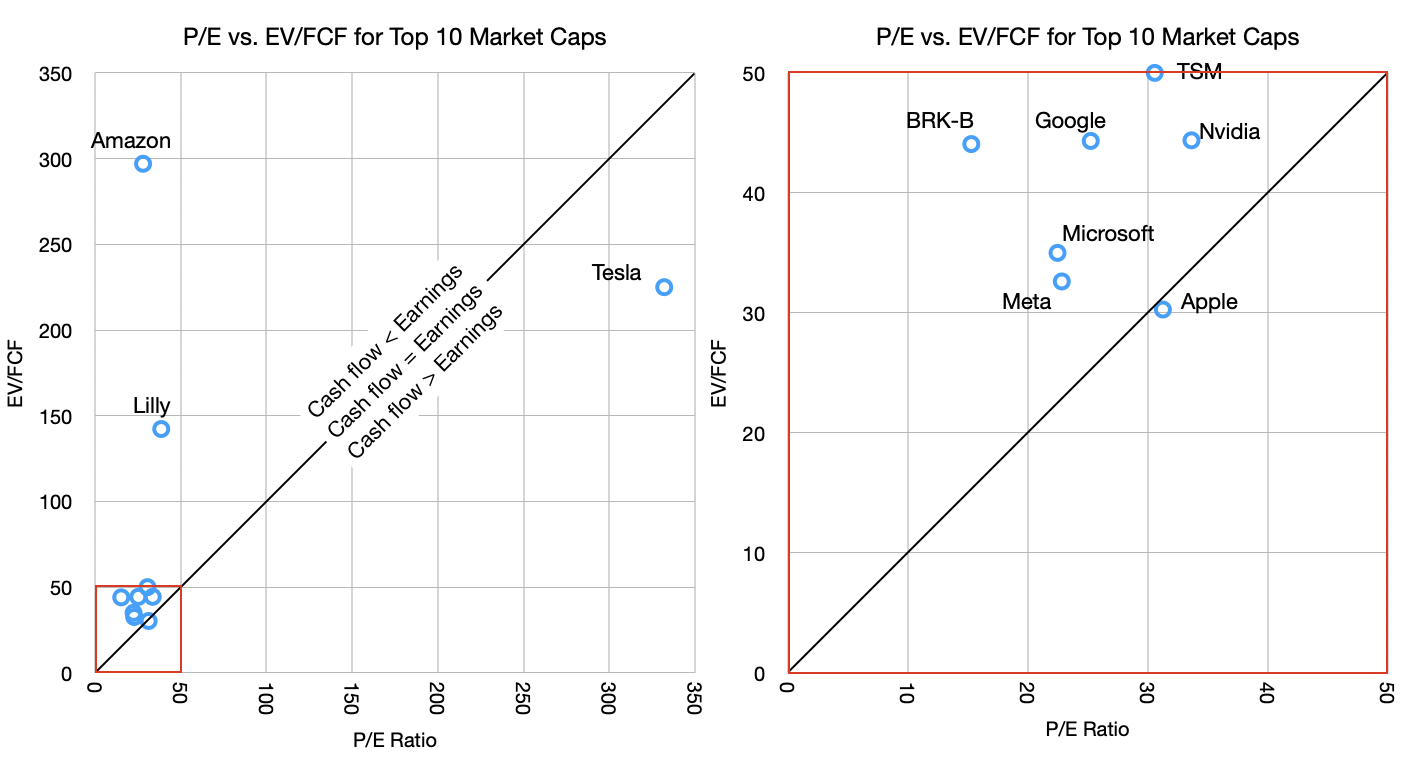
    Of course, this is not true for Apple. Apple's P/E ratio and EV/FCF are nearly identical. To see this more clearly I put together these graphs.

    Valuation in a time of AI

    The graph shows the P/E vs. EV/FCF for the companies in the table. The graphs are the same data but the one on the right is zoomed in on the lower left corner (note the red squares).

    The reason for the zoom is that there are three outliers. Tesla, Amazon and Lilly. Tesla has absurd valuation on both P/E (300 to 400 range in last 6 months) and EV/FCF while Amazon has an outrageous EV/FCF value due to abnormal capital spending. Basically, Tesla has negligible earnings (and negative growth) while holding astronomical share price and Amazon is spending far above its median on CapEx. Amazon's 10-year EV/FCF is much lower, at approximately 55.

    But let's ignore the outliers and concentrate on the other seven in the cluster. These are below 50 P/E and 50 EV/FCF thresholds.

    Note that I drew a diagonal line representing the equation of P/E = EV/FCF. This should, under normal circumstances, hold for most stocks. Just like Market Cap should roughly equal Enterprise Value so Earnings should equal Free Cash Flow.

    Most companies should not stray too far from this line. But what we are seeing, with the notable exception of Apple, is that most tech companies have cash flow far below earnings. This is again due to the CapEx elephant.

    The argument goes that this is a temporary situation with that capital being wisely deployed for returns from AI. Presumably, these companies will swing to the other side of the line, where cash flows will exceed earnings, compensating for the capex that was denied to the shareholders.

    This is where the old adage comes into play: Earnings are an opinion but cash flow is a fact. I added to that "and share price is a dream". Take the free cash flow and multiply it by a "dream" and you get the price the market sets. This dream is the multiple.

    What makes the AI "bubble" interesting is how it's not fueled by debt[2] but by cash flow. Companies are turning over large portions (almost all and sometimes more) of their cash flows to investing in the dream of AI profits. All but one, of course.

    There is something obviously contrarian in Apple's strategy. Perhaps it's not Apple that is odd but rather there is groupthink on behalf of the others. The question of who's right will rest on whether it turns out that AI is going to commoditize quickly or perhaps never, whether AI turns out to be modular or integrated, whether AI exhibits disruptive or sustaining competitive responses, whether it's an infrastructure subject to regulatory corrosion or whether it will migrate to the edge and iterate freely, whether it's a new experience or simply better existing experiences, whether it creates new markets or just makes existing ones more efficient.

    These are not new questions. They have been applied to all software and hardware innovations of the last 40 years. We have a lot of history to inform us.

    Join me as we learn.

    1. To calculate FCF, look at the Income statement, start with earnings before interest and taxes (EBIT), add depreciation, subtract taxes and CapEx.
    2. There is some debt of course, but the scale is so immense and the risks so high that most lenders would not touch this type of investment.
  4. Rosenblatt Lifts Price Target on Apple by $1, Maintains Netural Rating

    Nota Bene · 3 comments

    From $267 to $268

    On March 5, TheFly reported that Barton Crockett of Rosenblatt Securities increased the price target on Apple Inc. from $267 to $268, maintaining the Neutral rating on the iPhone maker.

    Crockett remains positive on Apple following the company’s recent event, in which it launched its MacBook Neo, tapping into the lower end of the laptop market. Apart from that, a lower-end iPhone 17e also adds to the company’s lineup in the budget hardware category. The analyst also mentioned that Apple’s high-end products account for a modest percentage of build-to-order, which could lead to in-line performance with its March-quarter guidance.

    On January 30, Reuters reported that, according to the LSEG, Apple expects Q2 FY2026 revenue to increase by 13% to 16%, compared with analysts’ 10% growth rate. Despite strong performance, Crockett highlighted that Apple trades at a meaningful premium.

    A majority of 52 analysts out of 54 have rated AAPL a Buy, while only two analysts rate the stock as a Hold. The average price target of $302.5 highlights an upside of over 16%, while Rosenblatt’s price target implies a modest increase of almost 3% as of March 10.

    Source: Yahoo Finance

    NB: Apple expects revenue to increase by 13% to 16%, compared with analysts' 10%??

  5. The Car Bundle Paradox

    Research

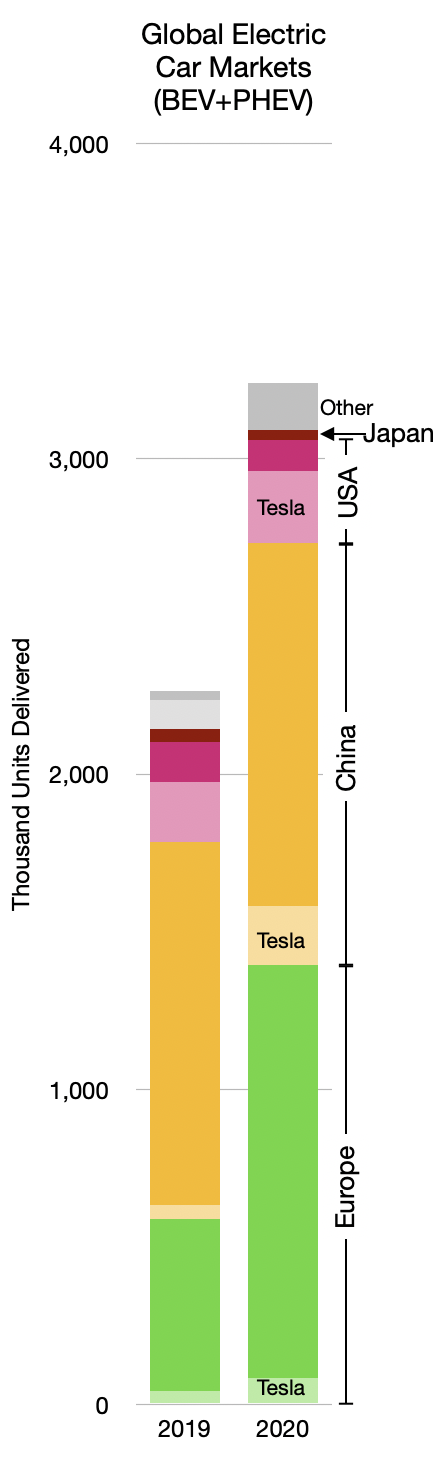
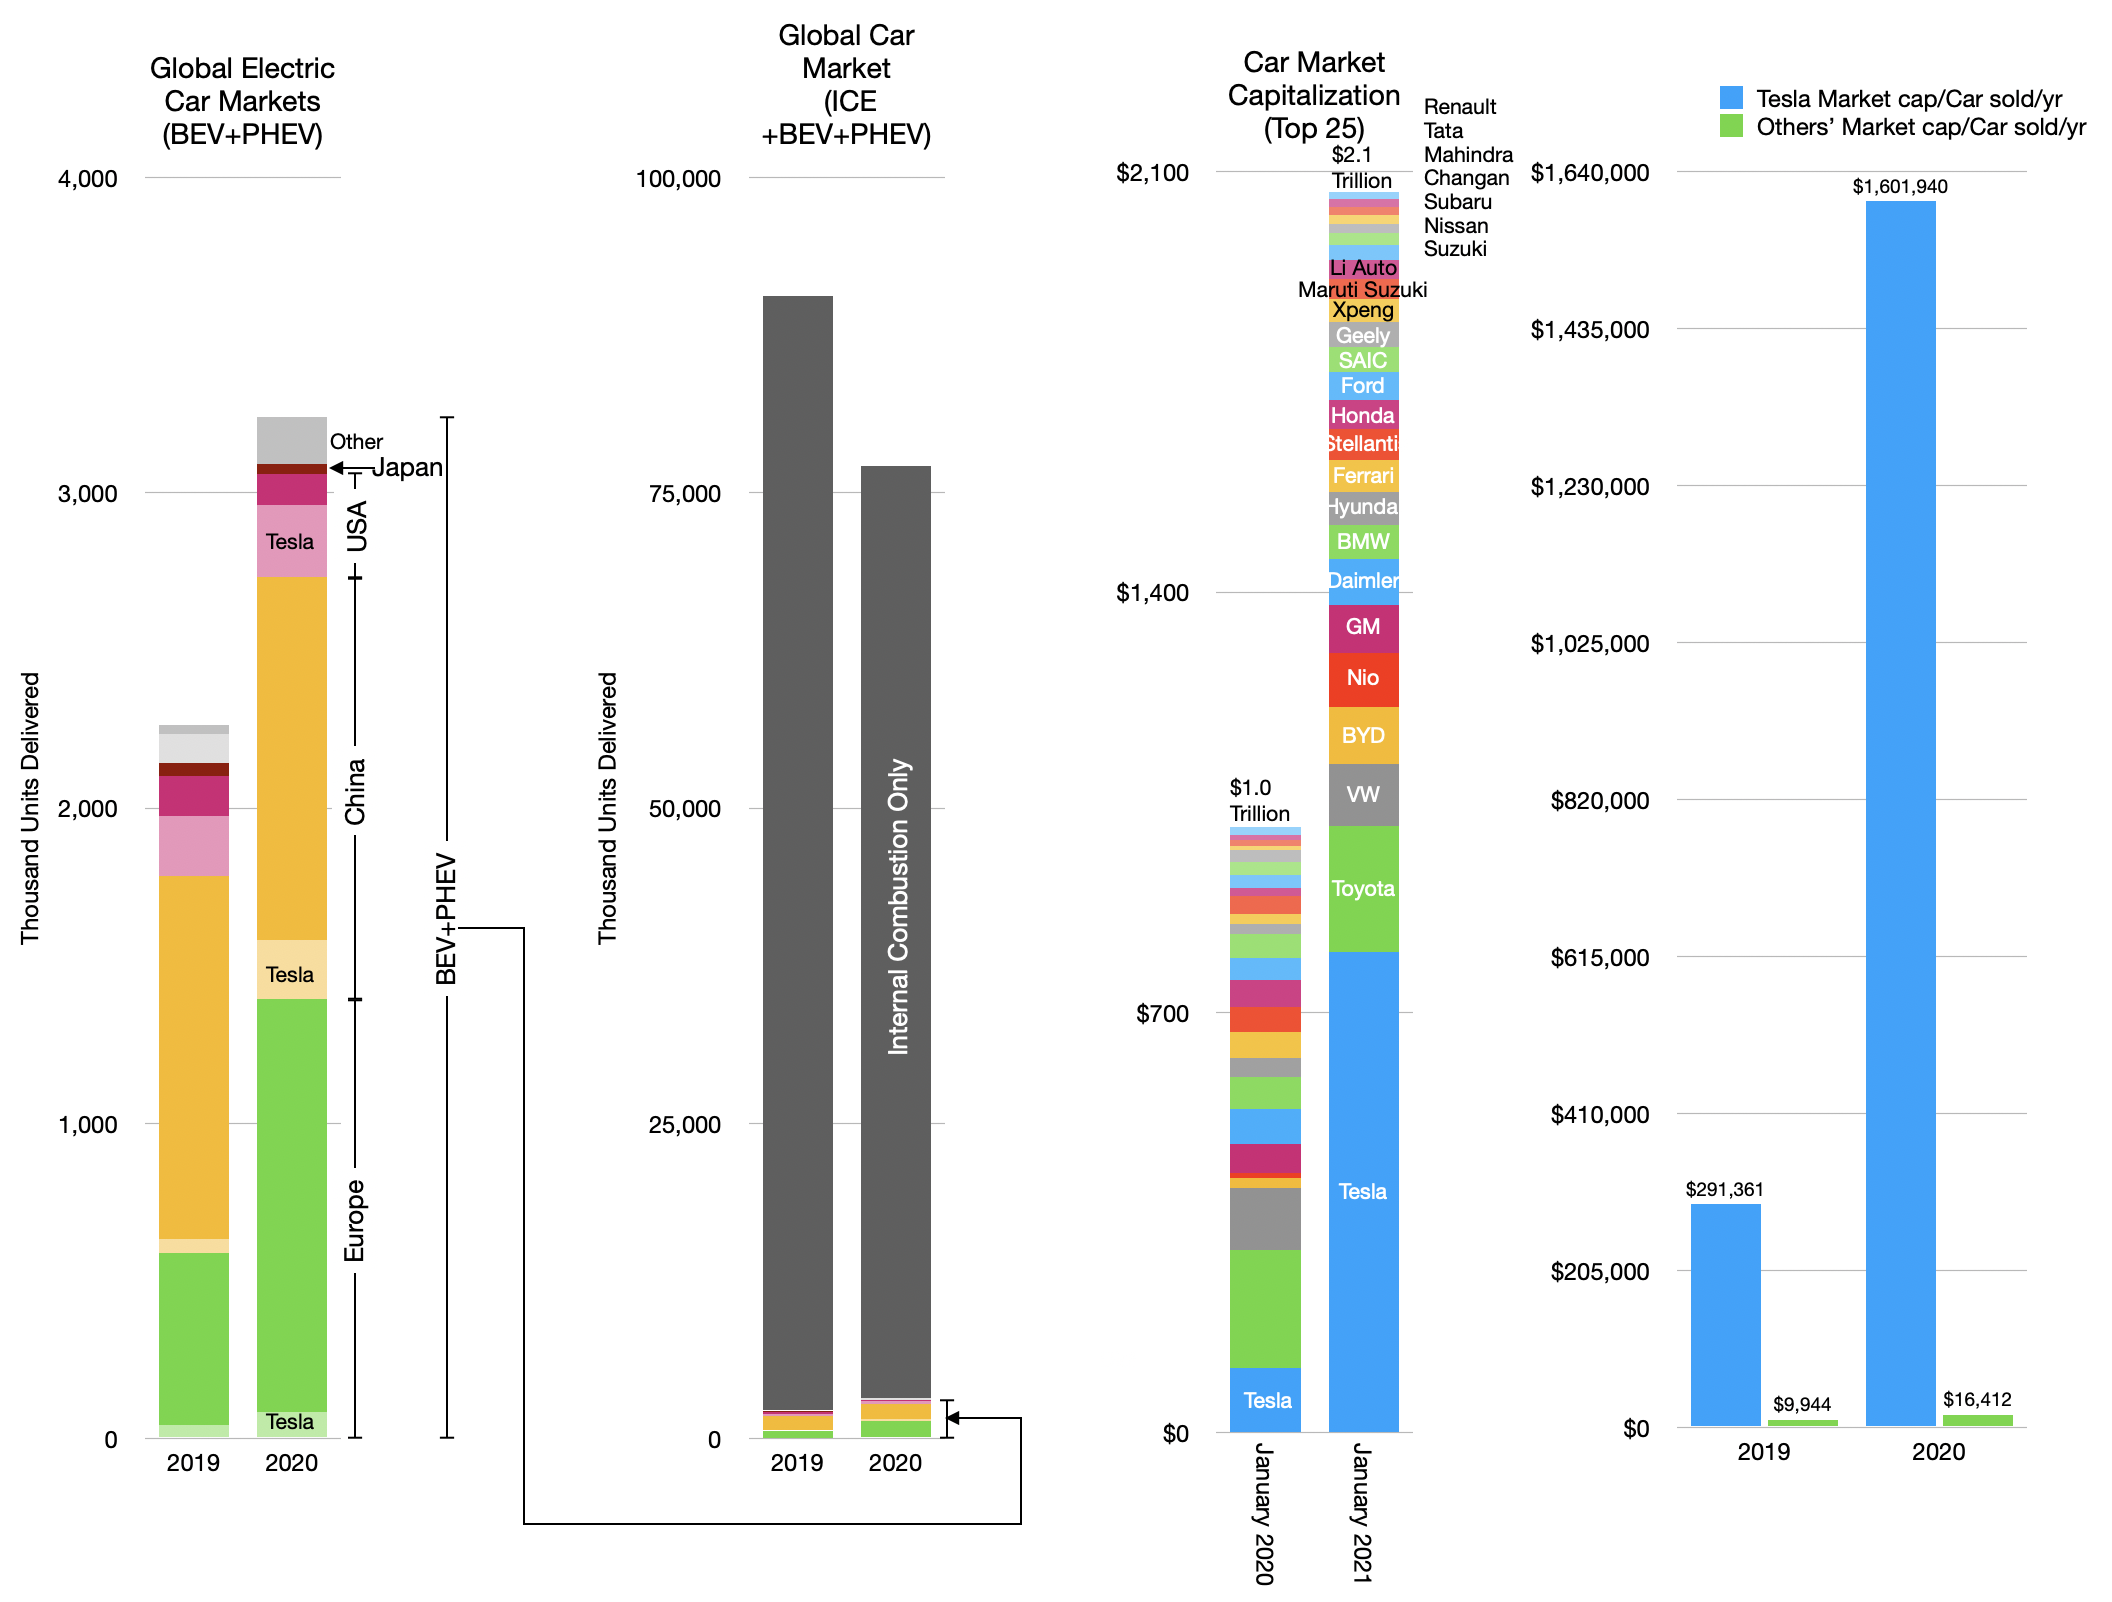
    The EV car market is booming. The graph below shows the global market for plug-in electric cars (plug-in hybrid (PHEV) and battery (BEV)--BEV are about 70% of total). The data is split between 2019 and 2020 with further distinction between the main regions.

    EV (PHEV+BEV) units sold 2019, 2020 by region.

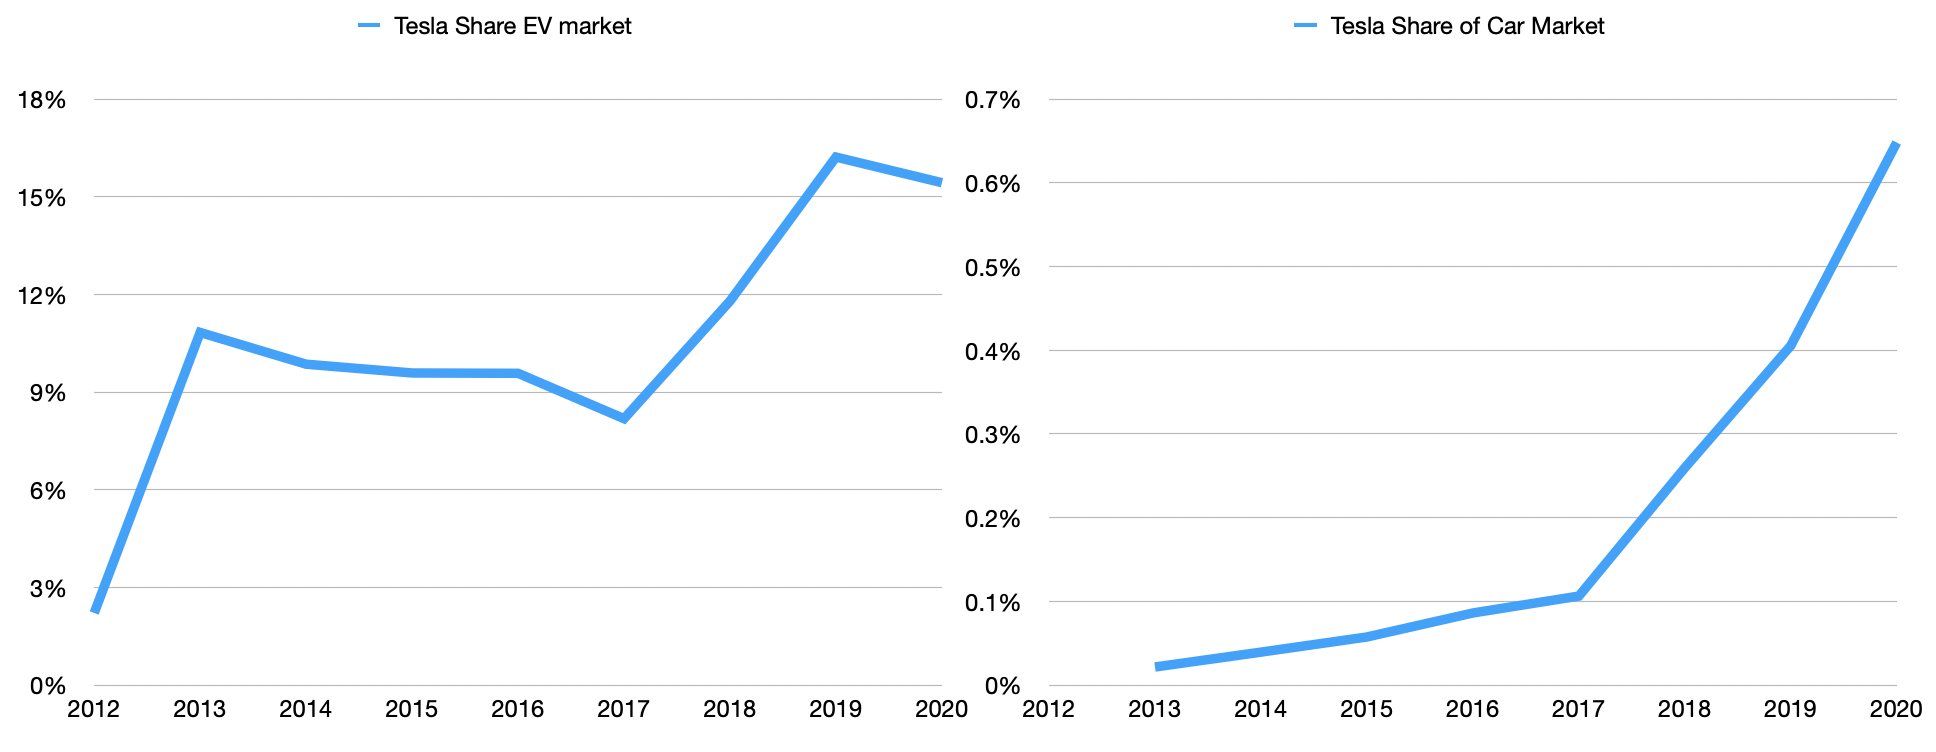
    There is an additional detail in the delineation of Tesla's shipments into these regional markets. To that point Tesla's market share of all EV cars has remained roughly equal from 2019 to 2020.

    Tesla share of EV car market and share of all cars.

    The big story of 2020 was the growth of European EV shipments. Those who follow the market know that new EU penalties for CO2 emissions have come into effect, causing much of this increase. Indeed, previous surges in the US and China have also been driven by new incentives and/or disincentives.

    As an aside, it should be noted the absence of Japan from this EV story. It's quite a shock, really. Japan is responsible for a large percent of all cars sold through its national heroes Toyota, Nissan, Honda, Mitsubishi (and Subaru, Suzuki, Mazda, Isuzu) and has been a driving force for innovation. The absence of a local market for EVs is a glaring indicator of lack of industrial policy. Unlike the US, Japan does not even have an oil industry, importing all its supply (while the US is a net exporter.) Yet the US produces and consumes far more EVs than Japan. This should give pause. One wonders what would happen if Japan followed Europe in providing incentives for EVs in the "JDM" market.

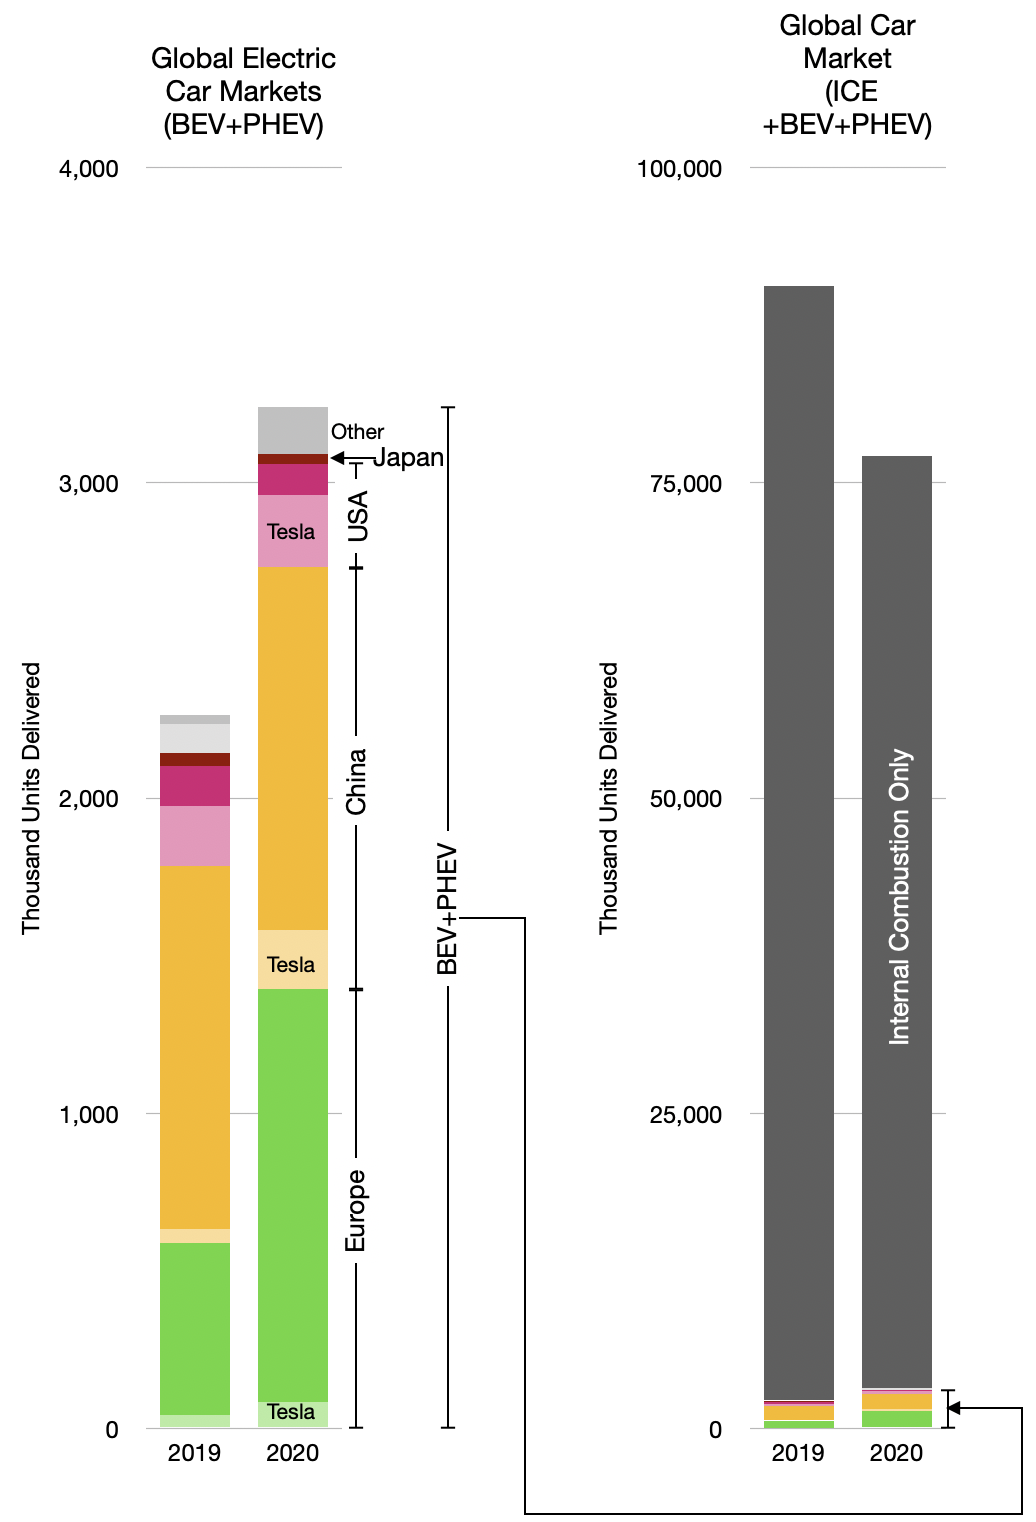
    Japan and "Other" countries aside, there was growth. But much remains to be done. The overall industry is far larger, as shown in the following graph.

    EV growth and global light vehicles 2019, 2020.

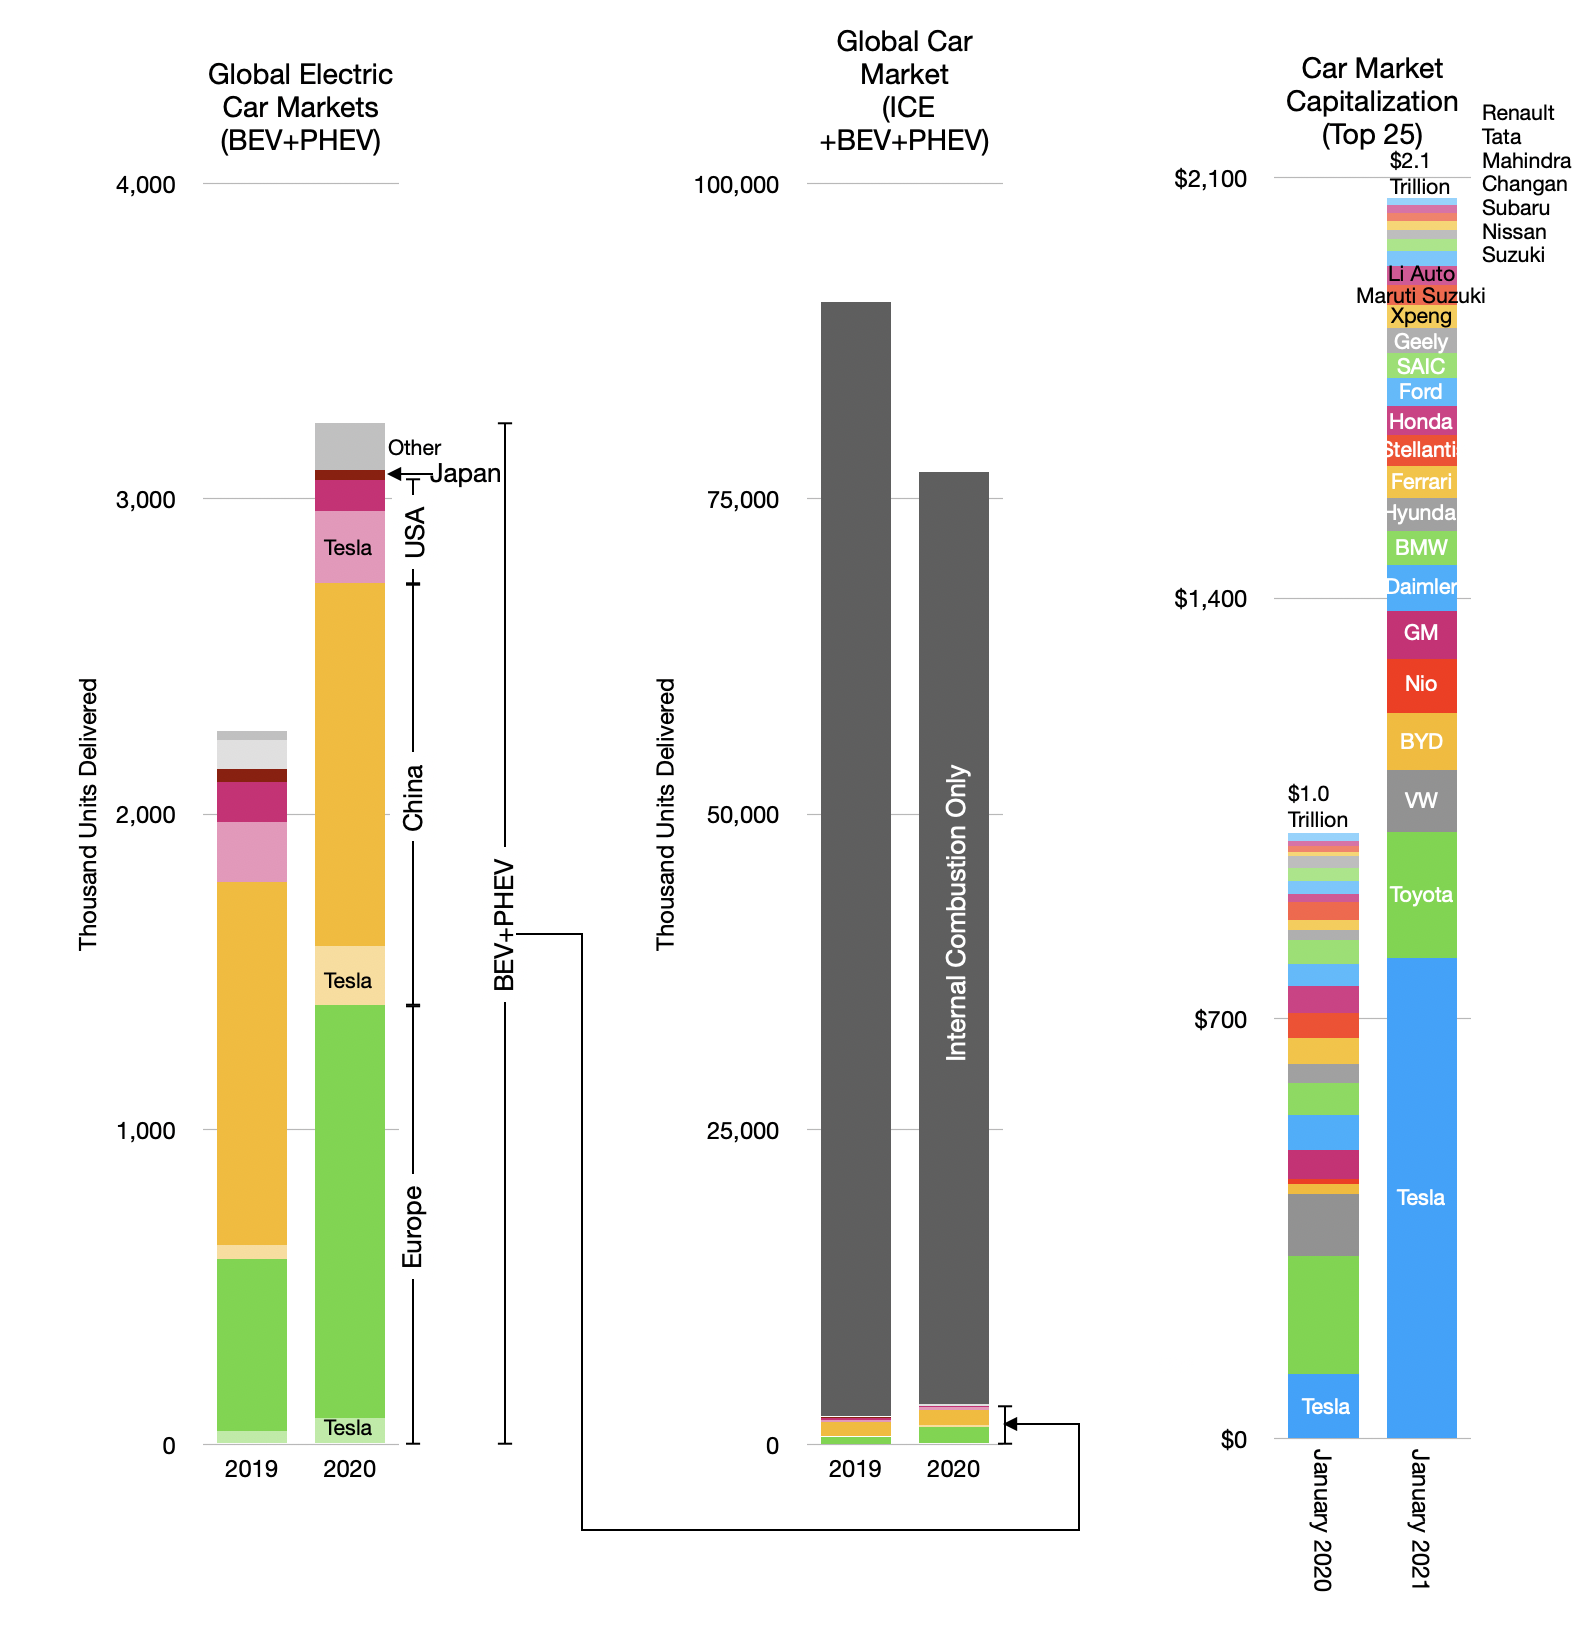
    Nevertheless, optimism abounds. With an increase in market capitalization of about 648%, Tesla is now the most valuable automaker in the world.

    Tesla, the champion EV maker has taken 17 years to reach 0.65% market share.

    Market capitalization of the auto industry (top 25 firms) and the market size (in units delivered).

    Actually, as the graph shows above, Tesla is now almost as valuable as the entire auto industry was a year earlier. But the rest of the industry did not collapse. The top 24 companies (i.e. apart from Tesla) increased their market capitalization from $901 billion to $1266 billion during 2020. That's a 40% increase during a year when sales fell by 15%. Quite an achievement.

    Overall the market capitalization of the top 25 automakers more than doubled from $1.0 to $2.1 trillion. This begs many questions, mainly, how would such profits ever be generated.

    To put a finer point on it, if we divide the market capitalization by units produced we get a figure of value that allows a historic perspective.

    A measure of valuation by units of production.

    Historically car companies were valued at $8,000/yr. 2019's value was about $10,000 which makes sense given some inflation. But the drop in volumes coupled to increase in valuation brought the ex-Tesla cap/unit to an eye-watering $16,400, a 64% increase in one year.

    Tesla's valuation is on a different level. It went from $291,361 to over $1.6 million/car sold. Roughly this is 100x rest of industry.

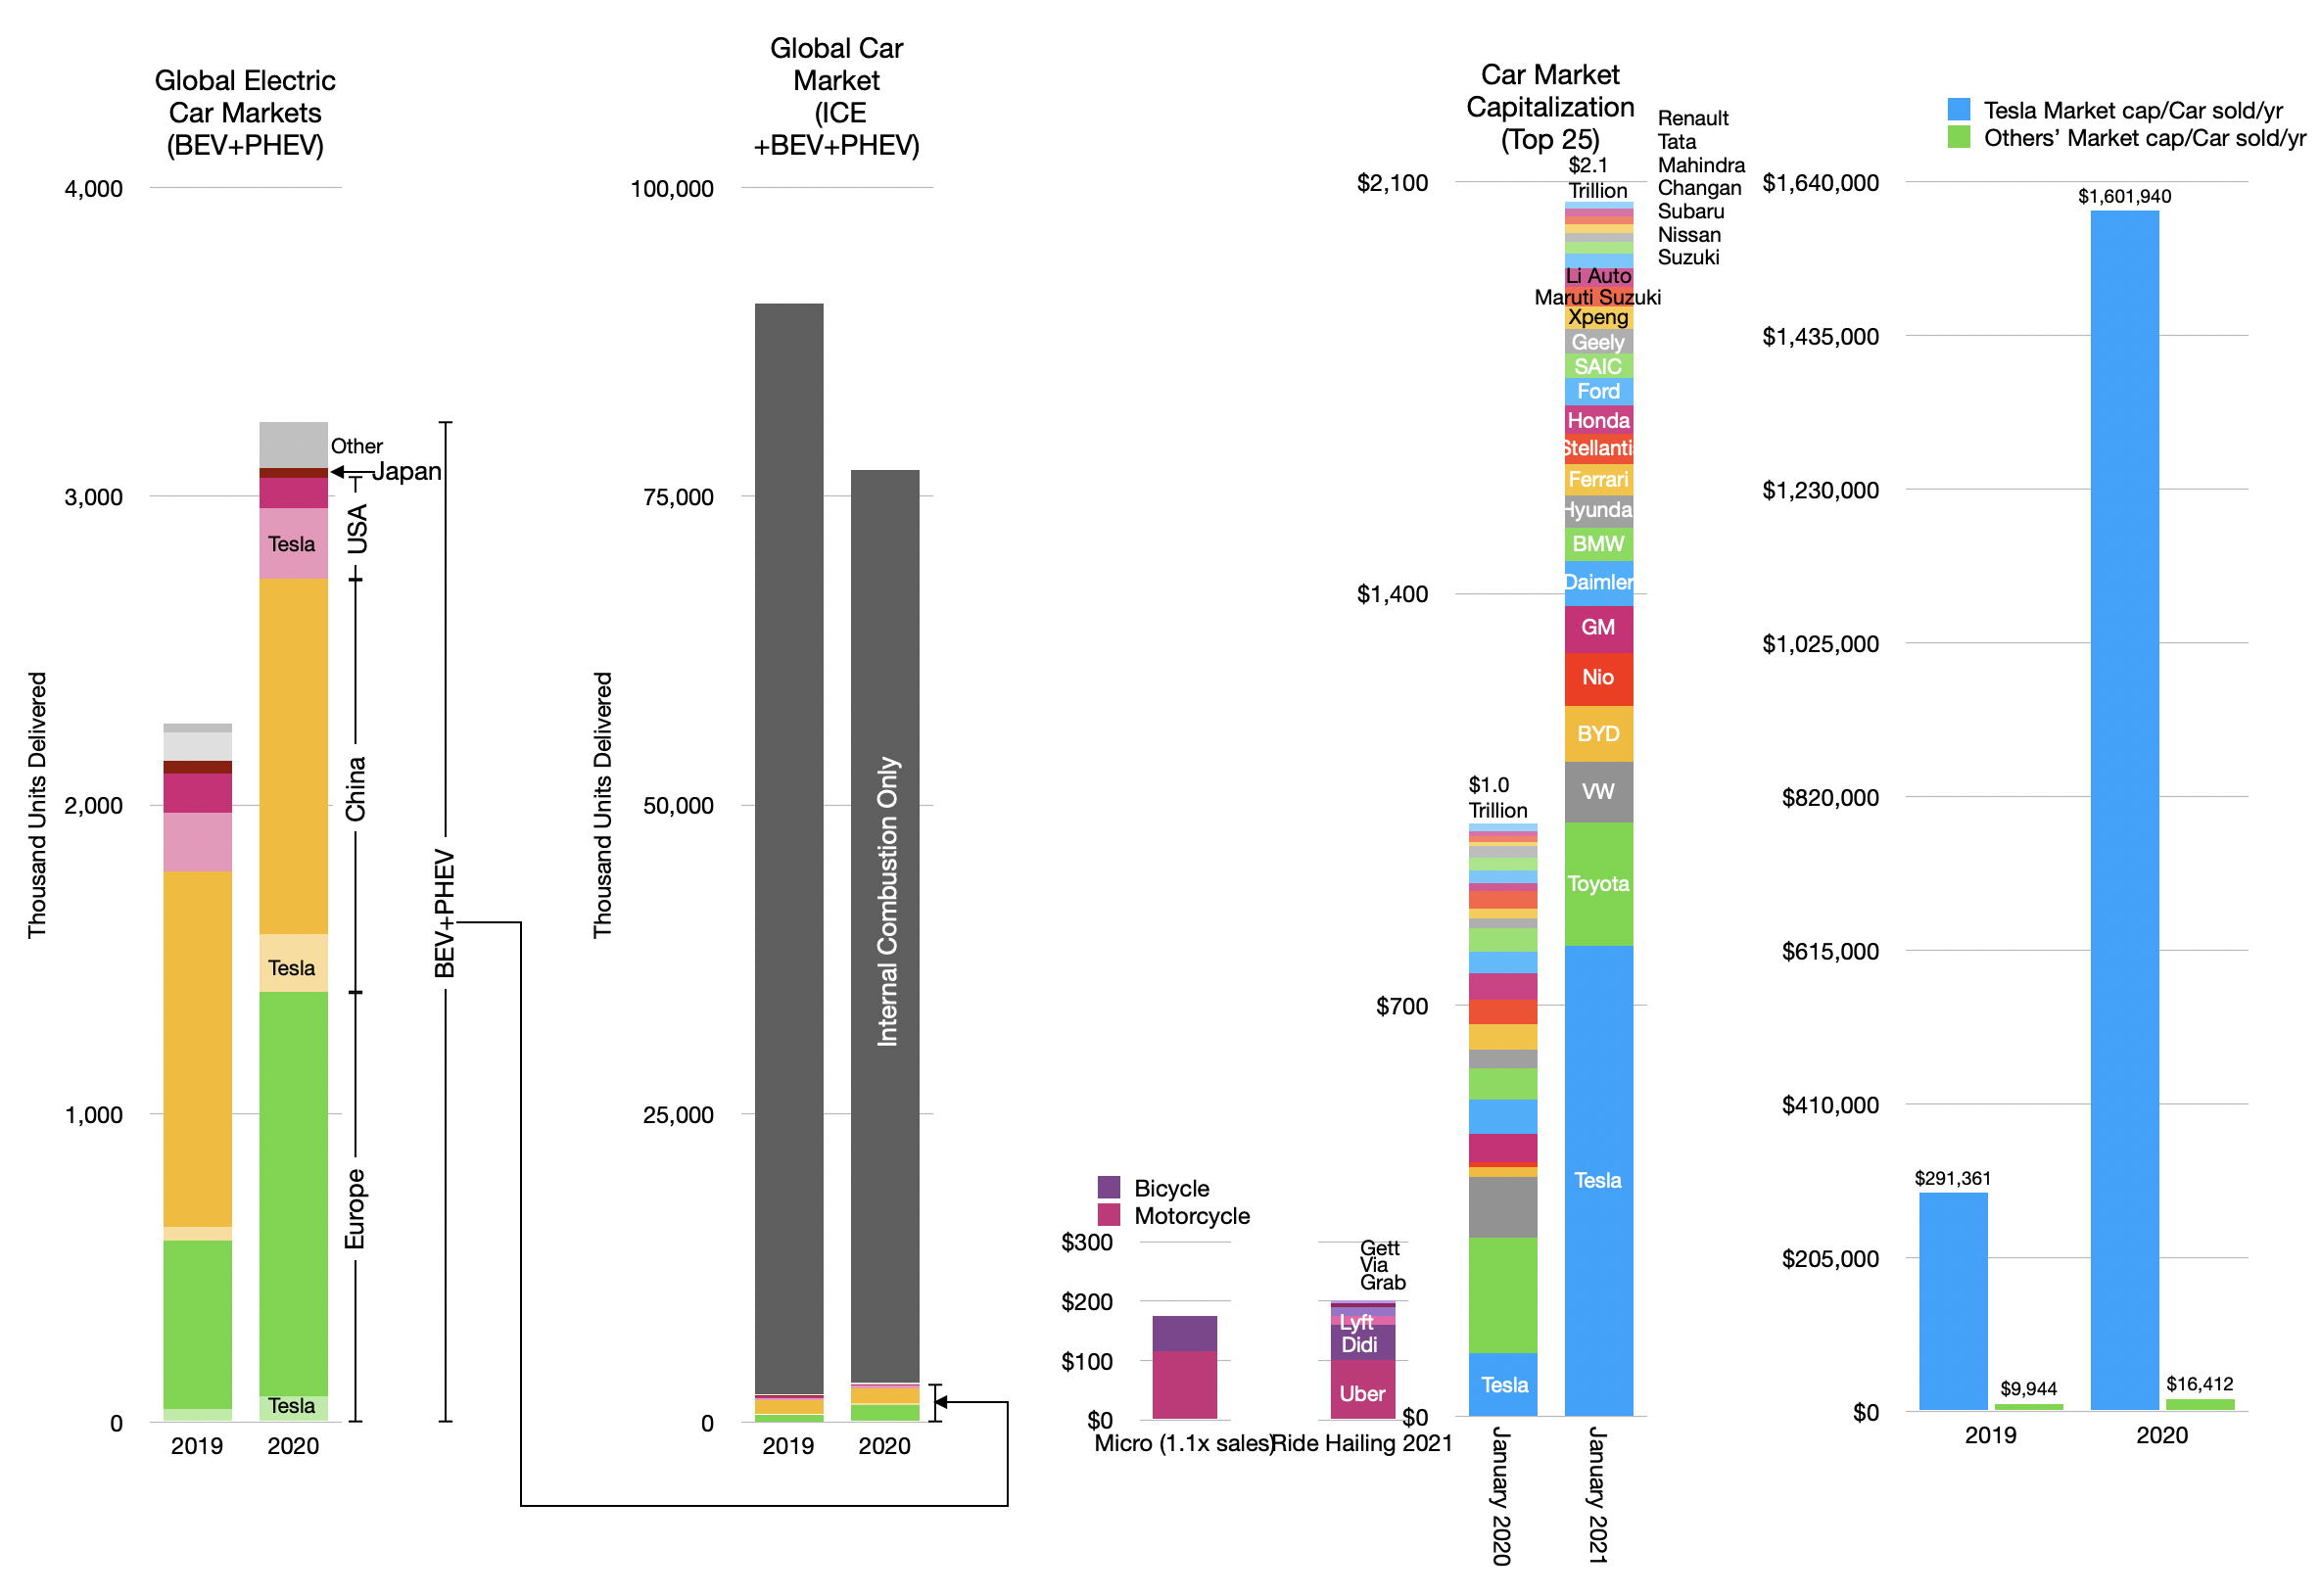
    But if we continue to pull the thread there's yet another story to consider. The car industry (i.e. making and selling and servicing cars) is not the only way to deliver "miles" to citizens. There are multiple "modes" and services that deliver transportation.

    There are also the ride hailing and micromobility which are positioned on different "jobs-to-be-done" than cars. The market capitalizations of ride hailing and micromobility are shown below

    Adding the value of ride hailing and motorcycles and bicycles.

    Note that micromobility is only measured by the value of motorcycles and bicycles whose markets are measurable and applying a 1.1 multiple to those sales yield a rough estimate of market cap.

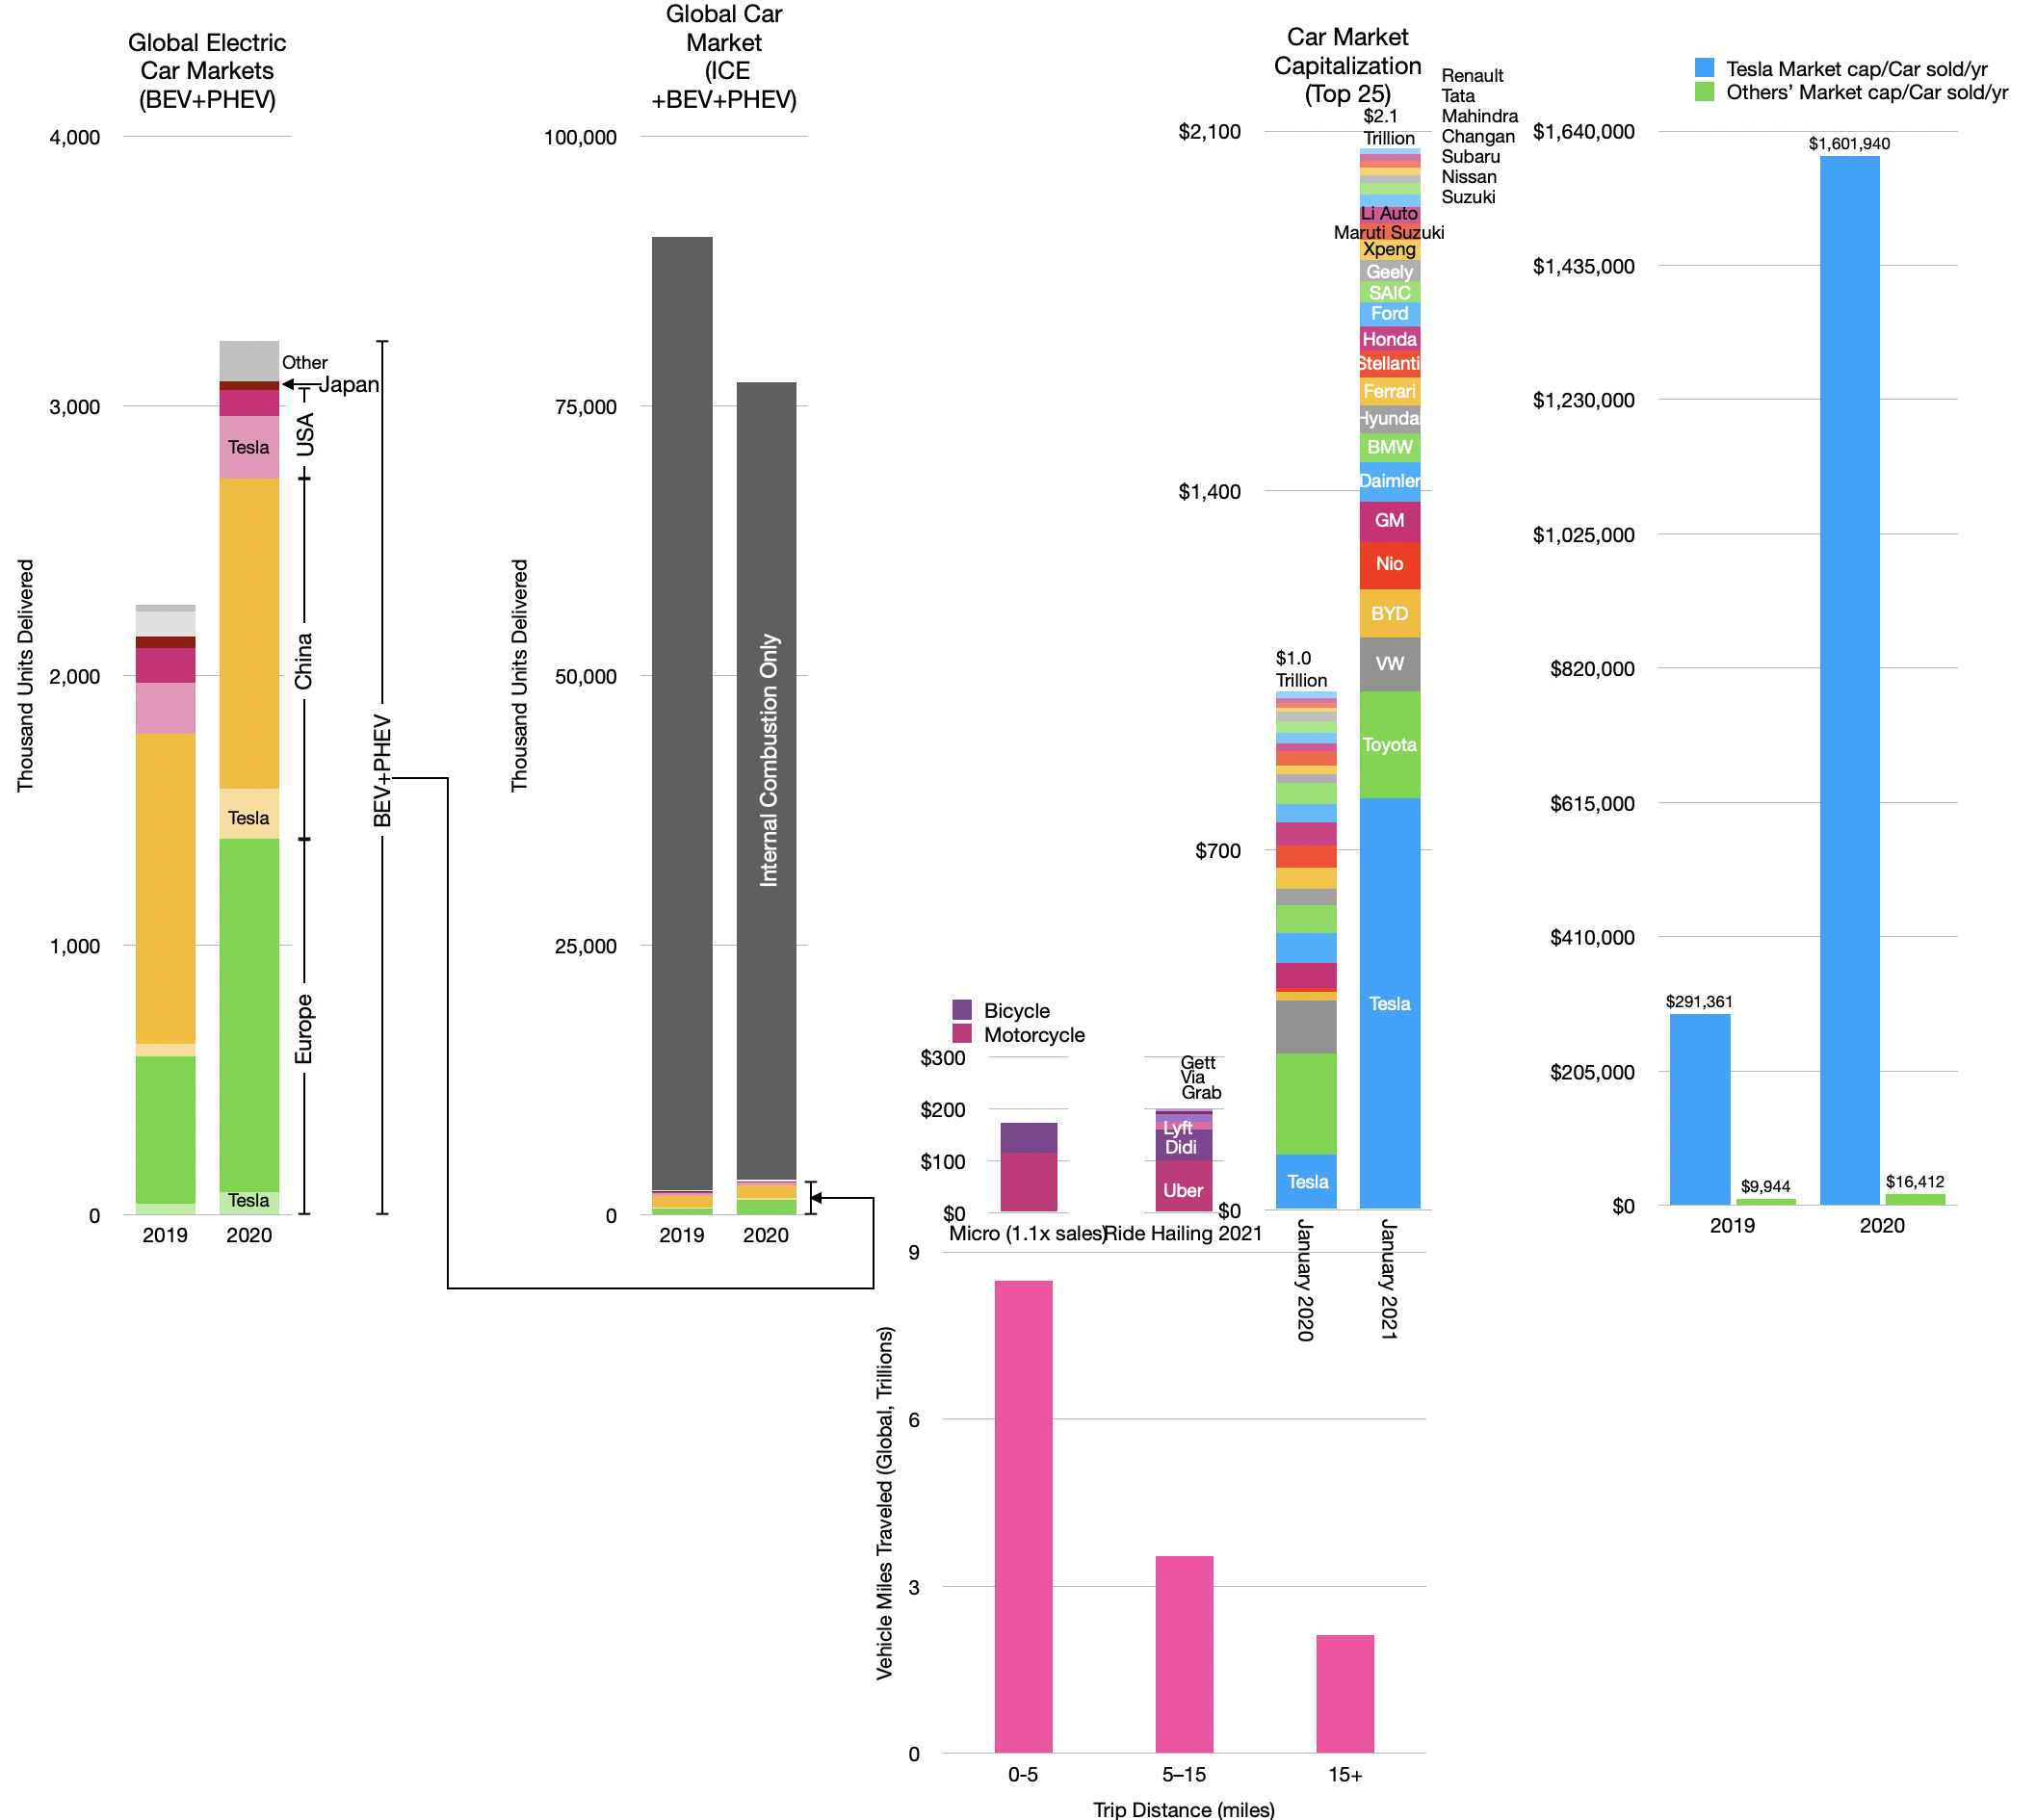
    It's hard to get a measure on these jobs but I've taken to heart the idea that what you measure is most important in seeing what's next and have been dividing the "market for miles" into short, medium and long distance trips.

    The "Car Bundle Paradox": The demand for travel vs. value of modes for travel by trip distances.

    In the view above we get a sense of the scale of perceived value for businesses serving various trips. The inverted nature of valuation positioned on trips is, I believe, worthy of further analysis.

    As the car today is a bundle, the design and engineering efforts are directed at serving the longest of long trips (with the largest payloads.) But the demand is for short trips.

    If the car is to be unbundled (as the Personal Computer was into laptop, tablet, phone, wearables) then one can imagine that devices designed for short trips would accrue the value of those trips (and their popularity).

    The absence of value in short trips is a paradox. Or perhaps it's just an opportunity.

  6. On knowing the value of everything and the price of nothing

    Research · 52 comments

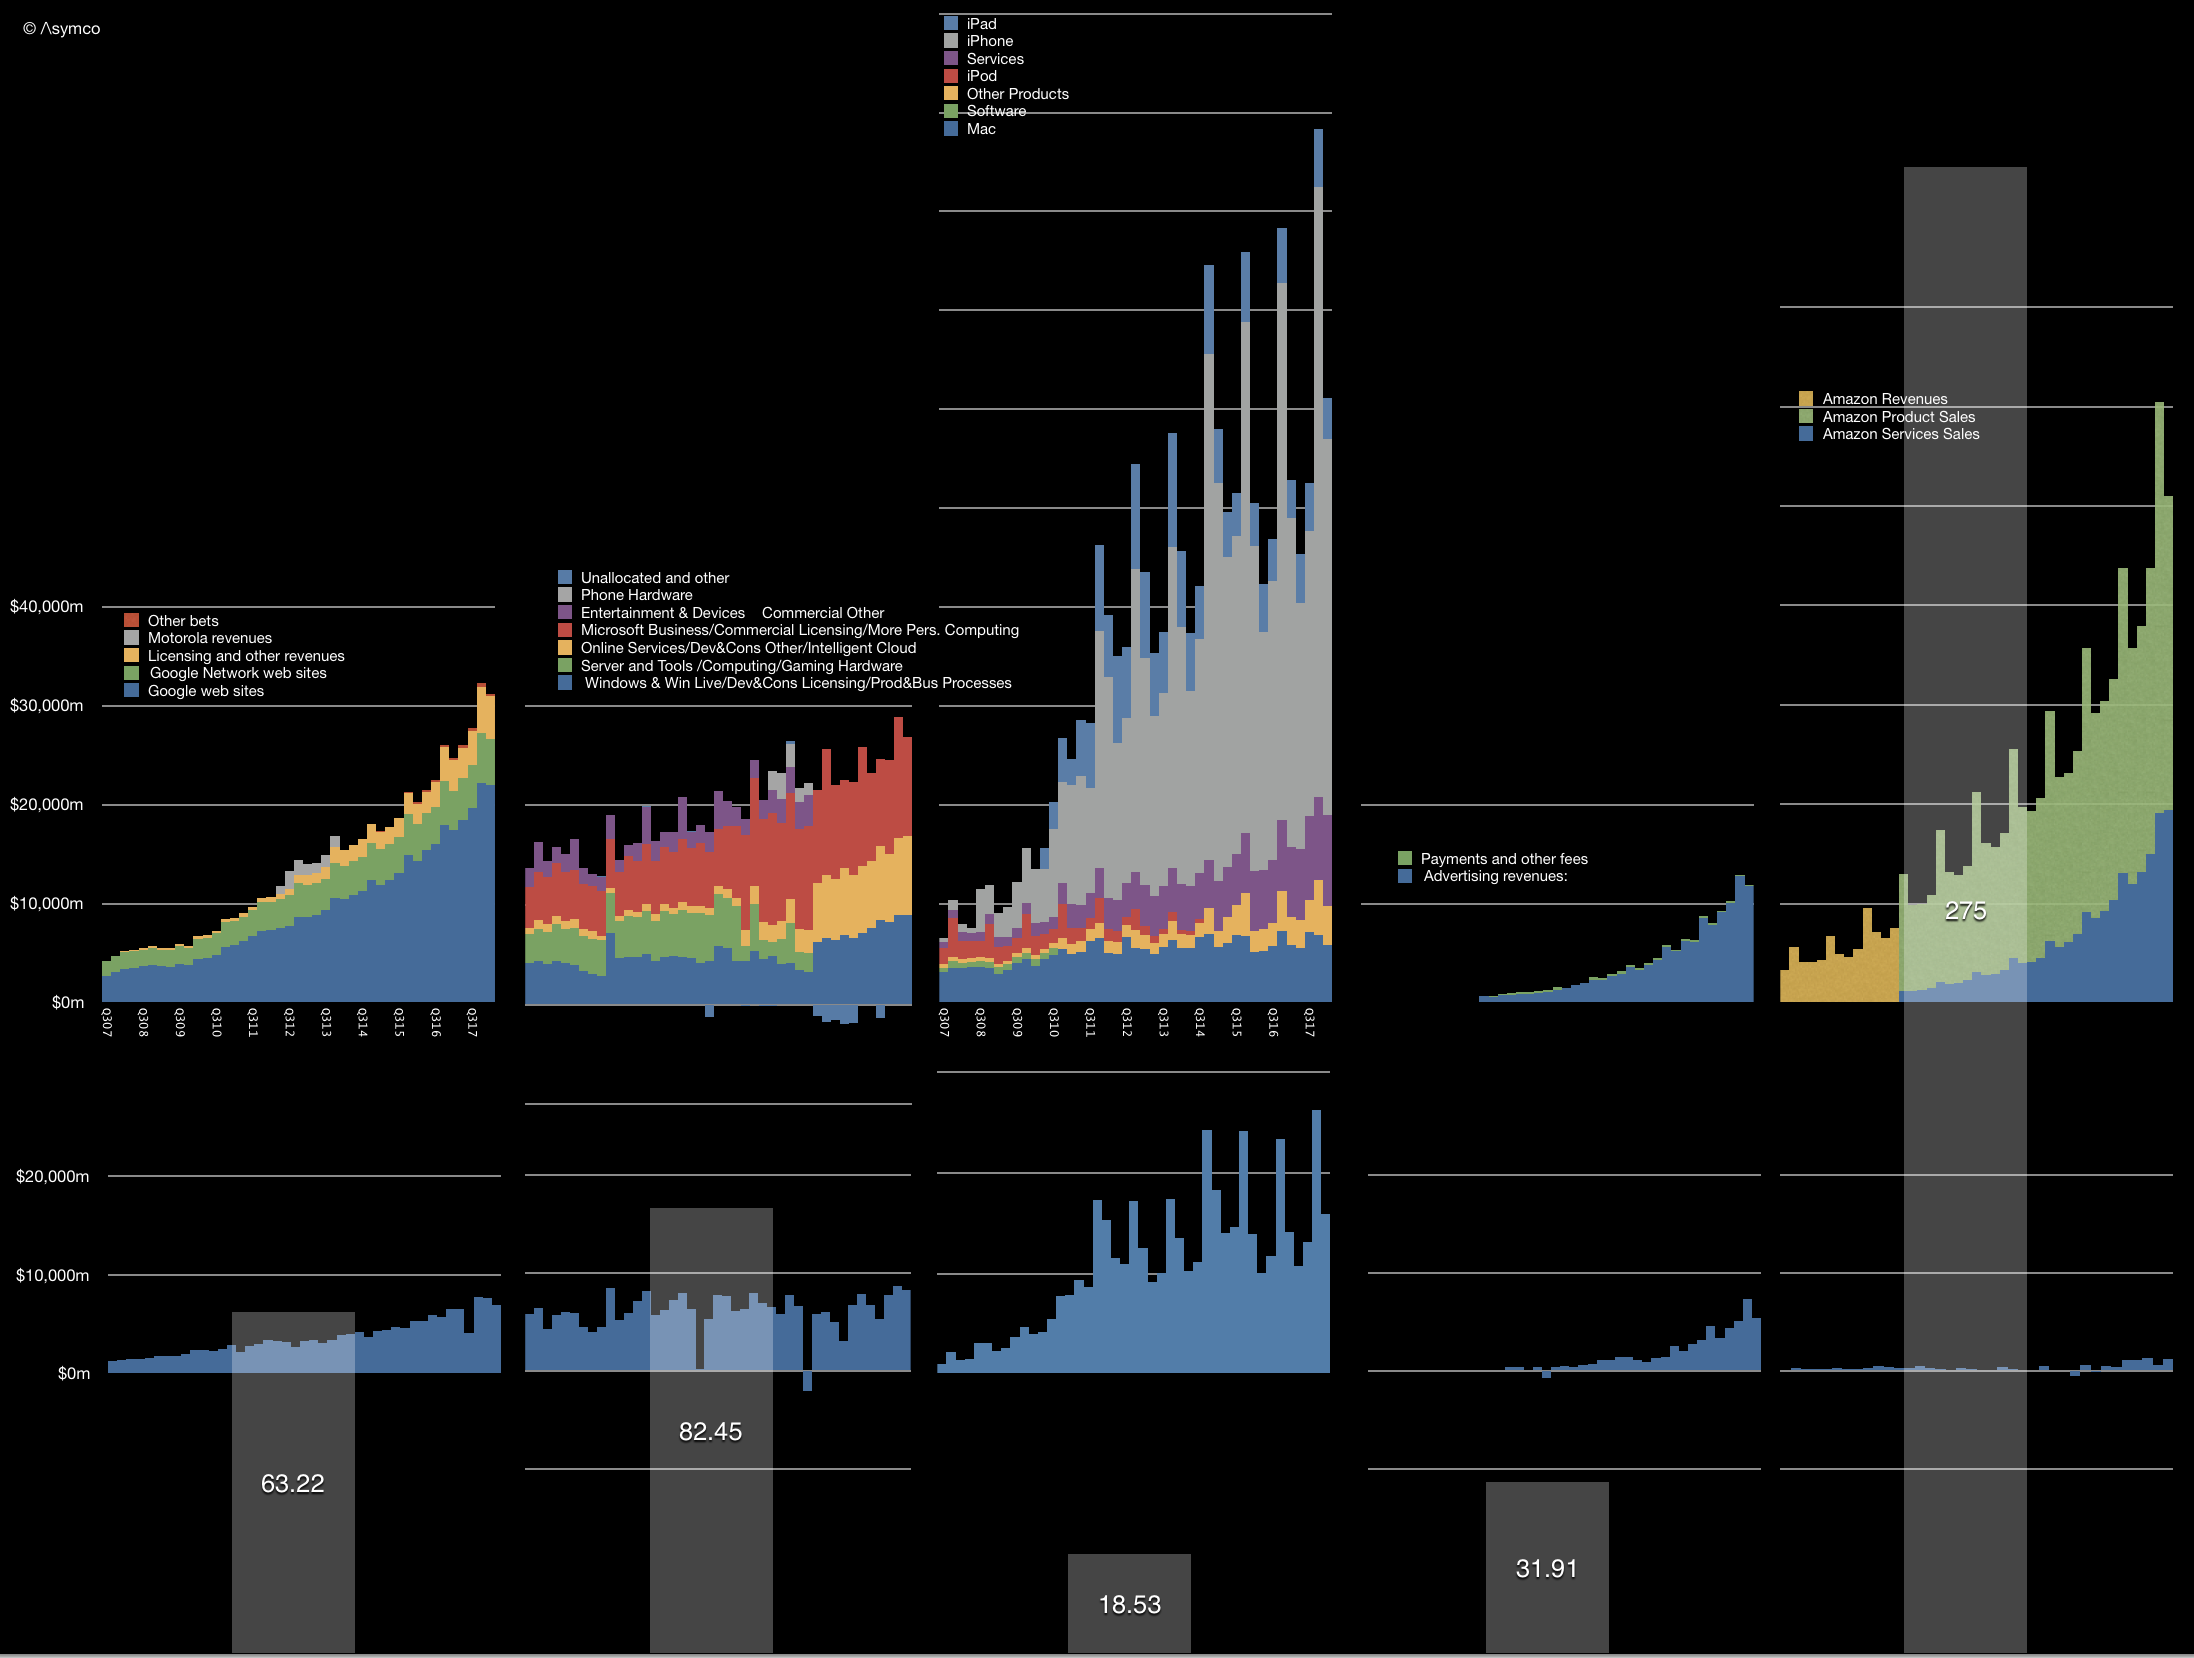
    At the latest Apple Summit in Los Angeles the question of Apple's valuation was foremost on many minds. The illustration I used there to discuss valuation is shown below.

    It shows the history of revenues (by reported segments) and gross margin for the five largest companies in the world by market capitalization. I have been publishing this illustration for five years ((initially with Samsung rather than Facebook because it was originally a set of "challengers" to Apple. The fact that with only one substitution the illustration turned into a view of the five largest companies in the world was a welcome surprise.)) in order to contrast the growth and perception of value between companies that might be considered comparable with Apple. Thus the graphs show the top and (near) bottom lines of the companies over an epoch of about a decade. ((This being the iPhone epoch))

    In contrast with the histories above, there is a price set on the equities today. These prices are captured by the market capitalizations as follows:

    Current market cap (billion) Peak market capitalization (Billion)
    Apple$918$955
    Amazon$844$856
    Alphabet$810$825
    Microsoft$780$789
    Facebook$584$589


    Market capitalizations are interesting because they show perceptions of value. The traders in the equity are negotiating with each other on what the shares are worth and, as a voting system in a liquid public asset, share pricing is very representative of the perceptions about that asset. Representative because there are literally millions of decisions being made on a daily basis which determine this price.

    The sales and profit data in the illustration above is about the past. In contrast the market engine is voting about the future. Any student of finance knows: the value of a company is the net present value of all future discounted cash flows (plus any current assets.)

    So what would history have to do with it? What use is the trajectory?

    This goes to a deeper question: How does history inform the future? What is the value in knowing previous performance when thinking about future performance? The common caveat in mutual fund prospectuses is "Past performance is no guarantee of future results". We are repeatedly warned of this because it is within our nature to look at history and recognize patterns. But beware! At least beware those whom you might entrust with your fortune.

    But consider that it's conventional wisdom to also say that culture and preparation are the best ways to ensure a prosperous future. Ask athletes or coaches and they will say that practice and dedication lead to success.  Sports fans know that a team or player with a record of success is more likely to succeed in the future. In this way sport is, in many ways, a simulation of reality. Which is why it's so popular: a metaphor of life teaches as well as entertains.

    Knowing how to read ability as well as conscientiousness are keys to scouting talent. Again, it's not a guarantee, but in various fields of human endeavor the past does predict, with high accuracy, the future.

    This relationship between past and future is what education is based on. We spend our lives preparing and training ourselves and our children and their children with the implicit hope that this leads to better outcomes for everyone. We establish a pattern of success because it is the best predictor of future success. Practice, learn, commit, defer satisfaction, trade time for knowledge, fight, lose and try again. These are the qualities we look for in the past of individuals when assessing their potential for the future. Culture is everything, we are told. Build a track record, we tell the young.

    So what does this have to do with valuation?

    We can't easily measure the cultures of persistence and perseverance in companies. Grit, guts, stoicism, fortitude, courage, the Finnish "sisu". These are not measurable in financial reports. Yet our language is as filled with words to describe character and our financial reports are empty of them.

    It's left to investors to work it out. The exercise of relating the future to the past is the calculation of the ratio between Price (future) and Earnings (past). A high P/E ratio suggests repeated success from past success. A low P/E is a disbelief in a future repeating the past.

    The P/E ratio thus allows us to say to what degree recent past performance is repeatable. I.e. how many `last years' can we expect in the future. A P/E of 1 means a company is worth what it earned last year. A P/E of 10 means it is worth ten years' proceeds. ((We could easily calculate P/E for more than one year but the default is one year.))

    This P/E ratio is shown for the five companies above as the overlaid bars in the graph above.

    Sure, you say, but it depends on the industry and circumstances. A future divorced of the past is more likely in an environment where there is rapid, chaotic change. The more volatility in fundamentals, the more uncertainty. Technology is changing rapidly and therefore it's quite possible that Apple's low P/E reflects this disconnect.

    If so then what about its peers? Why would Apple be subject to different technological risk than other technology companies? All of the top five companies are considered "tech". Indeed, Apple is perhaps the least technologically oriented as it has a brand and consumer orientation. It operates hundreds of stores, and sells design as much as it sells algorithms. It fundamentally tries to deconstruct human needs and package those needs in products.

    Alphabet, Microsoft and Facebook primarily don't "sell" to end-users. The revenues come from businesses in the form of advertising or licensing. They don't have support staff, interacting with people who buy what they use. They need to understand needs but they trade other things. And Amazon offers AWS to enterprises as its own unique product. Other than AWS it operates a marketplace, acting as an intermediary.

    Apple is a consumer company depending on consumer tastes as a brand. This is more typical of a non-tech company in a boring business of consumer brands.

    But it's not valued as either a tech company or a consumer company. Both have typically higher P/E ratios. In fact, Apple's P/E ratio is lower than the S&P 500 and has been below that level for almost the entire history of the iPhone, regardless of growth rate.

    A track record of hit products and the stability of a brand seem to be of no value. Perseverance, consistency and stability are not valued. If it were an athlete with a track record of world-record performance and a spectacular reputation with the public, it would not be granted an above-average pay for its performance.

    In the past I've argued anti-fragility as a cause. In the context of the other companies, Apple is at the center of perceived vulnerabilities and is thus perceived as vulnerable . The other four are at the center of no competition and perceived as invulnerable. And yet Apple, so far, has survived. So have the others, but apart from Microsoft, they are much younger. I argued that Apple exhibits anti-fragility and has unrecognized robustness. Perhaps Warren Buffet now agrees and this is encouraging to the thesis.

    Yet, at an even deeper level, in Apple's valuation we see how culture is not valued. How the idea of character assessment is not applied to businesses. How ethos is unquantifiable and thus discounted. How markets, accustomed to weighing things, reflective of collective human judgement, demonstrate that we are woefully incapable of valuing that which matters most.

    Oscar Wilde famously said that the cynic knows the price of everything and the value of nothing. Here's to the sentimentalist, because at the end of the day those who change the world know the value of everything and the price of nothing.

  7. Does Growth Matter?

    Research · 85 comments

    In last week's discussion of Apple's (historically low) valuation, comments arose that perhaps the company's discount is not unique. Can we look at comparable companies and determine whether the relationship between growth, size and valuation are consistent?

    The challenge is in finding "comparable" companies. Apple is characterized by being large in terms of market capitalization, highly profitable, in the technology sector and growing relatively quickly. One can find a cohort of companies with each of these characteristics but not all.

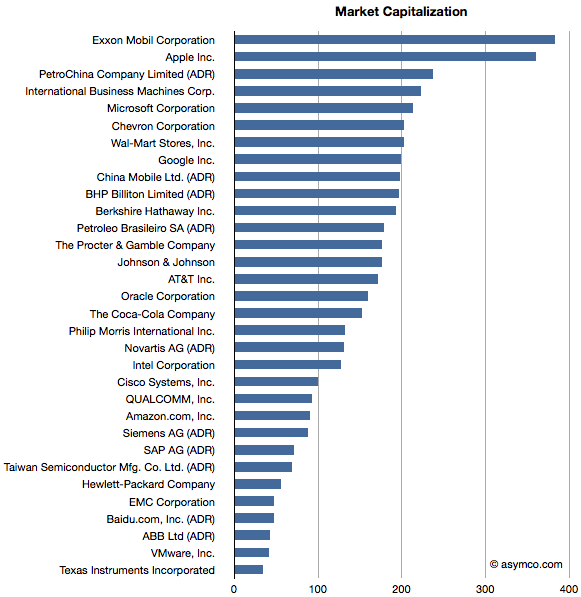
    Here is an attempt at looking at the largest companies by Market Capitalization (the so-called Mega-caps) to spot patterns of valuation. Some of the companies in the top 20 mega-caps were technology companies so I thought I'd highlight them. I then also added a few of the top 20 technology companies by capitalization to create a larger sample.

    The group I settled on is shown in the list below ranked by market cap.

    Companies below $130 Billion in market cap (i.e. below Novartis) are in the top 20 technology list but not in the top 20 overall list.

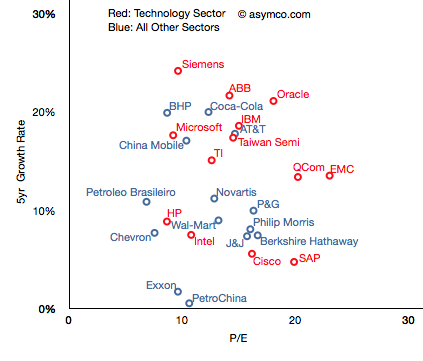
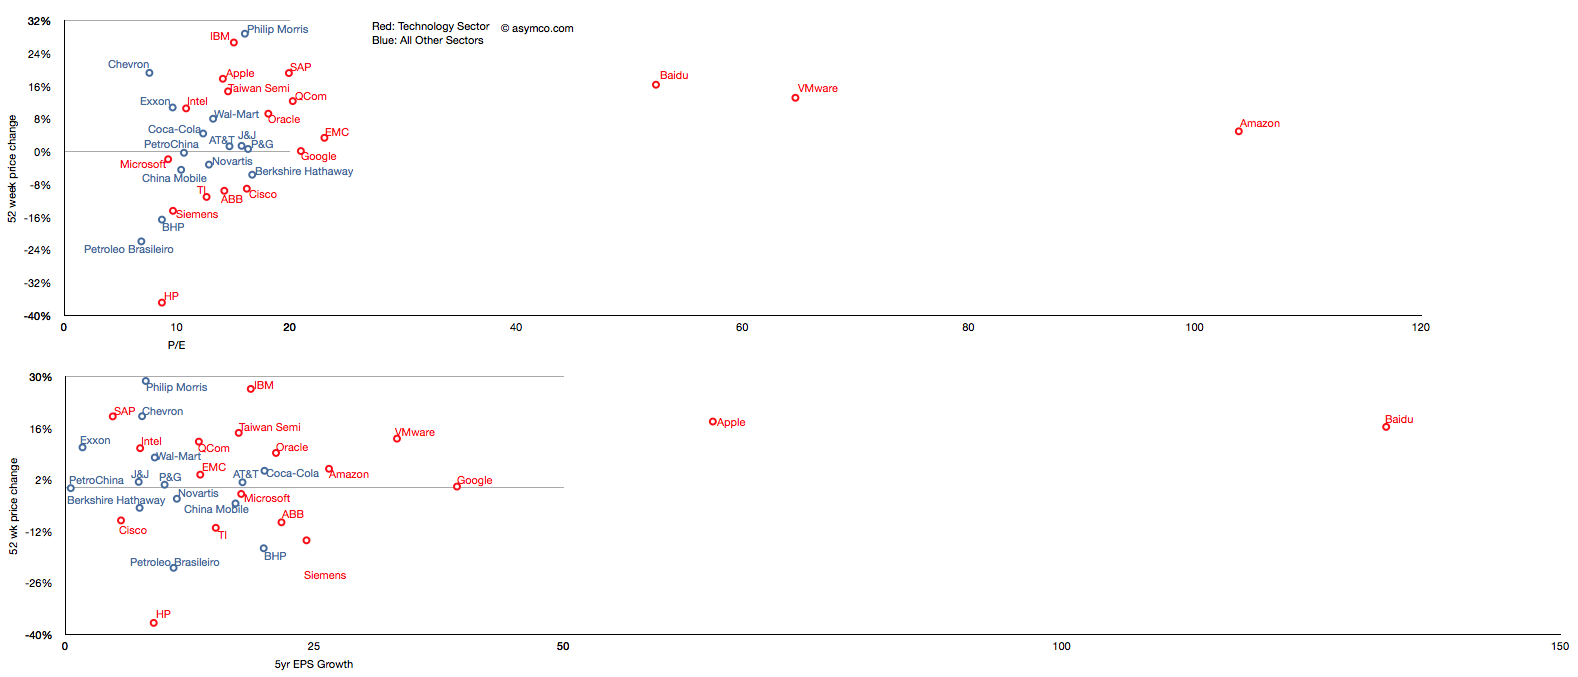
    I then plotted the P/E rate vs. 5 year Growth Rate for these companies, separating the tech sector by color (Red):

    The pattern is not encouraging. It appears that there is no correlation. Perhaps the technology companies are, as a group, further up and to the right, but overall they are equally unobservant of growth.

    For example, SAP has grown less than 5% in five years and yet enjoys a P/E of 20 whereas Microsoft has grown 18% and has a P/E of less than 10. The non-technology sector companies are similarly broken. Berkshire Hathaway, a conglomerate, is rewarded for slow growth and China Mobile is punished for relative high growth.

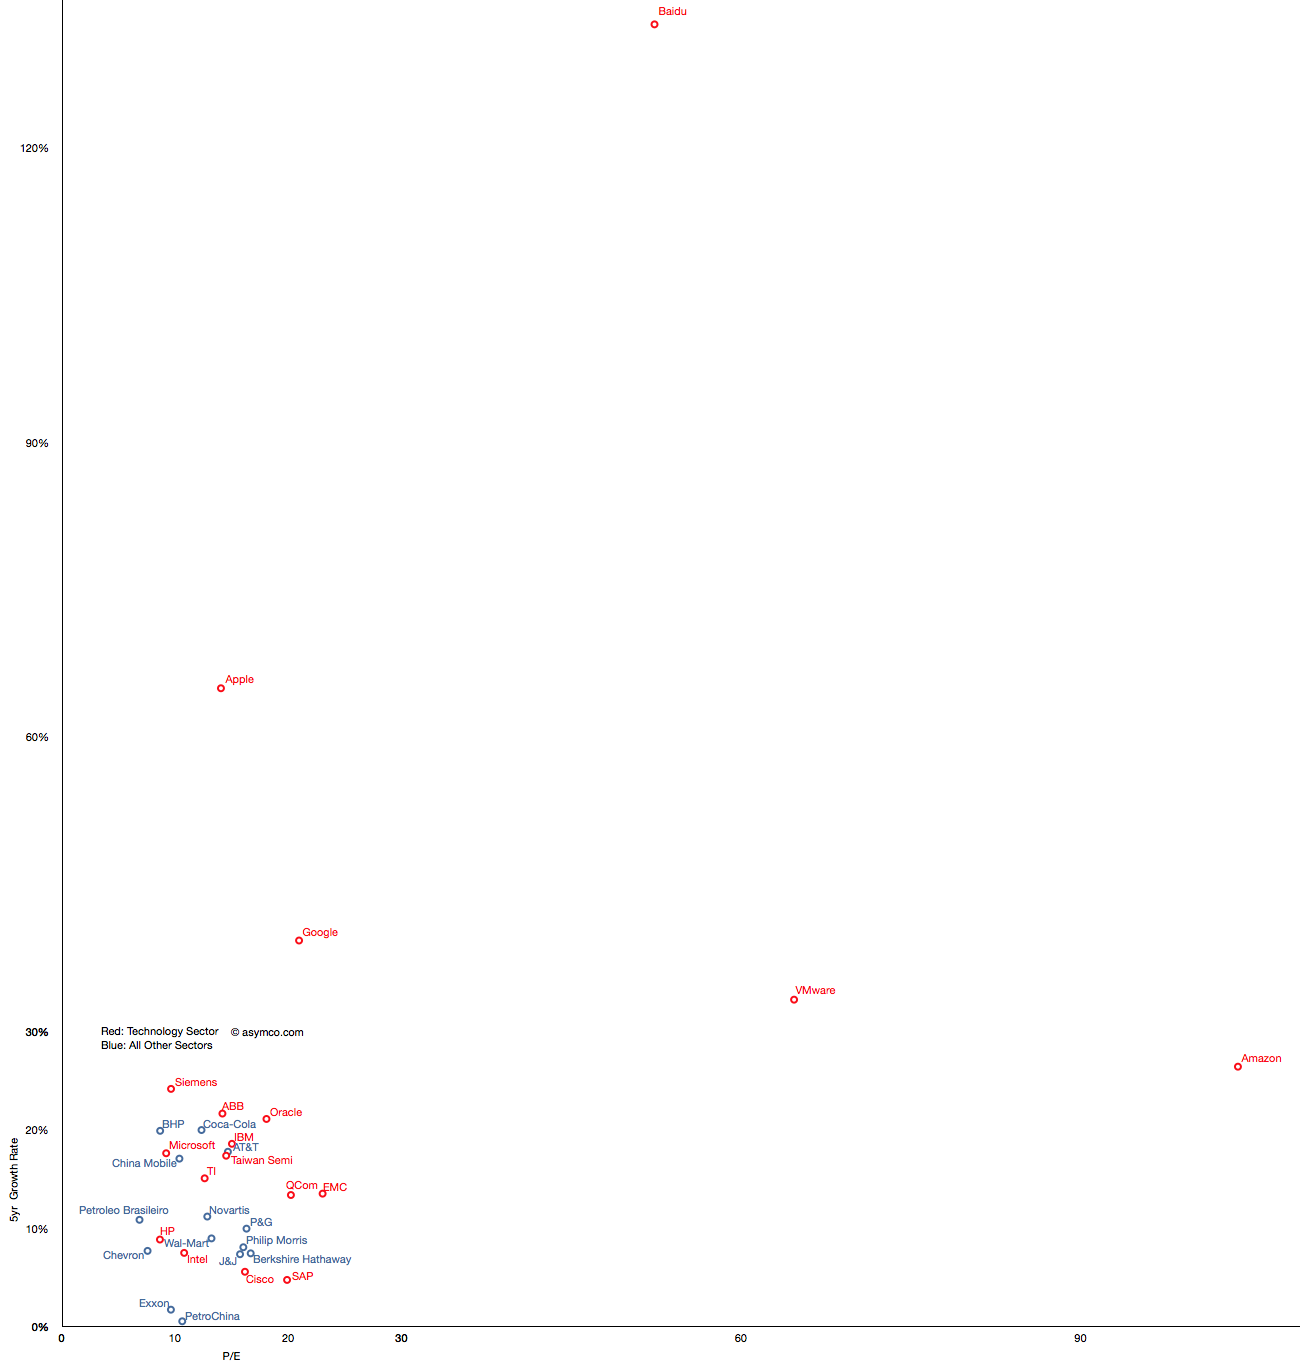
    But you'll notice that some companies are not on this chart. That's because they are outliers. Their growth or P/E are so far out of this cluster that the would make it impossible to discern individual performance. The complete "top 20" picture is shown in the following chart which will require either a large display or a lot of scrolling (1300x1364 pixels):

    With this level of detail, we can see how distinct some companies are. Not only from a correlation point of view but from a cluster of peers. The outliers are Amazon, Baidu, VMware, Google and Apple.

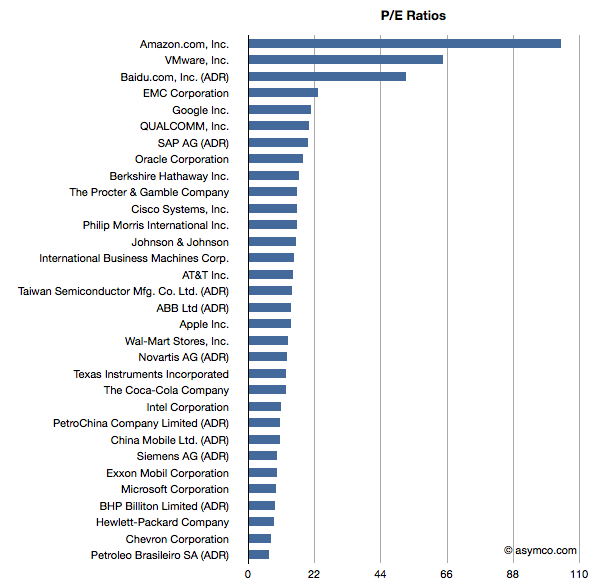
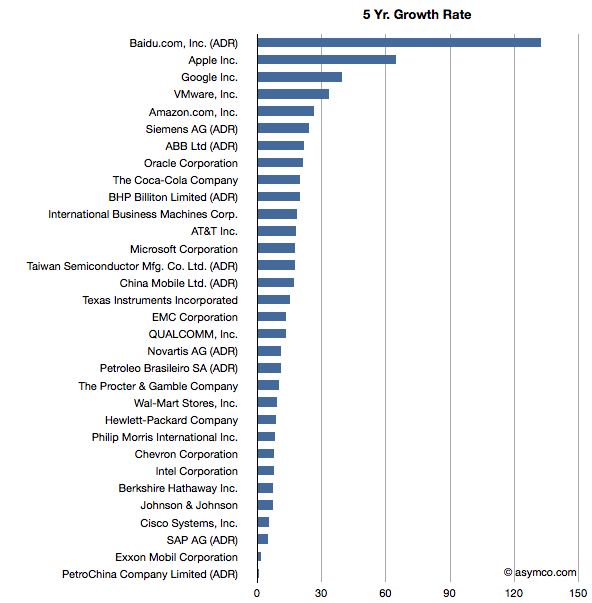
    These outliers can be seen also in ranking of P/E and Growth:

    Baidu has grown earnings by 132 percent while creating a market cap of $47 billion and has a P/E of 52. Amazon has grown by 26% while having a total value of $90 billion and a P/E of 104. VMware is "only" a $40 billion market cap company with a 5yr EPS growth of 33% and a P/E of 64. Finally, Google has returned a 39% growth rate, a market cap of about $200 billion and a P/E of 21 and Apple brings up the rear of P/E with 14 but with the second largest market cap of $360 billion and the second largest growth of 65%.

    What this analysis shows is that the market does not have any "rule" of rewarding growth with a high P/E. If anything, the outlier analysis shows that there are significant anomalous valuations that cannot be explained by growth data.

    ---

    Note: I've also tried to observe correlation between recent share price change and growth and recent price growth and long-term earnings growth.

    Similar anomalies and lack of correlation can be observed.

  8. Visualizing the Steve Jobs era

    Research · 44 comments

    On October 4th, Tim Cook will take the stage at Apple’s fall event. With Steve Jobs’ transition to head the Board of Directors of Apple and after serving as CEO for fourteen years, it is time to take a look at his reign.

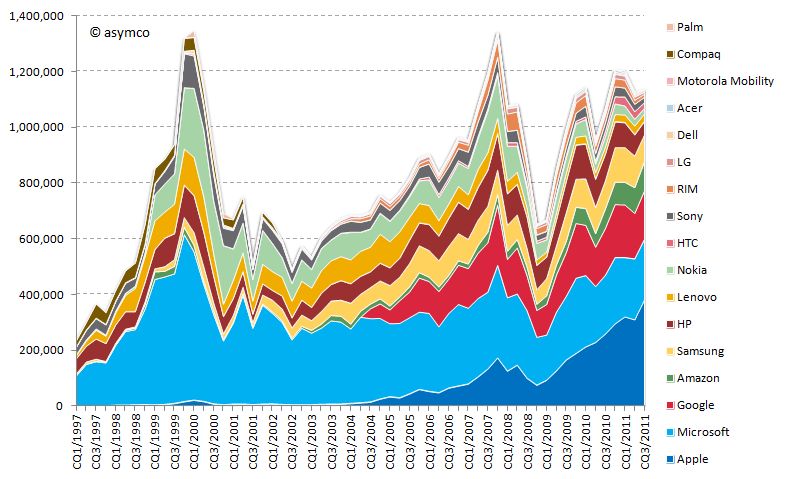
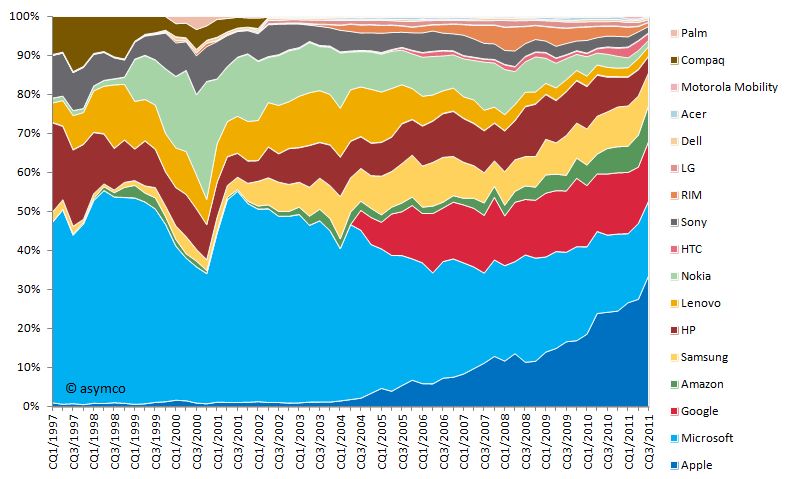
    Looking at his performance vs. peer companies from a capital market performance, I have composed the following two charts:

    Market capitalization of selected peer companies by calendar quarter in USD million sorted by most recent market capitalization (1997-2011)

    Market capitalization of selected peer companies in USD million sorted by recent market capitalization (1997-2010)

    Market capitalization as share of combined market capitalization by calendar quarter sorted by most recent market capitalization (1997-2011)

    Market capitalization as share of combined market capitalization sorted by recent market capitalization (1997-2010)

    You will note that I included more companies than in previous analysis. The new additions are:

    • Compaq (acquired by HP in 2002)
    • Palm (acquired by HP in 2010)
    • Amazon (a popular request by readers)

    I divided this era into three distinct periods:

    Restructuring of Apple 1997-2000

    In the beginning of 1997, Apple’s market capitalization was lower than almost all of its peers. In absolute terms the market capitalization moved only slightly upwards towards 1999 and the dent in 2000 is significantly lower compared to the market capitalization increase of other companies, first and foremost Microsoft's. Especially in the early part of this period restructuring and streamlining efforts took precedence. The introduction of iMac in 1998 and the iBook in 1999 set the tone in terms of design, quality and "thinking different" for many years to come.

    iTunes era 2001-2006

    With a stable core business and healthy profitability, Apple introduced the first iPod in October 2001 complementing the earlier introduced iTunes music player. Two years later, Apple introduced the iTunes Store offering downloadable music for the Mac and Windows operating systems. The venturing into the music and portable music player business and the halo effect for the Mac business is reflected in the market capitalization increasing significantly during the following years surpassing HP and Nokia.

    Mobile iOS devices 2007-2011

    Market capitalization further increased with the entry into the smart-phone market in 2007. Note that market capitalization of all selected companies combined at that time was as high as in the dot.com era of 2000. But this time Apple accounted for more than 10% of it. From 2008 to 2009 market capitalization of all companies declined severely due to the financial crisis. Rapid recovery followed during 2009 and early 2010. Apple introduced the iPad in March 2010 further fueling its rise to the top, surpassing Microsoft’s capitalization and topping Exxon Mobil as the world's most valuable listed company.

    During the time of Steve Jobs as CEO, Apple's market capitalization increased on average by 42% every year--an unprecedented track record. According to his own admission, Steve Jobs became CEO when Apple was 90 days away from bankruptcy. He resigned 14 years later after leading Apple to becoming the most valuable listed company in the world. From a value creation point of view, it's hard to think of a better performance from anyone, ever.

  9. If Cash is King, Apple's is an Emperor [Updated]

    Research · 84 comments

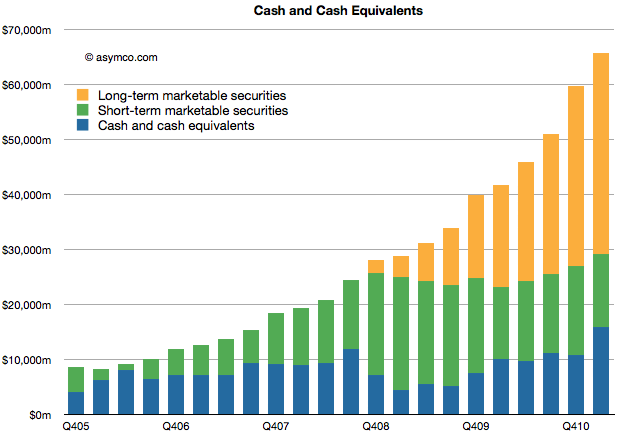
    Apple's cash for short-term and long-term marketable securities totaled $65.8 billion at the end of the March quarter. Cash increased by $6.1 billion.

    The increase in cash is net of approximately $900 million for prepayments and capital expenditures related to the strategic supply agreements that Apple announced last quarter.

    The following chart shows the historic cash, short-term and long-term liquid assets Apple holds.

    As in previous quarters, the securities Apple holds are:

    • Cash
    • Money market funds
    • U.S. Treasury securities
    • U.S. agency securities
    • Non-U.S. government securities
    • Certificates of deposit and time deposits
    • Commercial paper
    • Corporate securitiesMunicipal securities

    Although the asset classes are all liquid, those with longer maturity dates are classified as "long-term" securities (orange area in chart above) and are often not counted as "cash" in many financial databases.

    The enormity of the overall size of this cash can be put into several perspectives:

    • The funds are big enough to place Apple's CFO office in the top 100 largest fund managers in the world and larger than any hedge fund manager.
    • Cash growth in one quarter was higher than the market cap of many companies. For example, if pre-payments were added back, the cash increased by about the market cap of Motorola Mobility.
    • Current cash is worth more than Nokia, RIM and Motorola Mobility's market caps, put together.
    • Apple's cash is worth half of Google's enterprise value.
    • About two years ago, in January 2009 the stock traded at a price of $78 with at least one analyst placing a target of $70 on the stock. Today Apple's cash is worth $67 70/share.
    • If you owned $100,000 of Apple stock, $19,000 of that would be cash and only about $80,000 would be "at risk" capital.
    • If Apple had no revenues, the current cash would sustain operations (SG&A and R&D) for over 7 years or until the middle of 2018.

    When analysts cite limits to the rate of Apple's growth on the basis of the "law of large numbers" I wonder if there is an implied limit to how big this cash pile can grow. By looking at the chart its size seems to be growing faster all the time.


    [Updated] The cash per share figure was wrong. It is $70/share.

  10. HTC and self-determination

    Research · 74 comments

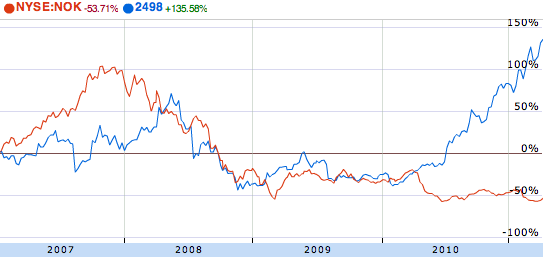
    HTC's market cap has just overtaken Nokia's. While market capitalization is a fickle thing, shifting with sentiment, this is still a remarkable feat. Nokia's market capitalization has almost halved in the space of a year while HTC has more than tripled from $10 billion to over $33 billion.

    If you roll back to 2007 and the start of the modern era of smartphones, you can see how the two companies stocks traded places:

    (source: Google finance)

    The recession was hard on everybody but HTC soared during 2010 while Nokia never recovered. Markets reward unforeseen growth and typically that means above-market growth.

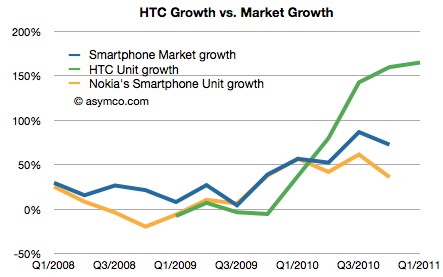
    That's reflected in the following chart (admittedly units and not profits, but pricing and margins for both have remained relatively steady.)

    As Nokia's growth lagged the market the stock was punished. As HTC's growth exceeded the market's growth, the stock was rewarded.

    But there are a few more observations to make:

    • HTC's smartphone business was under-performing the market for most of 2009. In fact, it was even in negative growth for three quarters.
    • The surge in growth coincided with HTC adding Android to its portfolio and given no other changes, seems to be causal.
    • Although not within the time range of the charts above, HTC had another period of rapid growth in the mid 2000s.

    A year ago HTC was making excuses and apologizing. Today they are more valuable than the largest phone vendors. All thanks to Android.

    But why no thanks to Microsoft?

    HTC was the primary Windows Mobile vendor a few years ago. They claimed at one point to have shipped over 80% of all Windows Mobile devices. They were also the leader in the Pocket PC franchise as they were the ODM behind the iPaq brand from HP/Compaq. HTC would not exist today were it not for Microsoft.

    The relationship is such that HTC is paying Microsoft for protection from (potential) Android IP infringements. HTC has also licensed Windows Phone though the relationship between Nokia and Microsoft must give them pause.

    But that's the whole problem. Those who live by the sword shall die by it. HTC was a Microsoft dependent and now they're a Google dependent. As the basis of innovation shifted, HTC was agile enough to make the transition. Perhaps they can execute a portfolio switch yet again as their upstream suppliers change whims or business models.

    But then again, as we saw with Windows Phone, perhaps not.

    If HTC wants to control its destiny it needs to control its suppliers. Now that its power and brand have grown, it needs software because in their market software is self-determination.

  11. Apple's Growth Scorecard: 63% average earnings growth over 16 quarters

    Research · 30 comments

    In the last quarter Apple's top line grew by 70% and the bottom line by 75%.

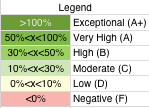
    For a historical perspective, the following table shows year-on-year growth for products[1] and sales/earnings color coded with an arbitrary scoring range.

    The major changes from the last quarter were the acceleration in software sales and the return to growth in iPod sales. iPod benefited from the continuing shift to iOS as the mix is now 50% touch in the portfolio.

    Software growth reached a level not seen since 2008. It's not clear to me yet  which products drove this increase.

    Overall the growth is both wide and deep. I'm most impressed with the iPod as it was a surprise to hear such a high mix of touch.

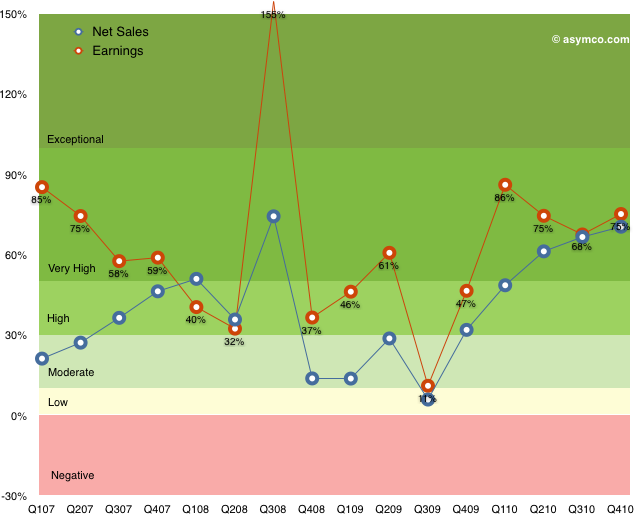
    The following chart shows the top and bottom lines plotted over time with color bands corresponding to the score system in the table above.

    Note how earnings growth has been in the high or very high or exceptional range for all but one quarter over in the last four years[2].

    Apple transcends the mythical "rule of large numbers"[3]. It's not only a mega-cap, but the second largest company in the world by market cap. Not only has this enormously valuable asset just grown in intrinsic value creation by 75% but it has maintained a growth of 70% for the last five quarters.

    If that weren't enough, the average earnings growth has been 63% for the last sixteen quarters.

    ------------

    Notes:

    1. The iPad is not included since we don't have more than one year of sales and this is year-on-year not sequential growth.
    2. The low growth for Q3 '09 was due to the corresponding spike the year before when the iPhone 3G was launched. That launch quarter in 2008 was a seminal turning point in the history of the phone industry when it became clear that the iPhone was not a passing fad. Steve Jobs famously participated in the conference call calling attention to the data which was obfuscated by subscription accounting. Alas, the news was lost in a sea of credit crunch panic.
    3. I have an aversion to this rule as "large" is never defined except in relative terms. For example a $1 trillion market cap may be large because it's unprecedented, but it may be a trifle if the company is priced at book value.