An Office Hours question asked by Roger S., June 9, 2026.
Q: Beyond selling more capable hardware — phones, Macs, iPads — is there real monetization in all of this AI?
Absolutely. They gave us an architecture: it’s about intent, about orchestration, about routing a request through multiple models and input types, and then deciding whether it goes through an app or back to Siri. Where’s the money? My answer is: follow the compute.
If this works on-device, the user is happy buying the device, with the memory it needs, and Apple bundles all of that into the purchase price. Developers still sell their apps, but they’re not selling extra compute. But if a result requires heavy computation in the cloud, through an app, then trace it: who sends you the bill? That invoice comes from somewhere. If it’s a developer or a model supplier, it isn’t free — they’ll ask you to subscribe to get the answer, priced as a fixed fee or variable. Apple gets its usual commission, thirty percent or fifteen, somewhere in between.ssss
If Siri depends on services that don’t go through an app, then Siri charges back through iCloud for the compute. So all they’ve really done is take the exact same business model — Services with subscriptions — and either fold compute into existing subscriptions or add new ones. Apple gets the same distribution commission it always has. Nothing changes. In fact, the absence of any commentary from Apple about new economics is, to me, a tacit acknowledgment that nothing different is needed.
That means the App Store, and if anything economically interesting happens, you’ll see another kink in its trajectory — the way we saw a kink when subscriptions became dominant. To users, it’s invisible. Maybe the monthly services bill rises ten percent; maybe they add a couple of subscriptions and drop one. It all reflects in Services, at a 72%+ gross margin, with a hardware uptick alongside. I reckon it’s a ten-year cycle before half of the Apple base are AI active daily, paying something for it. Developers will just see more of the same, only bigger.
Recording and transcript of the June 9, 2026 Asymco One Office Hours, recorded the day after Apple's WWDC 2026 keynote. Horace Dediu shares his impressions of the event and takes questions from Asymco One subscribers.
AI sales are booming. AI FCF not so much. So what new cash flows does Apple Intelligence unlock?
Portrait of Charles Babbage (c. 1820)
Apple's release of a new framework for AI at WWDC26, centered mainly on new layers in the device/OS which process intent to either on-device or world models and couple it to experiences which are system-wide, including apps.
This is how the data and the inferences flow but what about the cash?
I am writing without a full picture in mind, and perhaps one does not yet exist, but my assumption for at least three years has been that the value of AI will split between the creation of (frontier) models and their distribution. Apple chose to focus on local models, license or partner for frontiers and stitch together the means for distributing both.
That is until on-device will be good enough to perhaps bring all models in-house.
But distribution is always where it's at. So how do the new announcements affect this?
Let's follow the money. The costs of inference will be partly borne by Apple for what they keep in private cloud but mainly by apps and hence subscriptions which will include marginally increasing compute costs. This will lead to increasing or new subscription pricing and the usual commissions for App Store distribution.
The fact that this is all implied rather than explicitly stated should be seen as a tacit acknowledgment that the Services business will not change much, if at all. It will perhaps benefit from an uplift if the new AI-powered apps are very popular.[1] This new AI might create more demand or expand existing demand. That will all depend on the innovations developers come up with.
But the elephant in the monetization conference room is hardware. AI demands a huge step-function increase in computing resources--both compute and storage and integrated memory. The minimum requirements are already leaving two to three year old hardware behind.[2]
Again, if AI is compelling enough, users will need to upgrade. Not just their phones but the Macs, iPads, Vision Pros, Watches, probably AirPods too. Then there is Home which is seeing foreshadows of a significant AI enabled upgrade. This means HomePods but also probably new devices altogether. Rumors of spectacles coming are par for the course. Health will also be revolutionized.
This idea that AI is monetized through hardware should hardly be a surprise…
Services has a lot of headroom for growth as non-consumption is still pretty competitive
But don't worry, adoption curves being what they are, and regional/political obstructionism will imply a decade or more before perhaps half the install base is using Apple Intelligence with some frequency.
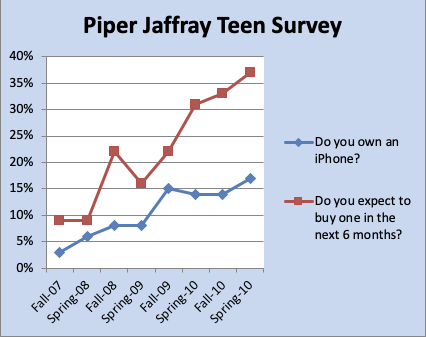
Apple's iPhone continues to be incredibly popular with U.S. teens, according to Piper Sandler's latest biannual teen survey. 88 percent of teens surveyed said that they own an iPhone, and 88 percent said they intend to purchase an iPhone as their next device.
Teen iPhone ownership numbers have increased three percent since April 2024, and are near record highs. The iPhone has long been the most popular smartphone among teens in the United States, and there has been steady growth in teen ownership. 10 years ago in April 2015, 66 percent of teens surveyed owned an iPhone.
Though teen interest in the iPhone is high, other Apple products and services are not as popular. Apple has not made inroads with Apple TV+, and it continues to trail Spotify as the most popular music service among teenagers.
45 percent of teens surveyed have a paid Spotify subscription, while Apple Music is the second most popular streaming service with 30 percent of teens reporting an Apple Music subscription. Because Spotify has a free tier, it's still the most popular service overall, with 65 percent of teens using it. Apple TV+ is not popular with teens, and less than one percent say they watch Apple TV+ shows. Netflix and YouTube were most popular with 31 percent and 26 percent of teens reporting usage, respectively.
Approximately 31 percent of teens own a virtual reality device, but most of those have an Oculus (25 percent). Just one percent of teens have an Apple Vision Pro, which is not a surprise given the price of Apple's device. Of teens that have a VR device, 60 percent said that they seldom use it, with just four percent reporting being a frequent daily user.
Piper Sandler surveyed 6,455 teens across 43 states for the spring 2025 report.
This data was collected in the spring of last year.
I found the above in my archives. Ownership in 2010 was about 18%, 2015 it was 66% and 2025 it was 88%. The saturation at 88% (for both ownership and intent) was achieved relatively quickly but most importantly, it remains steady.
Now consider that the teens of 2007 are having kids of their own. A 15 year old in 2007 is now 34 and a 19 year old is now 38 and some have a teen of their own.
At 19 years, the iPhone brand has transitioned across one generation with not only resilience but with deeper entrenchment. This cannot be said for other contemporary technologies, e.g. social media. While elders use Facebook the young have moved on. Perhaps to Instagram (25-34, 76% 18-29) or perhaps to TikTok (16-24) which has the strongest position for younger, Gen Z users.
Here are some additional data points on predisposition for social media:
Facebook (25-49): Largest group is 25-34 (31.1%), but also high usage among 30-49 year olds. LinkedIn (30-49): Professional focus, ideal for B2B and adults 30-49. YouTube (18-64+): Broad, with the highest usage (93%) in the 18-29 bracket. Pinterest (30-49): Popular with older, female audiences.
There is quite a lot of divergence and only YouTube seems to be fairly steady across age groups.
Moreover, as the Piper Sandler survey suggests, Apple Services is not the same as the iPhone. The adoption of Music and TV are not a broad-based and that has a lot to do with disposable income. The mechanism for adoption should be the family plan whereby teens are automatically enrolled through their parents in to Music and TV+. After all, teen iPhones are likely purchased by parents. That services bundling is where Apple must focus its effort.
In the latest, (Fiscal Q3, Calendar Q2 2025) conference call, Tim Cook made a welcome announcement: "We also recently marked a significant milestone. We shipped the 3 billionth iPhone since its launch in 2007."
This was welcome because the company has not been providing iPhone unit shipment numbers since Q4 2018. What it has meant is that the number of iPhones sold and their average selling price had to be estimated. Active iPhones were occasionally provided but quite rarely.
With this update, the veil has been party lifted. I, as well as you I'm sure, rushed to assess how well we have been estimating the iPhone economy over the last seven years. Prior to Tim's data dump, my own estimate for total iPhone shipments was 3.104 billion, including the last quarter. [Keep in mind that the 3 billionth iPhone may have shipped in the beginning of the quarter which amounts to more than 50 million units prior to announcement so my error of 104 million is minus perhaps 50 million.]
In the worst case, my error amounts to about 3.4% over the entire lifespan and perhaps 5% over the estimate period. That is perhaps not criminal since, after all, what's 100 million iPhones between friends?
I adjusted the estimated average selling price to reflect this error and shaved essentially one quarter's worth of shipments from the data set. In other words, my estimate would have been that 3 billion was reached in March rather than June. Mea culpa.
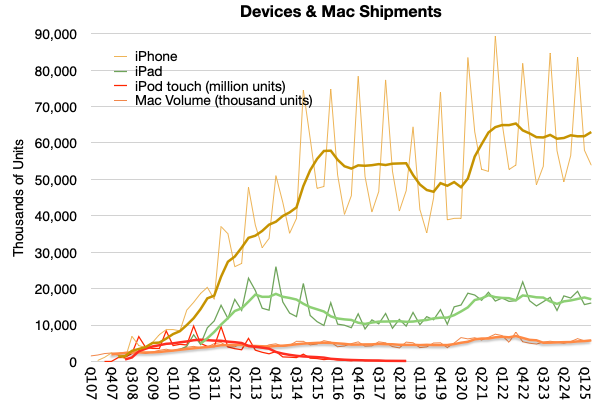
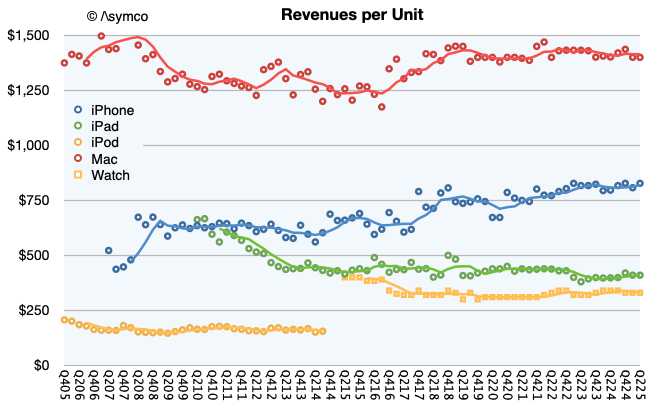
The new view into the entire iPhone shipment history is shown below. Also below is the impact of adjustment in the revenue per unit (i.e. average selling price.)
Note that I used trend lines to show the four-period (12 months) running average to remove the seasonality. Perhaps there is something to be read in the pattern. I would say that there are some notable surges as during the initial uptake, during the first "supercycle" in 2014, the surge during Covid and perhaps the "China recession" of 2018.
Clearly we are not at the highest sales levels today, as the Covid surge will take some time to grow into but at the same time the volumes are not decreasing. You can see the contrast to the iPod touch when an alternative was available, namely the iPad. The demise of the iPhone has been greatly exaggerated.
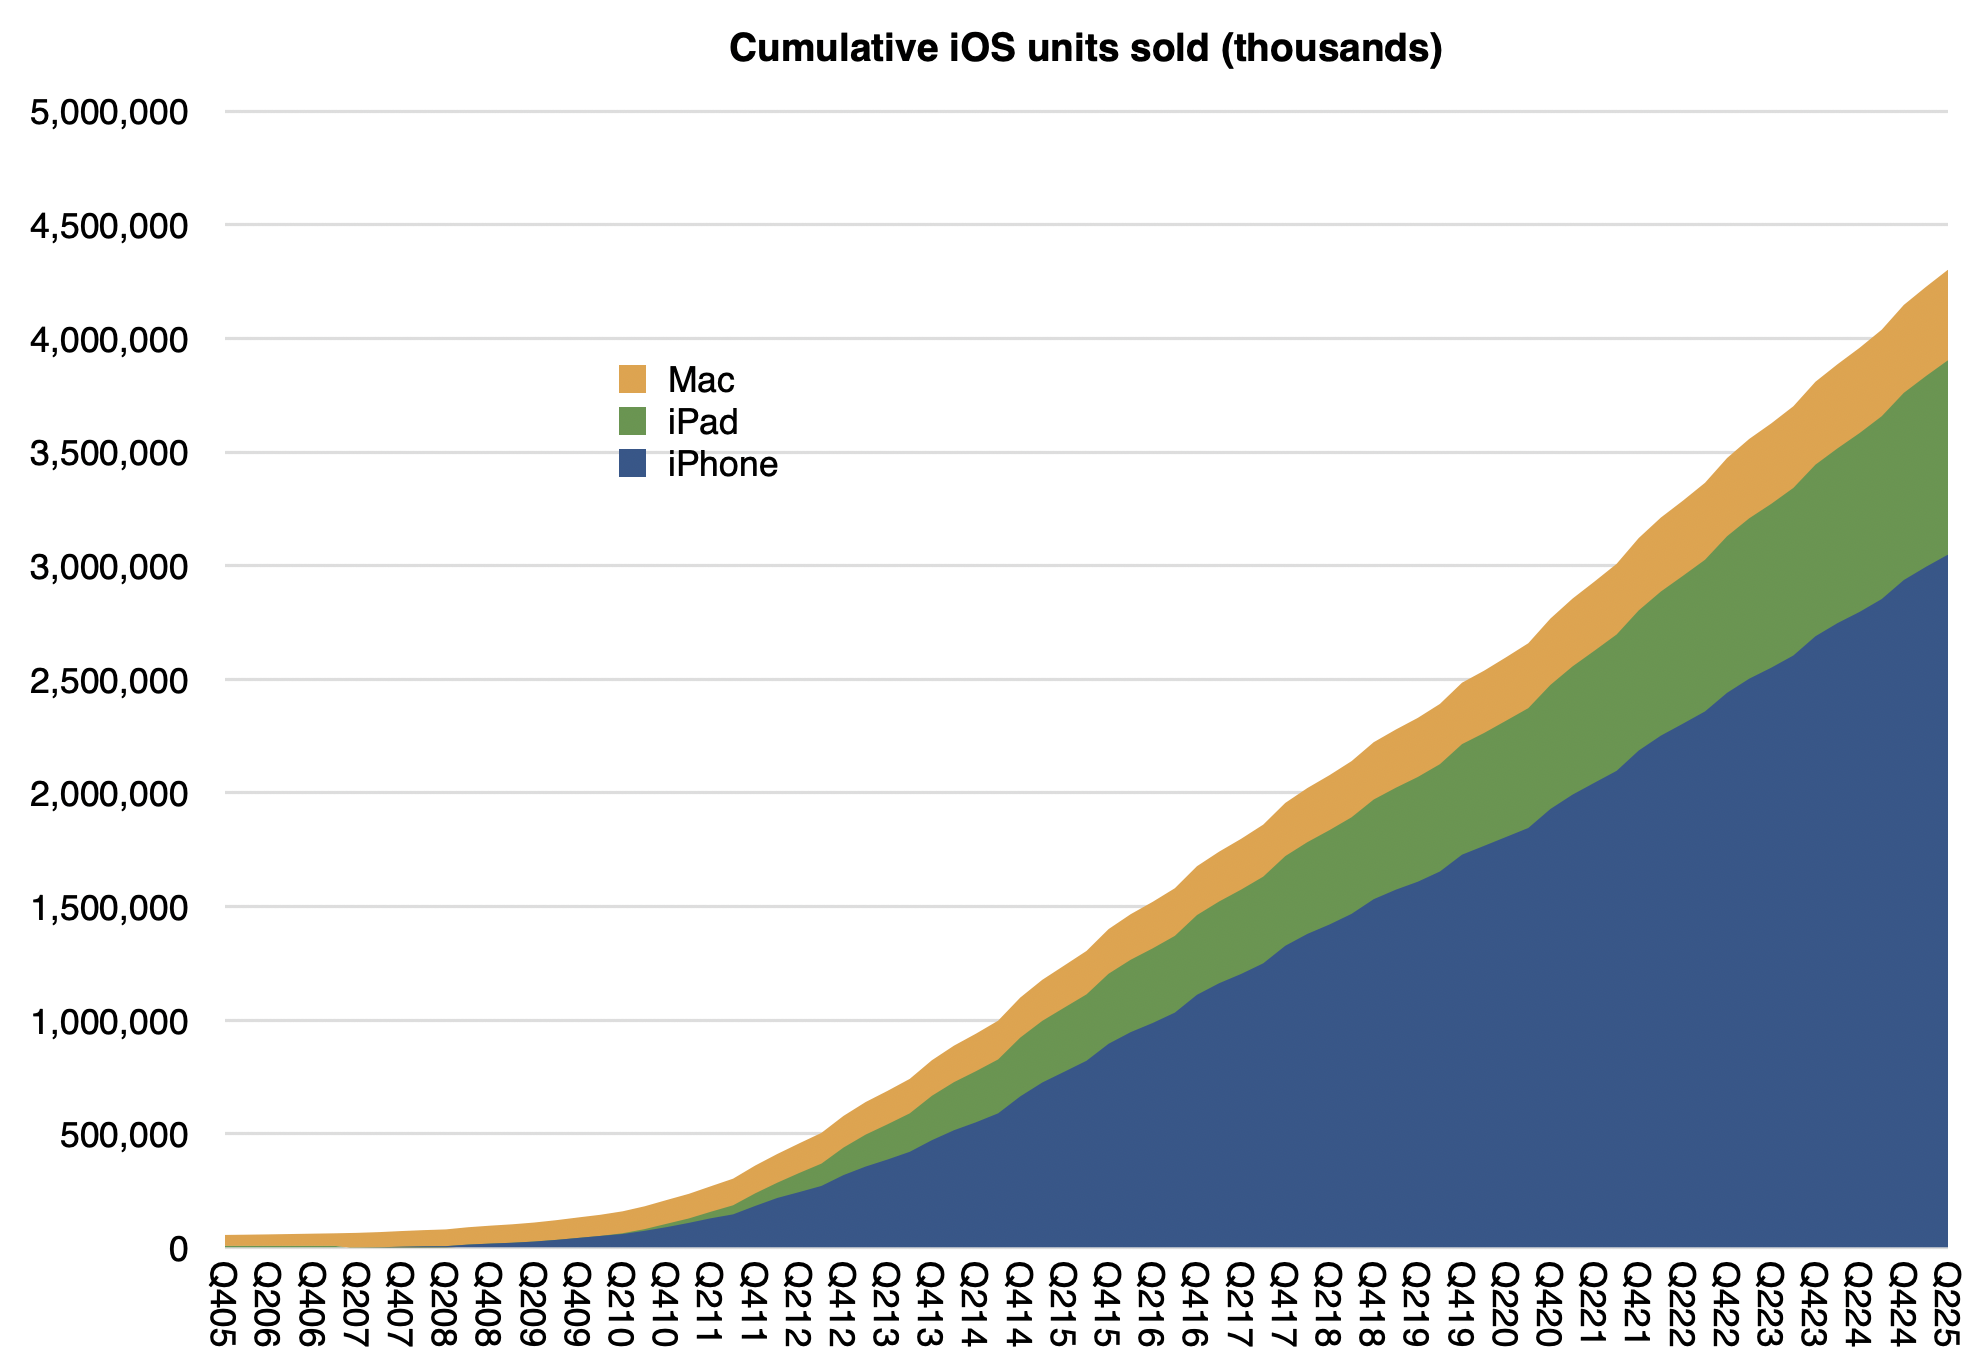
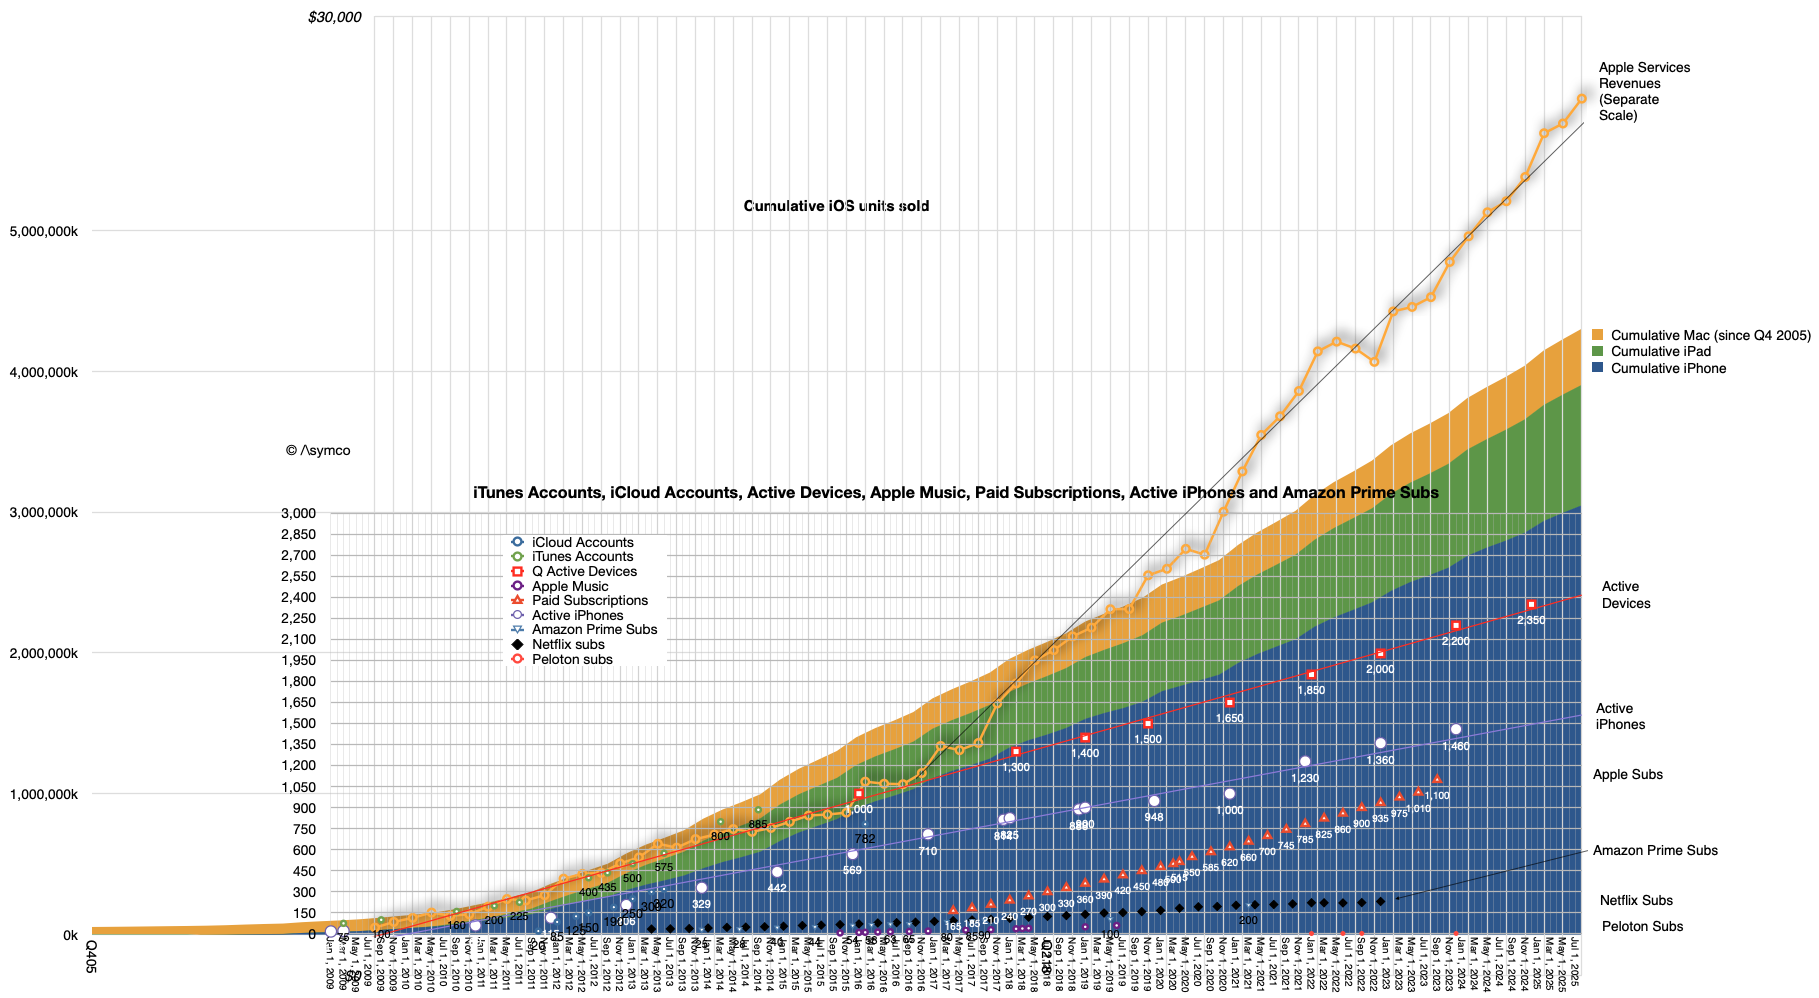
Note also that I also included the iPad, Mac and the iPod touch for comparison. You can try your hand at reading the patterns there. For the record, my cumulative Mac estimate (since Q4 2005) is 398 million[1] and the cumulative iPad is 855 million. Here are the iPhone, iPad and Mac cumulatively with a current total of about 4.3 billion:
Not shown are iPods (touch alone is about 114 million), Watches (probably at least 250 million) and Vision Pro (single digit millions) or wearables and home. If we did include those, it's a safe bet that Apple has shipped over 5 billion devices.
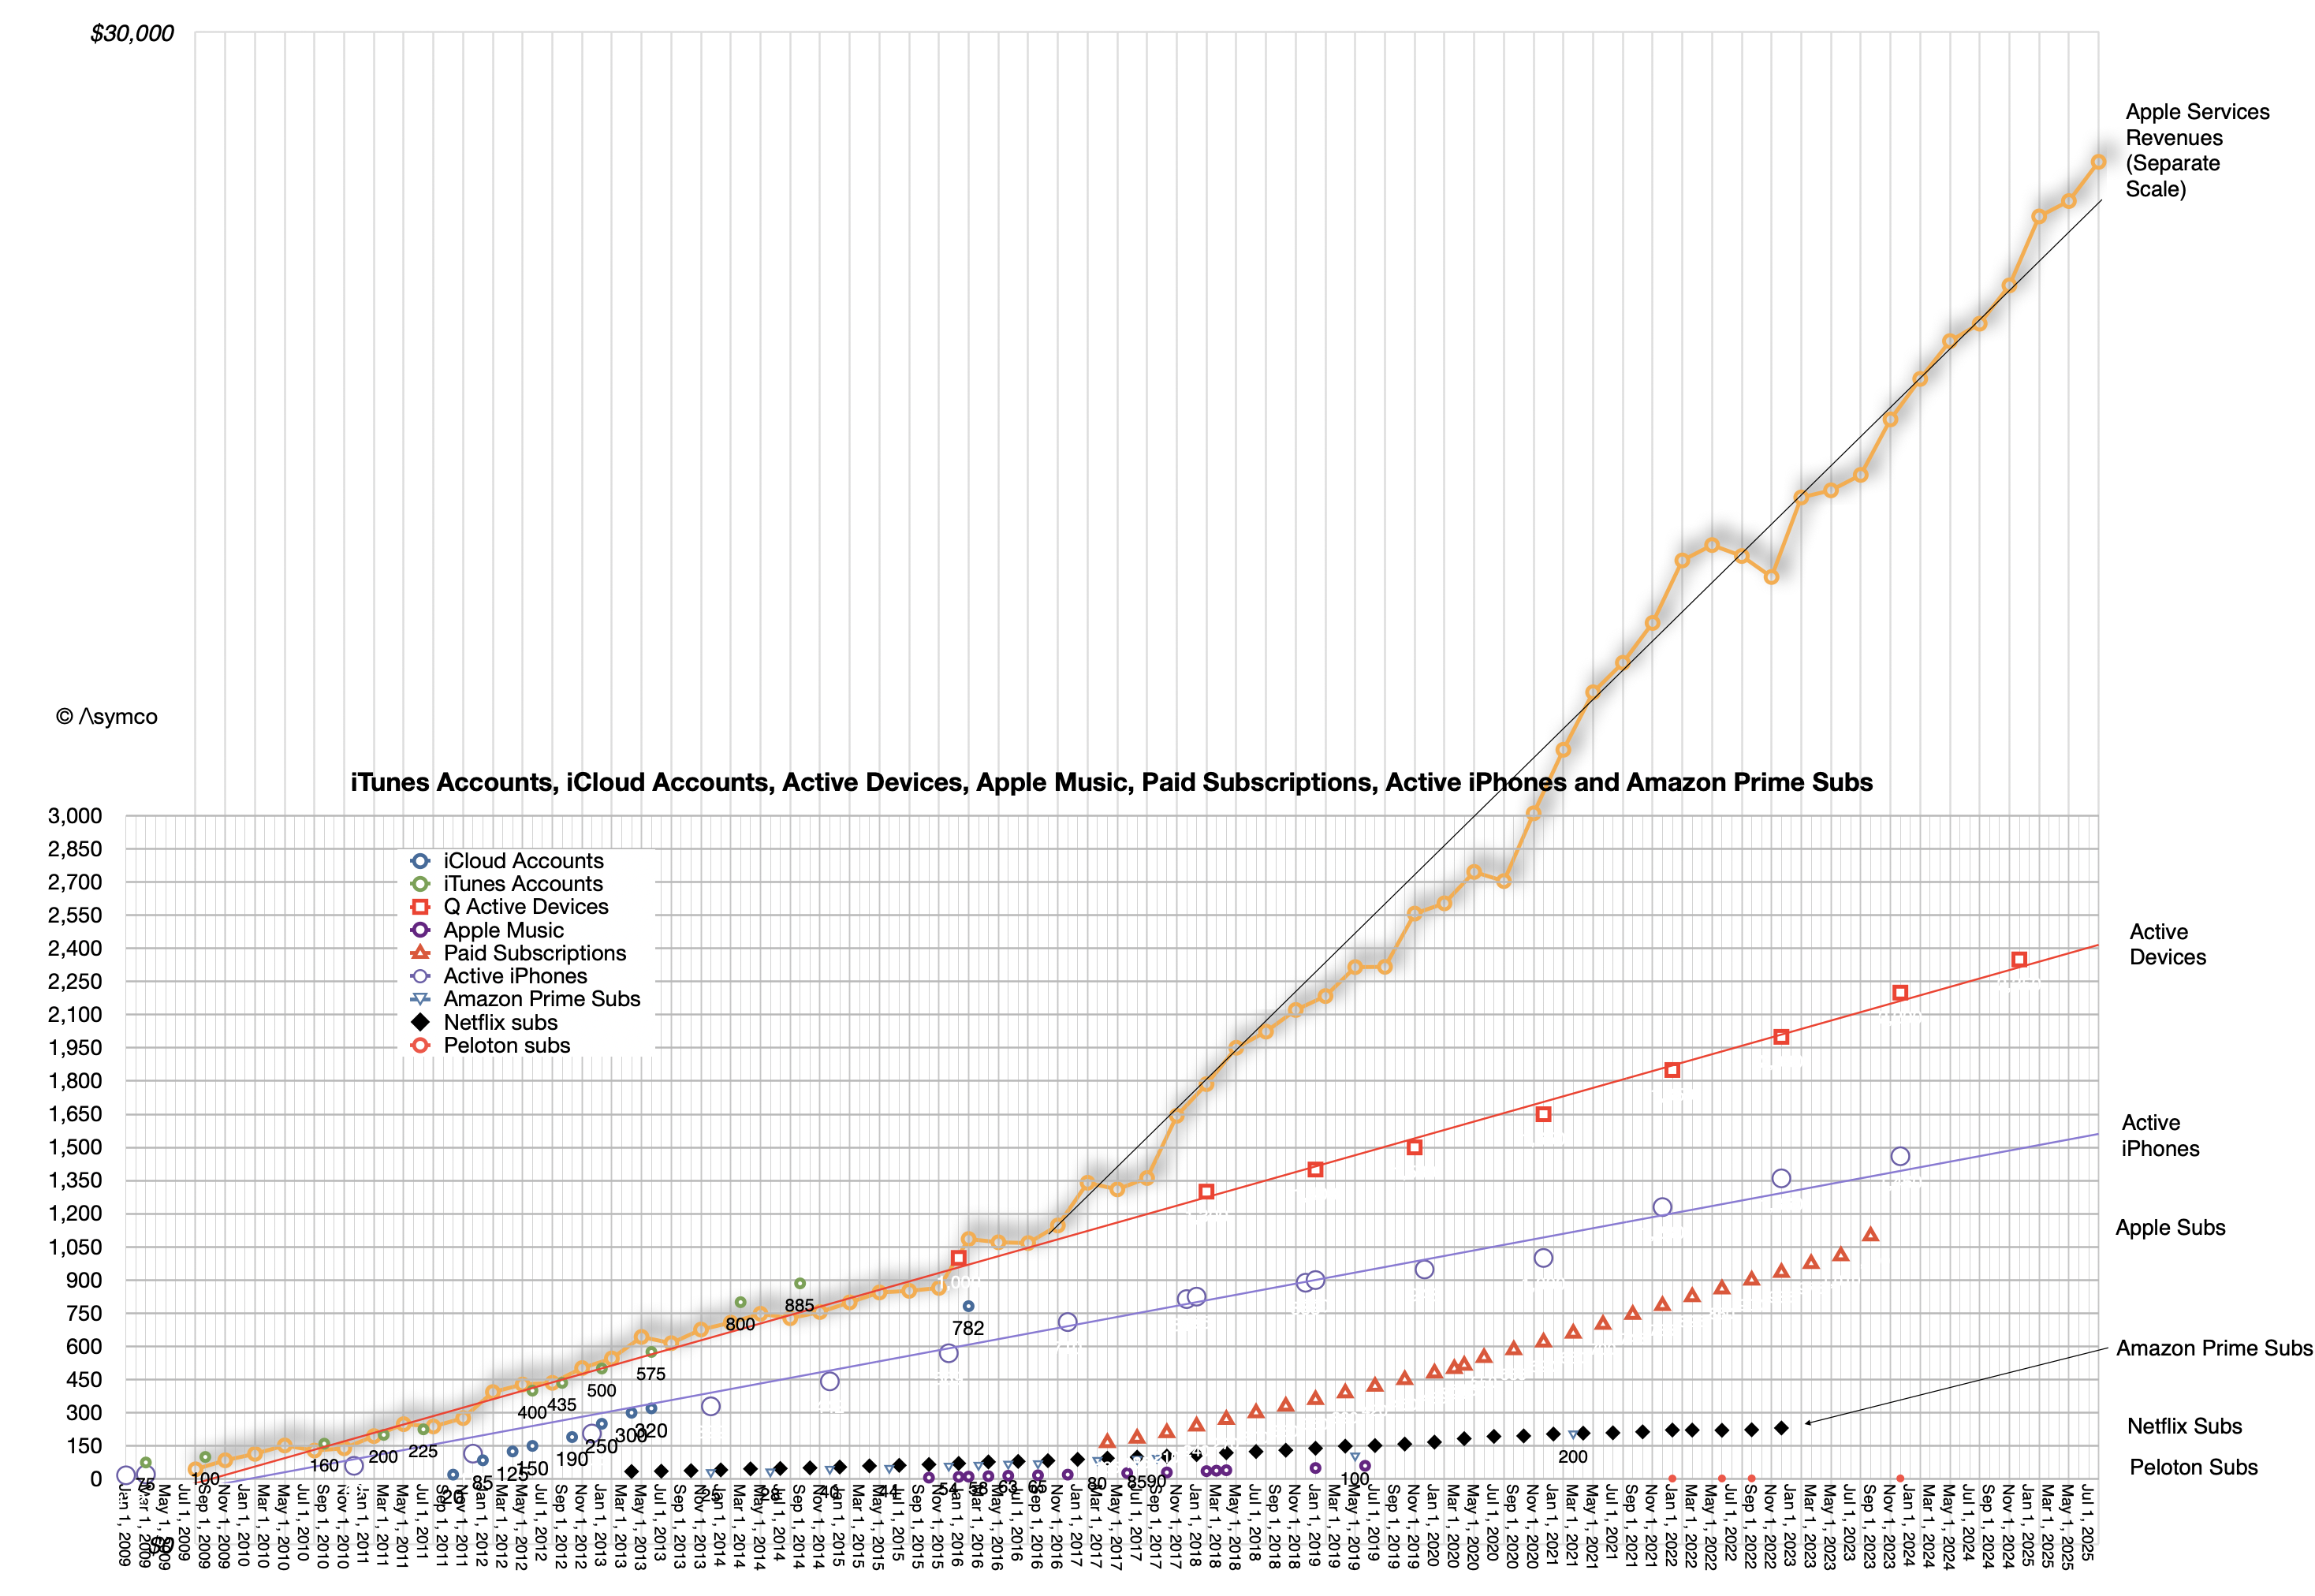
Interesting, but not as interesting as how many are active (in use at least once a month.) For that estimate we have another set of data:
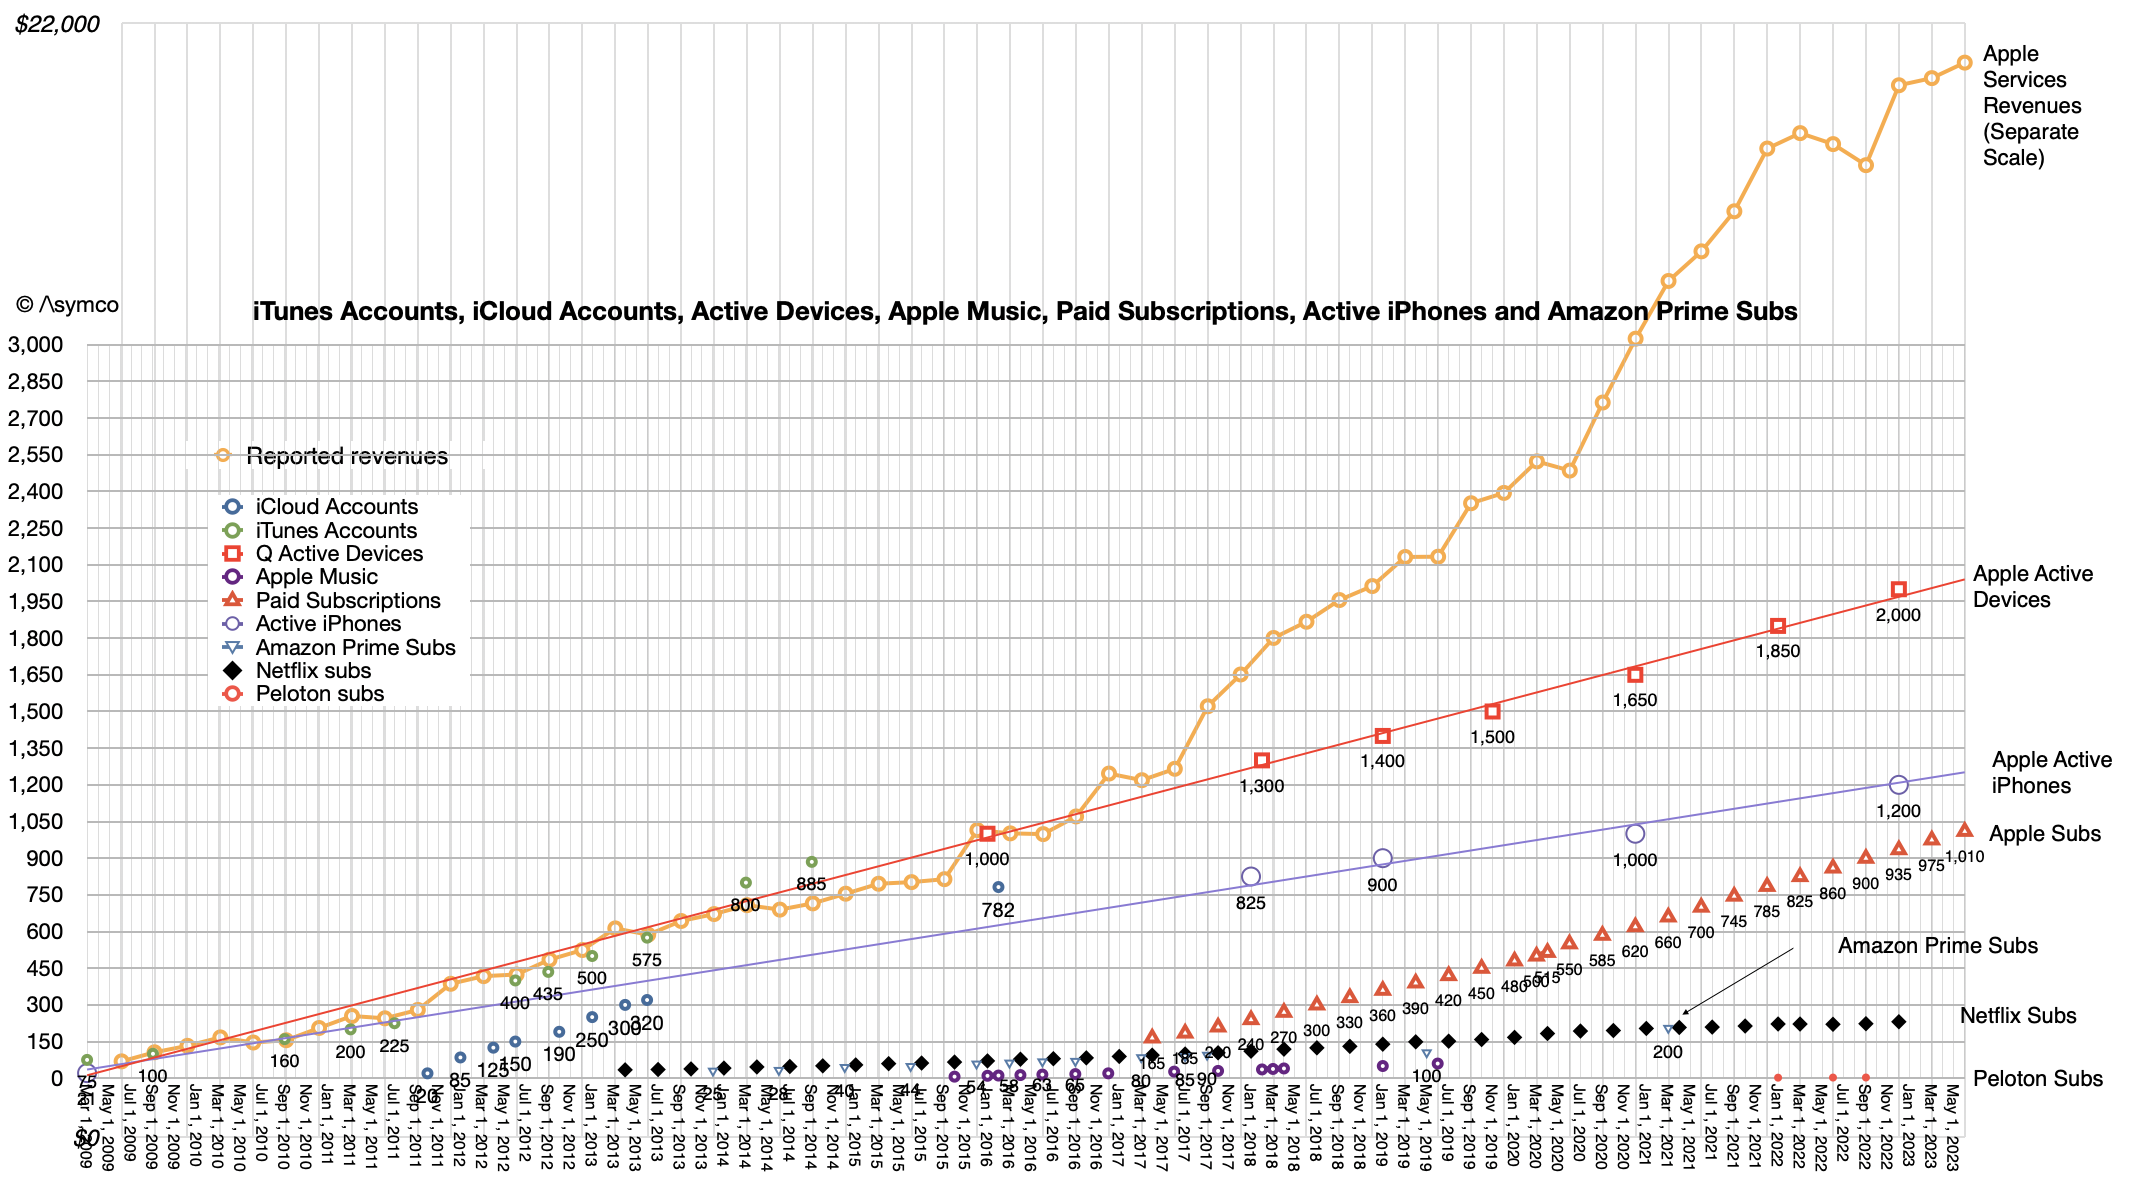
The linear extrapolations for active devices, active iPhone and, on a separate scale, actual Apple Services revenues can be seen. Also subscriptions, as long as they were available, plus other data sets for comparison such as Amazon Prime subscriptions, Netfilx and old Apple Music and iCloud account data.
At the risk of overloading an already busy graph, it might be interesting to show cumulative devices vs. active devices:
The top of the area graph seems to be not too different than the top of the red dotted device line. What might be instructive is to calculate the ratio between these two: the active devices and the cumulative devices during the period from 2016 (when 1 billion active were reported) and the beginning of this year when the last figure was reported (2.35 billion active devices on Jan. 30 2025).
Again, excluding wearables, iPod touch, Apple TV and Apple Vision Pro we have these ratios:
Date
Ratio of Active devices to Cumulative iPhone, iPad and Mac sold
Q417
0.66
Q418
0.63
Q419
0.60
Q420
0.60
Q421
0.59
Q422
0.58
Q423
0.58
Q424
0.57
What this suggests therefore is yet another way to forecast the value of Apple as an enterprise. We already know that the prediction of active devices, revenue per device and margin is sufficient to forecast the company's earnings. These all seem to be quite linear and thus predictable. Now we can add the relationship to devices sold as yet another way to calibrate or test assumptions.
After diligently doing so, simply multiplying the results by a random number called the P/E ratio (aka "sentiment") allows you to predict the share price at any point in the future.
Have fun.
It would be interesting to consider that if, as it's been often claimed by Apple, half of Mac users and half of iPad users are new to the products, then there would be 200 million new Mac users and perhaps 400 million iPad users.
According to JP Morgan analyst Samik Chatterjee, citing Sensor Tower, Apple's App Store revenue for May 2025, increased by 4.9% month-over-month (which compares to an average sequential increase of 2.3%) and an acceleration of year-over-year revenue to 13.0% in May versus up 11.8% in April. On a year-over-year basis, the App Store downloads increased by 3.1% in May (versus +5.8% in April) according to Chatterjee.
This analysis is based on app download sampling and may be indicative of the activities of consumers on the App Store. Services revenue in the first calendar quarter was $26.6 billion, up 12% year-over-year and at an all-time revenue record. Services gross margin was 75.7%, up 70 basis points sequentially, also an all-time record.
The world however seems to be having a problem with Apple Services. After years of skepticism of its relevance, now that it has achieved a run level above $100 billion/yr., it's being criticized for being harmful to competition.
The comments that it's unfair to developers or that it deters innovation are uninformed to say the least. What is missing from that analysis is that the App Store is only a small fraction of the entire ecosystem around Apple's platforms and that the economic activity the platforms enable is immense.
Let's learn.
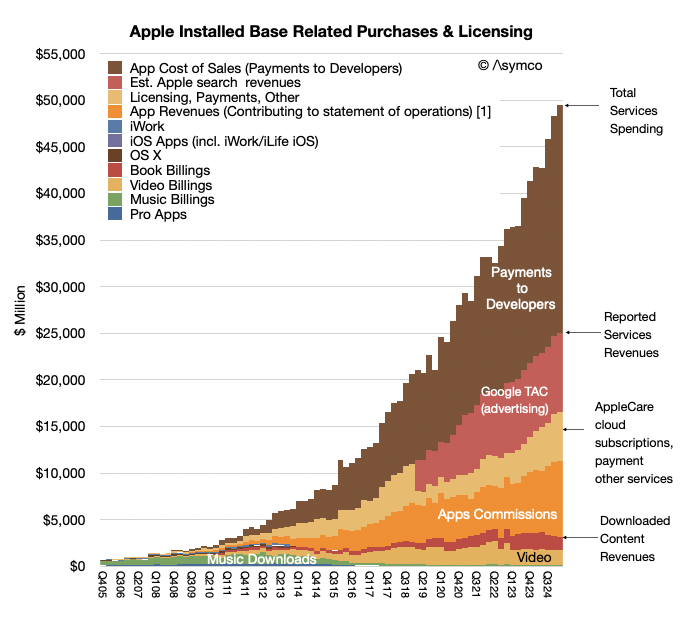
Over the last year Apple reported a bit more than $102 billion in revenues for Services at a very high margin. The reason it was such a high margin was partly due to the fact the Services does book all payments from customers through the App store as revenues. In other words it does not include payments to developers as either revenue or costs. Those payments pass through but they are certainly part of the economic activity on the store. It would be indeed unusual for a physical store not to report what it pays for what it sells as part of revenues. But this is the basis Apple chose (or was obligated to choose) as the way to report App Store revenues.
Thus considering the payments to developers, the economic activity directly related to the App Store amounts to $120 billion/yr which includes commissions of about $30 billion/yr (last 12 months) and payments to developers of about $90 billion/yr (implying about 25% blended average commission rate.)
So including payments to developers the Services business grosses $186 billion/yr. of which 102 billion is reported as revenue, with the 75% gross margin and $90 billion is paid to developers "off the books".
But that $102 billion in revenues is only about 30% App Store commissions. The rest includes many types of income: It includes:
Advertising which consists of Apple's own advertising services and third-party licensing arrangements notably the distribution fees for Google search (accounting for most of Googles "TAC" or traffic acquisition costs.
AppleCare, Apple's own extended warranty service.
Cloud Services which provide content synchronization.
Digital Content which not only includes the App Store but also stores for books, music, video, games and podcasts. Apple also offers digital content through subscription-based services, frequently bundled, including Apple Arcade, essentially a game subscription service; Apple Fitness, a personalized fitness service; Apple Music, which offers music streaming and on-demand radio stations; Apple News, a subscription news and magazine service; and Apple TV, which offers exclusive original content produced by Apple and live sports access licensed sometimes exclusively by Apple.
Payment Services which offers Apple Card, a co-branded credit card, and Apple Pay, a cashless payment service.
The quarterly view is summarized in the graph above. So a fixation on the commission is only a view into 16% of Services as an economic foundation (the orange area in the graph above).
But that's still only a sliver of the whole picture.
A report written by Jessica Burley, Analysis Group and Professor Andrey Fradkin, Boston University Questrom School of Business has estimated that the global App Store ecosystem facilitated $1.3 trillion in developer billings and sales in 2024. As the report writers say: "For more than 90% of the billings and sales facilitated by the App Store ecosystem, developers did not pay any commission to Apple."
How is this not visible? The reason is that this economic activity is distributed over the millions of purchases Apple users make through its iOS Apps every day. This includes traditional App Store "Billings" including paid downloads and in-app purchases, including subscriptions, that use Apple’s in-app purchase system and “Sales” which includes money spent by customers purchasing goods and services in general using any iOS and iPad OS apps. Apps developed by Apple such as Apple Music, Safari or browser apps such as Chrome are excluded from this analysis.
The economic activity unleashed by the App Store now reaches well over $1.3 trillion/yr. As the authors further explain,
While the present analysis captures the major app monetization strategies available to developers, the full economic impact of the App Store ecosystem extends beyond the estimates provided in this report, as the current methodology does not capture all of the ways in which the App Store ecosystem facilitates sales, or all of the benefits created by apps. For example, the App Store supports “companion apps” that raise the value of a company’s goods and services, including smart home apps and health apps. In addition, many apps now use different monetization strategies. As such, this analysis does not account for all the ways in which the App Store ecosystem creates value.
Furthermore the report breaks down the categories as Digital Goods and Services, Physical Goods and Services, M-Commerce (General Retail, Travel, Food Delivery and Pickup, Grocery, Ride Hailing), Digital Payment and In-App Advertising.
In addition the report estimates these categories from 2019 as well as 2024 providing a growth perspective: Over the past five years, the App Store ecosystem has more than doubled in size, increasing from $514 billion in 2019 to nearly $1.3 trillion in 2024.
It also identifies regional dynamics between the US, China, Europe (with select countries) and Rest of World (with select Asian countries).
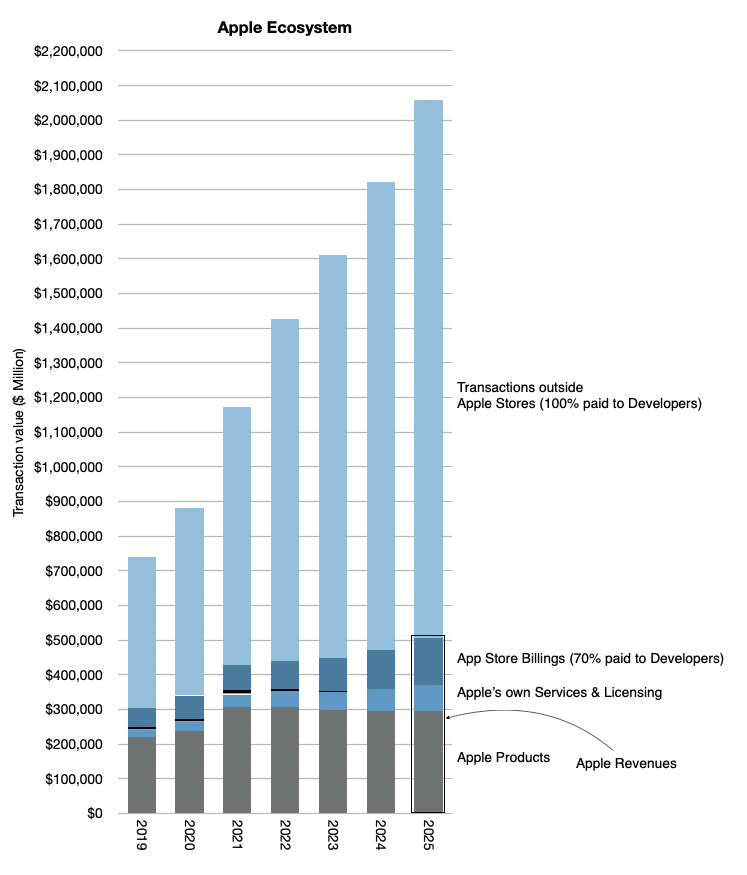
I've been keeping my own analysis of what I called the Apple Economy and it includes these transactions outside the App Store and Apple's own products and services. If I were to subtract Apple's own revenues from the total, for 2024 I was getting about 1.4 trillion (out of a total of over 1.8 trillion).
My point was always to estimate the economic impact of Apple beyond its own sales. This gave us perspective to assume that in 2025 the total would reach over $2 trillion. The graph below gives the perspective which also implies a doubling since 2020 to 2024.
The new report from Burley and Fradkin is a detailed, bottom-up analysis which quantifies what was perceived as the economic value of Apple being far more than what the financial data records.
Bill Gates once stated in reference to Zuckerberg's assertion that Meta was developing a "platform" that it's not a platform unless the economic value of everybody that uses it exceeds the value of the company that creates it.
Apple captures about $30 billion as sales but delivers over $1.3 trillion in sales, a multiple of 43! I would call that generous. In addition it doubles the market in 4 to 5 years. I'd call that market expanding not constraining. Finally, it's a market that Apple created out of nothing. I'd call that market creation not destruction.
If judged on the question of creation and satisfaction of the customer, i.e. the ultimate purpose of the firm, the App Store and Services in general has satisfied 1.4 billion people. That they are spending over $1.3 trillion and doubling in 4 years is nothing short of astonishing.
We'll discuss this topic and other topics related to Apple at ACTIVE: The Apple Investor Conference, which takes place on next Tuesday, June 10th, the day after the WWDC25 keynote.
In Google and Apple: The Beginning, we looked at the history of the relationship and the situation which emerged when Mobile Computing rose to such a level of ubiquity that it determined the fate of both companies. Apple today holds firmly in its grasp about 27% of all smartphone users (1.3 billion out of about 4.8 billion). That audience consists of the top quartile of users in terms of income, access to credit, consumption and loyalty. I performed a deep dive on newly available data which confirms that App Store users individually spend more than 7 times Play Store users.
Apple has over 1 billion customers but also they're the best billion.
For this reason, Google has needed to ensure that it maintains access to Apple users for its main business: search. Just like any developer looking at iOS and Android ecosystems, Google knows that Apple's customers are highly desirable, profitable and loyal. Apple had to remain a distribution partner for Google.
How to do that? Google distributors are incentivized with what Google calls TAC or traffic acquisition costs. This is how Google describes TAC in its 10Q filings:
TAC includes: ◦ Amounts paid to our distribution partners who make available our search access points and services. Our distribution partners include browser providers, mobile carriers, original equipment manufacturers, and software developers. ◦ Amounts paid to Google Network partners primarily for ads displayed on their properties.
Apple belongs to the first category, a distribution partner that is both a browser provider and OEM. These costs are part of Google's "Cost of revenues" or Cost of Sales. These are costs that are proportional to sales and are usually measured as a percent of sales. The higher the sales, the higher the costs.
So the question that has been hovering over both companies for a long time is just how much is the portion of TAC allocated to Apple? Consequently, how much does Apple receive in such payments? This is a relevant figure as it affects the degree of co-dependency but also of relative profitability of each business. Apple gaining highly profitable commissions for access to its customers and Google getting highly profitable search terms from those same customers.
Here's what we know: Google reports its overall TAC total as part of its cost of revenues and Apple reports its overall Services revenues and margins as a separate segment. Google also reports TAC as a cost against its Advertising segment revenues.
In the last quarter TAC was $12.6 billion, a 21.2% cost against an Advertising total of about $59.4 billion. Apple reports Services top line only without sub-segments so we don't know how much of that TAC it receives. Services for Apple includes many elements including licensing, AppleCare, cloud subscriptions, digital content, third party subscriptions, apps, payment, advertising and other services. Some of these elements can be estimated as we have some historic data. Apps in particular can be teased out as we have developer payment data.
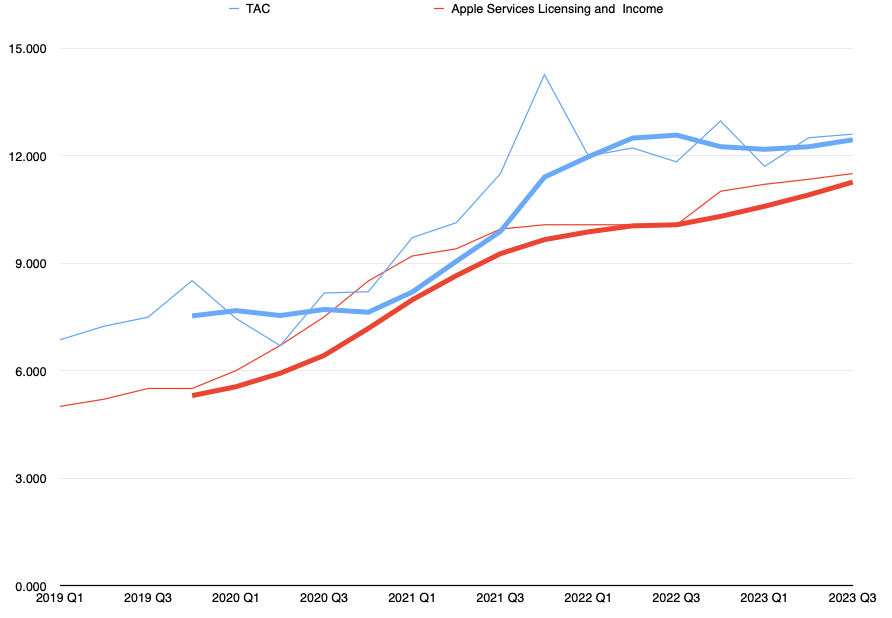
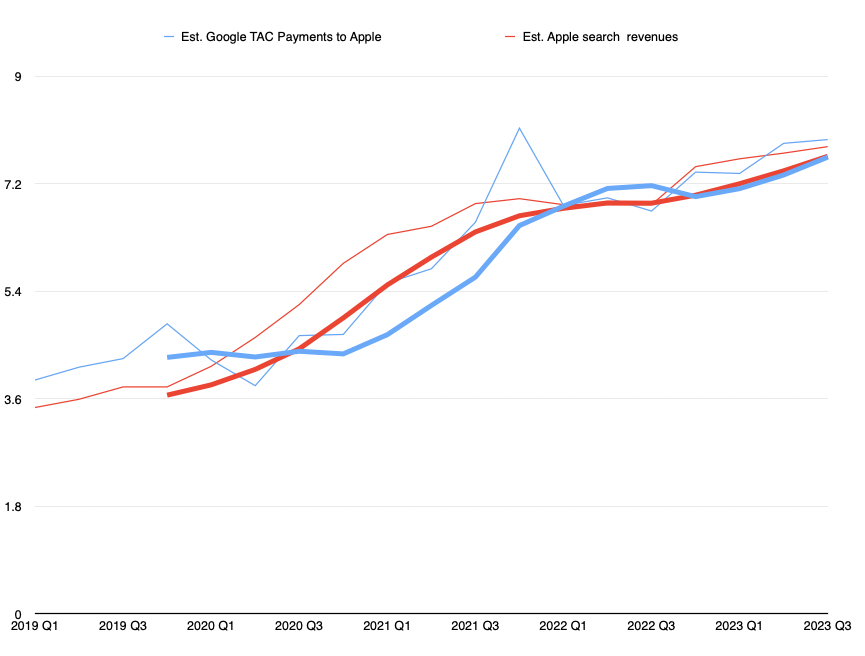
I've been estimating what would be Apple's TAC+cloud+payments as a bundle over the years. Looking at this figure vs. what Google reports as TAC yields this graph:
The thin lines are the actual data and the thick lines are 4 period averages. Apple is red, Google is Blue.
What this shows is that Google TAC is fairly well correlated to what Apple receives and that there is a gap of some degree. What is needed is an estimate of the percent of TAC that goes to Apple and a percent of Apple Services that matches it. Two variables but one equation.
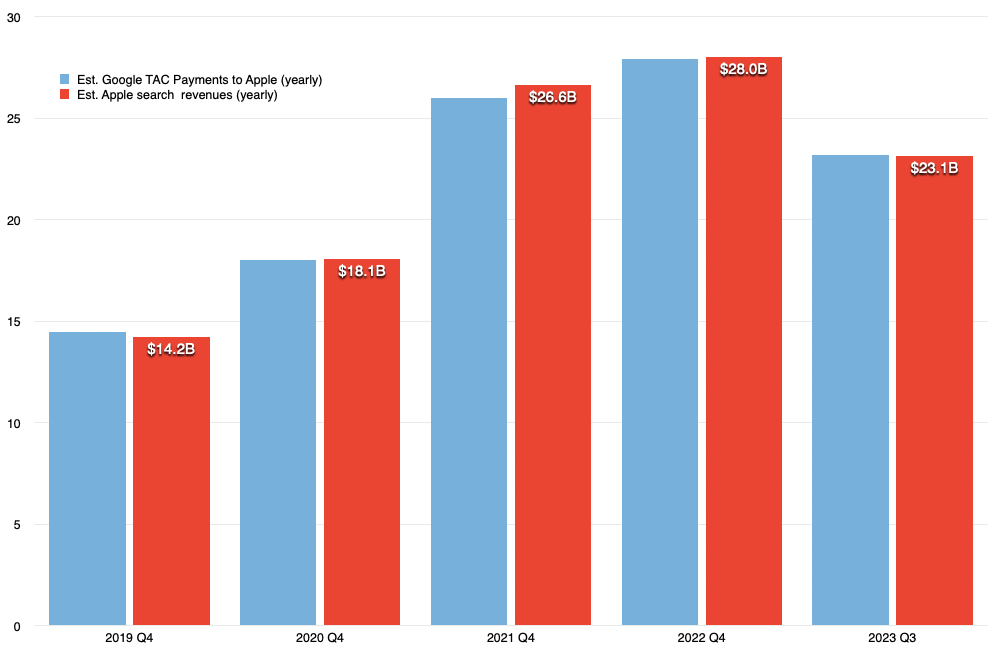
After some iteration through some constraints (which would be laborious to explicate but I can reveal at the next live event) I built the following estimate:
Though not matching identically, the yearly totals are pretty close to each other. The resulting yearly payments are
2019: $14.2 billion
2020: $18 billion
2021: $26 billion
2022: $28 billion
2023 (first 3 quarters): $23 billion
I would say this might be an upper bound for the estimate but not too far from reality. Most estimates to date have been far lower and I don't think they are accurate.
To stress test this I ran several sanity tests including comparing the revenue per user for Apple users and for non-Apple users and checking the sensitivity of services gross margins to TAC total.
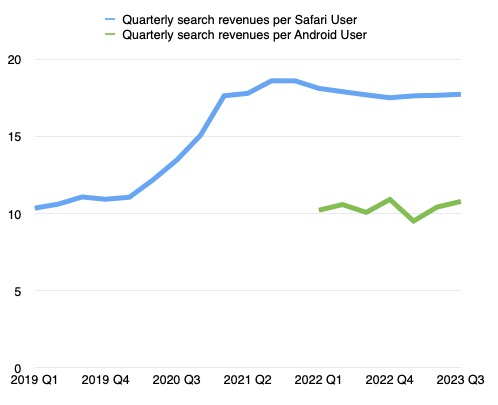
I'll just expand a bit on the revenue per user implications. We can calculate the revenues per user since we know that, according to Google's CEO, Apple receives 36% commission on search. Having the figures above, we can estimate the search income attributed to Apple and, by subtraction, the same for non-Apple. Then we can divide by the install base of each.
This shows that the deal could very well be indexed on the number of users with a specific value attached to each per quarter/month/day as these figures are fairly stable. The figure at this time shows that Apple users are valued at about $17.7/quarter or 19c/day while non-Apple users are around $10/quarter or 11c/day.
It also shows that Apple got "a raise" during 2021, increasing the amount it gets paid per user by about 60%.
It also suggests that Apple users generate about 37% of all of Google's advertising revenue, disproportionately as it's from a 27% user base market share.
None of these conclusions should seem surprising or extraordinary. If anything, they suggest that Apple is providing Google with bargain access to its customers. I suspect that Apple users are more valuable than a ratio of 2:1 in search. The app (and content and device ASP) economics are far more lopsided.
Apple is most certainly also very well aware of this and yet has maintained relatively modest pressure on Google in terms of pricing for access. There might be good reasons of which we are not aware of but as the antitrust pressure grows, so might Apple's interest in getting a better deal.
In the next installment of this series we will look into just how much better this deal can get.
The data is finally out. Apple Services and perhaps Apple itself can be quantified and predicted as never before. As we shall see this data changes almost everything we know.
It is even more shocking that this most important data set has been released by Apple itself. (Though it did so in order to comply with regulation, Apple did offer a bit more detail than was required.)
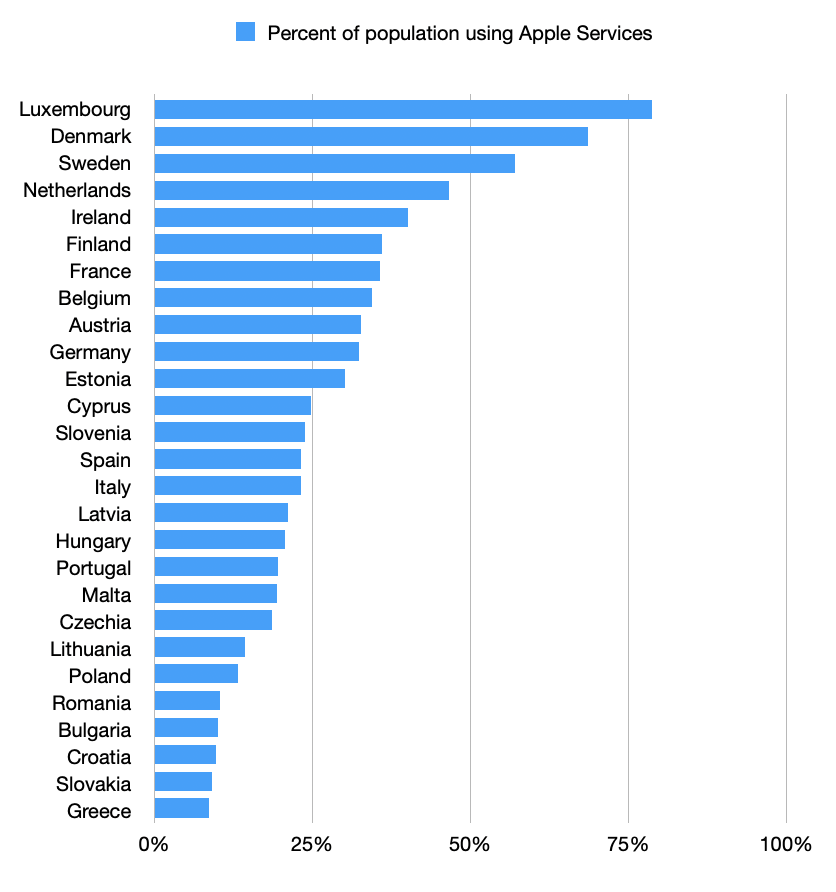
What the data shows is the number of average monthly active recipients in the EU of Apple-provided data services, calculated as an average over the period of the six months to 31 July 2023. This number is 123 million.
In addition, if you follow the link, you can see the number of recipients broken down by Member States. I summarize this data below.
Note that my summary is not that of the absolute numbers of recipients but the percent of population that these numbers represent. Note further that for some of the states with less than 1 million total recipients, estimates had to be generated. These were done in order to complete a total of 123 million. You'll have to trust me that these estimates make sense.
This release of data might be amusing for the ranking we obtain, showing which countries' citizens are more likely Apple fans than others. Seeing, for example, that the nordic countries show more affinity for Apple than the balkans; whatever that implies.
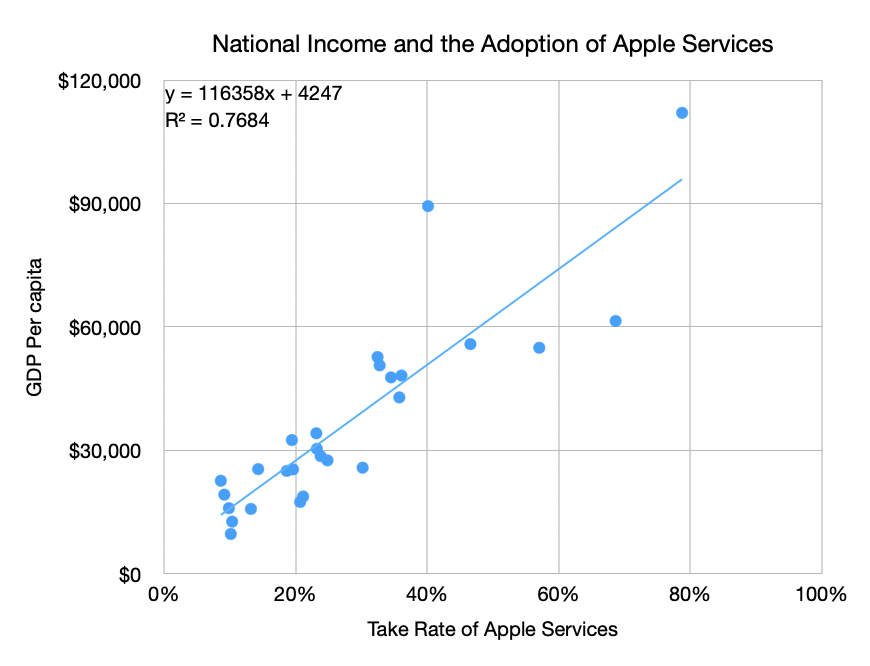
But a geographic categorization is banal. What would be more interesting is to look for a proxy for Apple adoption that is predictive. I know what you're thinking: it's obvious, look at income. More precisely GDP per capita. The data yields the following.
Please keep in mind that some countries might have missing or outdated data, and the values presented here are based on information available up to 2021. Note that there is one outlier. That data point around $90,000 and 40% adoption is Ireland. It's an outlier because the GDP income for Ireland includes the large number of multinational firms based there. That includes Apple, Facebook, Google and LinkedIn, etc. which pull GDP above what would be assumed by GNP.
With Ireland the data fits with the coefficient r-squared of 0.77. Without Ireland it's 0.85. This seems good enough to me to estimate the relationship of Apple Adoption ~= (National Income - 4247)/116,358. The trend line in the graph above shows this relationship.
What are the implications?
First, the ends of the line need to be finessed. 100% Apple Adoption is suggested at income of $116,358/yr/capita. Also, 0% Apple Adoption happens below an income of $4,247/yr/capita. Now both of these are problematic as there are known adopters in countries with income below $4,247/yr (more about this later) and there are countries with income above $116,358 which cannot therefore have more than 100% adoption (or can they? This makes a good trivia question.)
These anomalies should encourage us to look further. What if we apply this formula for countries outside the EU? To answer this, I generated a country set with about 190 entries and applied the pattern seen within the EU country set (n = 27.)
Knowing the GDP per capita for all countries as well as population size, we can estimate the global total of Apple services subscribers to be 560 million individuals. Note that Apple reports 1,010 million total subscriptions but that includes multiple subscriptions per subscriber and subscriptions to services which for Apple only acts as guarantor through the Apple App Store. Overall data on Apple Subscriptions (and other details) is provided below:
Note that we know the total active devices to be over 2 billion and the active iPhones to be about 1.2 billion. This implies that about half of iPhone users have an Apple-owned subscription and that over half of the subscriptions Apple manages are for its own services.
What's more, we can obtain a detailed list of expected Apple Services users for each country. An example would be 5.8 million users in Mexico or 1.7 million in New Zealand. [I could furnish this on a country-level in a newsletter, if anybody is interested please let me know.]
It also allows us to understand the potential for countries which currently are below the model's threshold of income. That list consists of 88 countries with a combined population of over 4 billion. They will join the Apple ecosystem, it's only a matter of time. Can we predict this? I believe so. Stay tuned.
The story of Apple Services is only getting more important but also more detailed in terms of data and analysis. Readers of this blog have been well prepared for what happened and Apple has followed through with gross margin data and now with some limited country-level data.
As we move into the era of spatial computing, services will only matter more and it's imperative that observers of the company stay on top of the data with solid modeling.
Almost a year ago, on March 1st, 2021, I tweeted a snapshot of the "FAANG" P/E ratios. They were:
Netflix: 88.63
Amazon: 73.94
Microsoft: 34.65
Google: 34.75
Apple: 32.89
Facebook: 25.53
Today same companies have the following ratios:
Netflix: 19.34
Amazon: 46.08
Microsoft: 30.17
Google: 22.35
Apple: 27.79
Facebook: 13.67
What a difference 13 months makes. Microsoft and Apple saw modest falls 13% to 16%. Amazon, Google and Facebook saw large falls in their ratios: 38%, 36% and 48%. Facebook (now renamed pitifully as "Meta") in particular saw its valuation collapse by half! This is largely because in February the company forecasted lower than expected revenue growth in the next quarter, blaming privacy changes in iOS, macroeconomic challenges, and the market finally realizing that it's an evil and despicable company.
Microsoft and Apple grew their businesses nicely and have been resilient post-Covid. They are now revenue-reliable "blue chip" tech companies with large user bases that encompass high value, loyal customers. Google and Amazon are a bit more precarious given exposure to macro conditions and unclear new market opportunities but Amazon is still sporting a very healthy 46 ratio which is largely due to its investment-heavy approach to cash flow.
But the star of the show, the real blockbuster, is Netflix. It fell from P/E of 88 to P/E of 19. Even six months ago the P/E was close to 70. What happened?
Remember that P/E is an indication of growth potential. A P/E of 19 implies that the equity should be priced at 19 times last year's earnings, which are roughly indicative of profit in a year and thus P/E is a time horizon: how many years would I wait before I got my investment capital back (and thus break-even).
Well, one could say that a P/E of 13 or 19 (FB or NFLX) is pretty reasonable. It's reasonable to pay that many years' profit for a company. The large ratios only make sense if a company is growing rapidly. 20% to 30% growth can justify P/E of above 20. But what would justify a P/E of 88?
The market has always given Netflix high valuation because it was growing and when the growth stopped the P/E fell to a more reasonable level. Unfortunately that means the share price had to fall over 70% from its peak. More than 40% in two days. Tragic.
The stock peaked at $700 in October and is $221 now. Why were investors betting on high growth, just a few months ago?
I think it was because investors like movies. And the Internet. Investors like movies and the Internet.
Netflix was never a great business. The logic evolved from sending movies as DVDs by email, ordered through an online catalog, to having the same selection available for download (streaming). Everything was subscription-based so bundling gave movies a "binging" consumption option.
But this depended on the having access to good titles. The access was easy at first since Netflix was a new channel and it was a bonus for the movie publisher. Pure margin. But over time the movie publishers saw the new channel eating into existing distribution and they thought they could deliver it themselves, increasing margins. The catalogs were suddenly cut off.
Netflix responded bravely: they would make their own movies. Out came the checkbooks and the distributor became the producer.
Amazing.
But is that really a good business? You have to make movies which are very expensive. Some will be hits, some won't. You thus have to make a lot of them. And then you have diverse demand. People want to have all kinds of genres. So you have to make them all. And what's more you can't really market them as events because they are so numerous. It sounds really hit-and-miss with a huge risk.
At this point you have to raise pricing. And then came the competition who, like Disney, said "we have better, more targeted family content". Or Apple TV+ which simply said "we have better quality." Many other streamers offered alternatives like Amazon Prime with a smorgasbord approach. Sure, households could subscribe to all these services, but the bill would start to be painful. Not much savings over the cable bundle. Netflix increasing price sends many for the exits.
The company then drops a bomb: they feel they can't grow subscribers because they are "near saturation" and the families which are not yet paying are probably using "shared" passwords. It can only grow if it converts the non-payers.
That all happened rather quickly. The market loves movies and the internet and who doesn't. It's just that movies and the internet don't make a great business.
Movies look to be more of a feature of an internet service bundle. That's Apple's approach. They don't see video as a business but as hygiene: must-have something to put in a bundle.
So Netflix, who first unbundled the neighborhood video store, then bundled production and distribution was itself not much more than a substitutable piece of a bigger bundle.
For this reason I always wondered why there was an "N" in FAANG. Netflix always seemed more a transient idea: yes people like movies, as they like music and books and magazines. And producing and distributing media has undergone dramatic change with computing and internet. But a business that only produces and distributes a single media type may be an ok business but should it be put on the same level as platform companies with billions of users?
Netflix has 200 million subs but that is not a big number. Apple distributes 785 million subscriptions to over 1 billion customers. Google has at least 2 billion users, Microsoft about 1.5 billion and Meta is over 3 billion. Netflix says it can't get many more and indeed they forecast losing 2 million next quarter.
It's a bit sad, but reminiscent of the games industry: it has its limits and the limits mean that it can't be seen as a ubiquitous and hence maximally valuable asset.