Thanks to a reader for asking this question: "Wouldn’t it be more telling to look at the monthly rate of downloads / device at any given time?"
Yes it would.
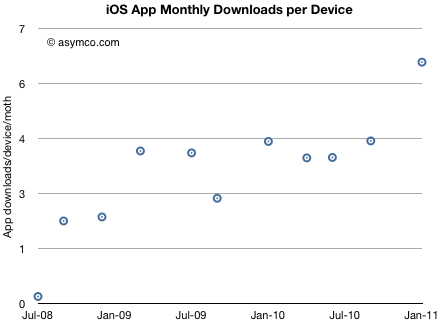
Here's what can be derived based on download rates and installed base of devices.
Please note that I am assuming that the number of devices put out of use is negligible. In defense of this, I would argue that the vast majority of iOS devices sold are still serviceable and are re-sold. However, the estimate should be rounded down.
The data shows that there's been a slight trend upward in download rate/user but it's been fairly steady.
The implications are interesting: if you know the number of iOS devices in use, you can determine the app economy turnover with reasonable accuracy. If you also know app ASP, you know sales, and even margin.
Conversely, if you know the app download rate you can derive the device installed base.
So in September I looked forward to an iOS user base of 500 million. It could be reached by 2013. Assuming each user downloads 5 apps per month that would mean 2.5 billion downloads per month.
We believe that we're on the face of the Earth to make great products, and that's not changing.
We're constantly focusing on innovating.
We believe in the simple, not the complex.
We believe that we need to own and control the primary technologies behind the products we make, and participate only in markets where we can make a significant contribution.
We believe in saying no to thousands of projects so that we can really focus on the few that are truly important and meaningful to us.
We believe in deep collaboration and cross-pollination of our groups, which allow us to innovate in a way that others cannot.
And frankly, we don't settle for anything less than excellence in every group in the company, and we have the self-honesty to admit when we're wrong and the courage to change.
And I think, regardless of who is in what job, those values are so embedded in this company that Apple will do extremely well.
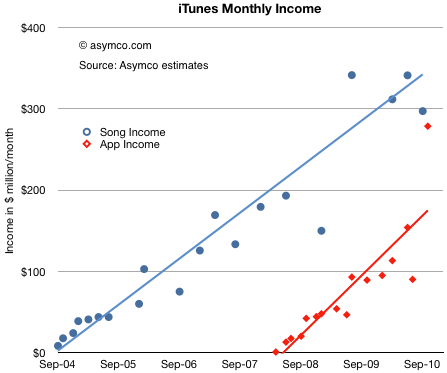
After reviewing the payments to suppliers, we can look at the store's revenue generation rate. With the same assumptions, we have the following chart:
We will have to wait for another report to see whether the recent burst of volume from apps is sustained[1], but the trend shows income from apps narrowing the gap to music. In the last few months apps may have been generating $300 million/month[2].
The blue line above can be interpreted as an arrow aimed at the music industry. We know how that turned out. The red line above can also be interpreted as an arrow aimed at the gaming industry. What are the chances it will play out the same way?
According to NPD, U.S. retail sales of new physical video game content, which includes portable, console and PC game software, generated revenues of $10.1 billion in 2010. That's $840 million per month. A big number compared to the app business. The trouble is that the figure is going down (-5% from the year before).
If you look at the red line above and its slope, it would indicate that, given time, the App store will overtake the entire physical media gaming industry. The time when that happens will depend a lot on the growth or decline of the physical game media business, but another four years seems a safe bet.
Would this cause the same effect to the industry as digital music had when it replaced physical media? I would say yes. The main reason is that physical media has associated with it a different sales cycle and margin. These factors determine the processes and cost structures of incumbents. Such changes are very difficult to absorb and adapt to.
----
Notes:
App sales are highly seasonal as there is a burst of downloads post-holidays.
Apple reports iTunes income in financial reports. In the third quarter it reported $1.2 billion in revenues. This is roughly consistent with the data above given that the analysis excludes iBooks, Movie and TV Show sales and rentals.
The last analysis of the iTunes content store showed amazing acceleration in download rates. Since we know something about the pricing of apps in aggregate, we can make some guesses about the income from apps for both Apple and suppliers.
The key assumptions are:
Average selling price per app $0.29 (as reported in June 2010 here).
Price per song $.99 increasing to $1.05 over time
Music gross margin 10%
App gross margin 30%
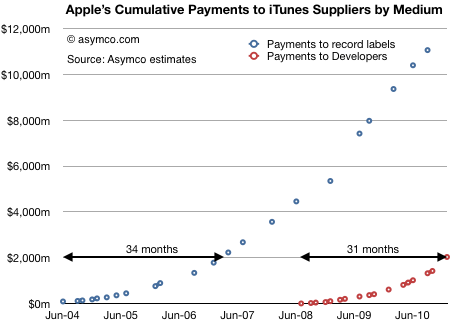
The first chart shows the accumulated payments made to suppliers of content to the iTunes store over time.
Although the music suppliers received in aggregate much more than developers, the iTunes store has been open much longer. When comparing sales acceleration, the App store is ramping faster having paid out $2 billion in 31 months vs. 34 months for the first $2 billion paid out for music.
My guess is that a follow-the-money analysis would show that apps as a medium will absorb talent and capital away from existing mediums and the industries they support.
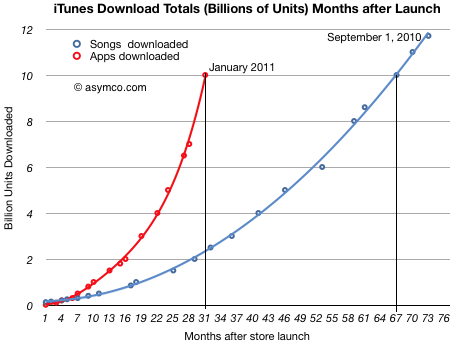
The iTunes App Store is about to reach 10 billion downloads. That makes this a good time to revisit app growth metrics and compare them with the other digital media store that we have data for: the iTunes Music Store.
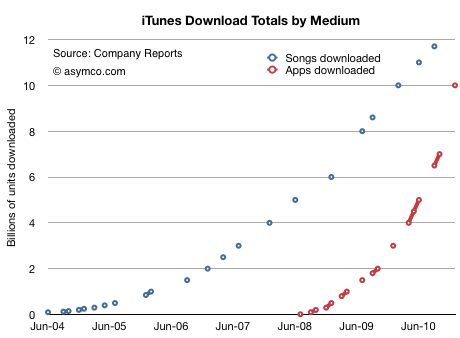
First, the download totals as time series[1]:
Assuming that 10 billion will be reached this month, we see how the steepness of the app curve implies that apps will overtake songs within a few months. I suspect by March.
In September I made the prediction that total apps would overtake total songs sold by the end of 2010. That has not yet happened, but it's close.
If we measure downloads as a function of the number of months since store launch, we can see that Apps reached 10 billion downloads in less than half the time it took songs (31 vs 67 months.)
I used polynomial curve fitting to draw the lines.
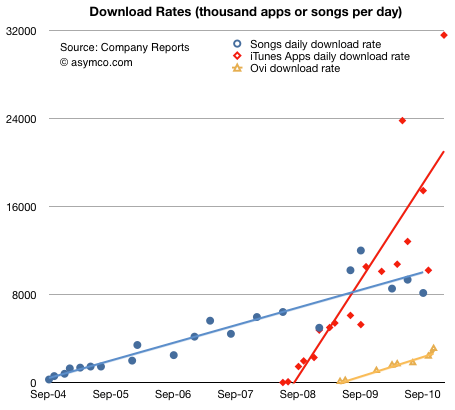
The other way to look at the data is by measuring the daily download rate. The data is more scattered, but the trend is still clear:
(The solid lines are linear trendlines. I added the known data from Nokia's Ovi for comparison.)
The amazing story of this chart is not that apps are running at above 30 million download per day, but that the figure is growing. Growth like this is hard to get one's mind around. Not only are downloads increasing, but the rate of increase is increasing.
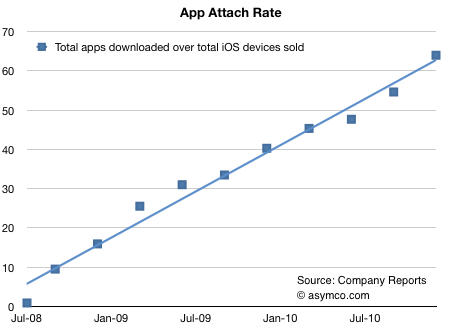
There is one final piece to put in place on this puzzle. Some might argue that the reason these download rates are increasing is because the installed base of devices is increasing at the same rate. In other words, app consumption could be steady on a per user basis.
To answer this we need to divide the cumulative apps downloaded by the cumulative devices sold. Using a reliable estimate for iPod touch units sold, we can get a pretty clear picture:
The number of apps downloaded for iPhone/iPad/iPod touch is running at more than 60[2].
In the fall of 2008, there were about 10 apps downloaded for every iPhone/iPod touch. Two years later the rate was more than five times higher. There are significant implications for the network effects related to the iOS platform. End user investment in apps is even higher than end user investment in music which created a very tight lock for iPod users.
I draw three conclusions:
Apps overtaking digital music is a watershed event. Apps are a new medium: they will impact all other media.
As the number of apps attached to any single device continues to increase, apps create increasingly higher switching costs for users.
Apps consumption is increasing at a rate to overtake the PC software market.
---
Notes:
The total apps does not include updates.
The attach rate is actually higher since the figures above assume all devices are still in use.
And so we come to the question of Chrome and H.264. First off, it should be clear that video codecs are infrastructural technology[1]. They are commodity algorithms which are generally invisible to users. They are ubiquitous and are "shared" in the sense that they are available for licensing often without much in terms of cost.
So they don't really offer strategic advantage to the adopter. Some may end up adding slightly more to a cost structure than others, but not in a way that determines strategy.
Flash on the other hand is not infrastructural. It is not shared, it is not invisible to users, it is a brand, it has a significant business model and market value. It is sustaining to Adobe.
So the argument I've heard against Google's decision is that they are using an infrastructural technology decision (a new video codec) to placate or sustain Adobe Flash, at the expense of Apple, a potential or perceived rival.
If this was the plan, it would be a strategic mistake.
The reason is that Flash will live or die on the basis of whether the business model is sustainable. That is decided by whether an integrated, proprietary technology is over-shooting and unable to adapt to a mobile computing future that demands modularity from components. If Flash is doomed, then its fate is inevitable.
In other words, you cannot use an infrastructural technology to defend a sustaining, possibly over-serving technology.
Which is why I don't think this was the motivation.
I rather think that Google's decision is a misguided emphasis on technical details in lieu of engaging in a deep strategic re-evaluation.
A RISCY BET
To illustrate the way technology companies fail by placing their strategy burden on technology decisions, here is how John Sculley made a decision to go with PowerPC and how he lived to regret it.
[Our best technologists] came back and they said it doesn’t make any difference which RISC architecture you pick, just pick the one that you think you can get the best business deal with. But don’t use CISC. CISC is complex instructions set. RISC is reduced instruction set.
So Intel lobbied heavily to get us to stay with them… (but) we went with IBM and Motorola with the PowerPC. And that was a terrible decision in hindsight.
...
we totally missed the boat. Intel would spend 11 billion dollars and evolve the Intel processor to do graphics… and it was a terrible technical decision. I wasn’t technically qualified, unfortunately, so I went along with the recommendation.
I would argue it wasn't a failure of technical knowledge--the technicians were right about the architectural advantages. It was a failure of strategy and understanding of innovation dynamics[2]. Sculley asked the wrong question. The question to be asked is not "CISC vs. RISC". Rather, it should have been: Is the architecture the relevant decision point or is it the choice of partner? The technologists put the architecture choice above the more strategically important question of whether Intel had the fuel to continue getting better even if saddled with sub-optimal architecture.
That decision sounds very similar to what is being done today at Google. Increasingly, technology decisions are leading strategy. The question should not be "H.264 vs. WebM" or "HTML5 vs. Flash". Google should be asking itself if mobile computing will allow browsing to remain the predominant interface for internet consumption. If, as I suspect, it won't then no amount of browser tweaking will help. The browser is already infrastructural. It can't be the object of strategic focus.
To get an idea of how this would work consider Flipboard. Flipboard turns the entire browsing paradigm inside-out. Instead of consuming social media inside a browser, the app presents it in a more natural magazine-like format.
What will happen when that media becomes predominantly video? Flipboard will be far more influential to content producers and their decision on which codecs to support will lead adoption.
By focusing on threats and byzantine standards machinations, rather than on broad, experiential learning, Google missed (yet another) next big thing.
---
Notes:
In IT does not matter. Nicholas Carr introduced the concept of infrastructural technologies. Becoming Infrastructural is what happens after a technology overshoots the market and stabilizes into a commoditized ubiquity. It ends up being "shared" in the sense of being openly and sometimes freely licensed.
To be fair to Sculley, the research on innovation theory that would have helped him had not yet been published.
Thanks to David Chu for forwarding the data that made this possible and reader Narajanan for spotting the divergence in platform efficiency.
iOS and Android are both growing rapidly. According to Gartner, during the first three quarters of 2010, about 44 million iOS devices and 36 million Android devices were put into use. That's 80 million devices. An amazing achievement for two platforms that did not exist 3 years earlier.
But obviously not all devices are used the same way. Devices which have unused capabilities limit network effects for a platform and for the category of product in general. Question is: how can we measure the "smartness" of a device; how much more likely is a device to be used as a mobile computer vs. being a regular phone?
The best proxy I can think of is a measurement of browsing use. The smarter the device, the more browsing is a joy and the more it is actually done. Browsing leads to more data load on the network and creates a virtuous circle of revenues for the mobile computing value chain.
If we could measure the increase in browsing generated by each additional phone, we could compare whether one platform is better (specifically, more efficient) at generating value asymmetric to voice.
Fortunately we have data from Netmarketshare.com (see sources below) which attempts to track browser consumption and hence allows us to measure this variable. What we need to pair that with is the incremental increase in the installed base of devices.
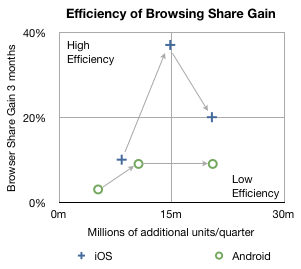
In the chart below I plotted how much browsing share increased for every phone sold by platform over the first three quarters of 2010.
The arrows indicate the sequence in time from Q1 to Q3. The vertical axis shows gain in share three months after the corresponding number of units shipped in the previous quarter on the horizontal axis. So, for example, the second circle means that in the second quarter approximately 10 million new Android devices created a gain of about 9% in browsing share. In the same quarter, 14.8 million iOS devices created about 37% gain in browsing share.
In the third quarter approximately the same number of iOS and Android devices shipped (iOS including iPads and iPod touch) but the browser gain was 20% for iOS vs. 9% for Android.
A line drawn diagonally from lower left to upper right (0,0 to 30m,40%) could represent the average gain in share per units sold--the sort of measure we're looking for.
Measuring that slope tells us that, on average, every million devices sold should generate a gain of 0.75% share[1]. I took the additional step of labeling two quadrants which are orthogonal to the expected trend. If browsing increases dramatically faster than 0.75%/million units then I call those devices sold as creating "highly efficient" browsing gain. If browsing increase lags dramatically below 0.75%/million units then those devices added share with "low efficiency".
So four data points follow the trendline down the middle of the chart, however, there are two notable outliers. Finding the causes for these outliers gives clues to what's happening with the platforms.
I believe the explanation for iOS's second quarter's extraordinary efficiency is that was the quarter when the iPad launched. It seems to have yielded a very strong spike and the trajectory of iOS improved even into the next quarter as those iPads continued to be in use. iPad seems to be a very effective way to gain browser share.
I also believe that the cause for Android's fall in efficiency in the third quarter was that it began to be sold in large quantities in the developing world. The third quarter saw a rapid acceleration of sales without a proportional increase in what was measured as sales in the US (and Europe).
Interpretation
If this trend continues, and there is no guarantee that it will, then a question could be raised about Android's value to, of all people, Google.
The core value of Android to Google is the increased use of browsing and hence search. All the other Google services and in-app ads are tiny opportunities in comparison to the potential of search on mobiles. One could argue that the raison d'être for Android since day one was to create browsing consumption. In that regard it's not as good at doing that as iOS is.
Perhaps Google can justify the under-performance of consumption of browsing (and hence search) on Android devices as benign since there is no marginal cost added to supplying Android to non-consuming devices.
But I wonder. There is the problem of opportunity cost: Those iOS devices that create more browsing activity are going to take more share. The more they do that the more Google will have to pay Apple for placement as the default search in mobile Safari.
It may be a stretch, and perhaps the data is wrong, but that's what this exercise is all about: how much can we learn from fragmentary data? Without a hypothesis there is no discovery.
-----
Notes:
Since these platforms have very low shares (less than 2% for iOS and 0.3% for Android by November) almost all the gains can be assumed to be against other browsers (e.g. Internet Explorer) and not against each other.
Update: the original Unit estimates excluded iPad and iPod touch which have since been added.
According to GfK data in Denmark, during the first quarter of 2010 29% of phones sold were smartphones. In the second quarter, the share grew to 37%. In the third quarter, 51% of units and 71% of sales value was captured by smartphones.
Looking at September alone, Apple's share of the smartphone market was 34%. In terms of value share, 51% of all the dollars that consumers spent for smartphones, was spent on the iPhone.
In other words, in September in Denmark, iPhone captured 34%*51% = 17% of all units and 51%*71% = 36% of all mobile phone sales.
Rob adds:
iPhone 4 is now available on all (4) major networks in Denmark. iPhone 4 has not been advertised very heavily, whilst Android has received a lot of advertising. My experience travelling on public transport in Greater Copenhagen is that iPhone is everywhere, whilst Android and Blackberry is less prevalent.
To get a sense of how that compares with the global average, in the third quarter Apple's unit share was only 4.1% while sales share comes to about 17%. Seems like there is plenty of room for growth.
While Denmark is a small country (population: about 5.5 million) and it's not likely to reflect global patterns, it has been rated the happiest place on Earth.
In a recent but recurring lament I asked why Apple shareholders are not being rewarded for the company's growth. I pointed out that there is no fundamental reason why the company should receive such a low P/E multiple (about 18 ex-cash trailing and 10x forward while maintaining 70% earnings growth for over a year).
There were many objections in the comments. Most of them dealt with recent reasons why doubts might have arisen among investors: Android hegemony or some perceived lack of competitiveness leading to margin compression or some macro hangover from the recession.
In this article I argue that none of these objections hold water. My argument hinges on the fact that there is a precise date when Apple ceased being seen as an exceptionally valuable company and that date precedes any of the causes being suggested.
The day of disillusionment was almost exactly three years ago: January 14th, 2008.
How to pin down the date of disillusionment
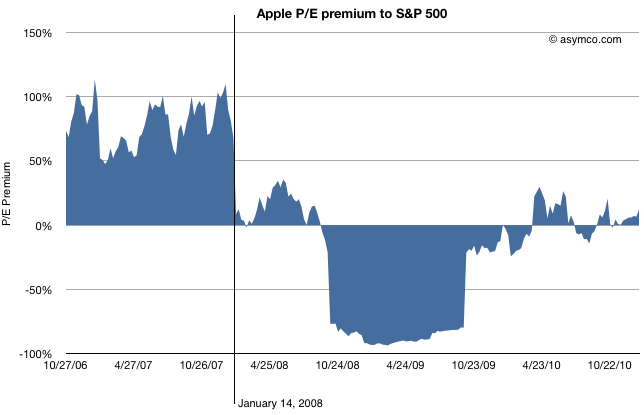
Consider the following chart.
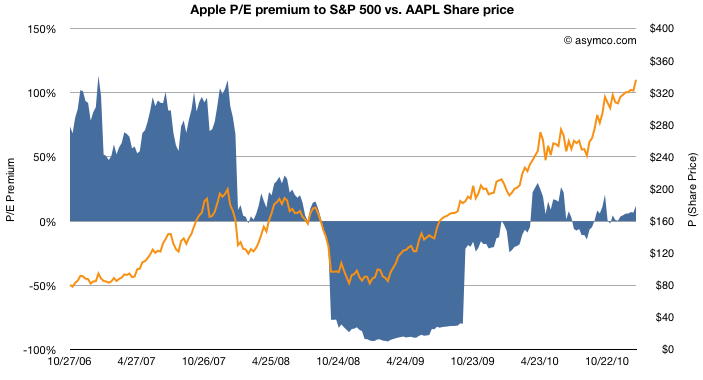
The blue area represents either a premium (above 0) or a deficit (below 0) of Apple's P/E (ex-cash) relative to the S&P 500 P/E. This is a re-imaging of a chart, first introduced in June 2010 when I first pointed out that Apple was being discounted relative to the S&P 500.
By measuring P/E I am focusing not on the stock price, which has grown nicely, but the ratio of the price relative to earnings, which hasn't (see the next chart below). P/E is a fundamental measure of potential (its reciprocal is the stock's earnings yield.) It is usually highly correlated to the company's growth. If that P/E is uncorrelated to past growth, there is some significant discounting of future growth. It's the most significant (and simplest) measure of "faith" in a company.
By measuring the company's P/E relative to an index of other large companies (S&P 500 P/E) we can assess whether the company's potential is being valued as extraordinary or whether it's being valued as ordinary. In other words we are measuring whether a company is "special".
The chart shows that until January 14th, 2008 the company was valued at a significant earnings premium--a P/E consistently 50% higher than the norm.[1]
Following the collapse (about 40% drop in share price but 100% drop in P/E premium), there was a small recovery followed by a huge trough in valuation. During the recession quarters Q308 to Q309 S&P earnings fell to zero or below. As a result of S&P earnings collapse the S&P P/E shot up astronomically (as E approaches zero, P/E approaches infinity). Apple's earnings dropped as well but remained positive throughout that period bottoming at 37% growth(!) in Q408. As a consequence Apple's P/E fell as low as 11 while the market's went well above 100 (122.41 peak). The P/E deficit for Apple went 80%: Apple was valued as basically worthless (3x cash).
After the earnings recession, the S&P P/E recovered close to historic levels but Apple's P/E did not. It's in-line with the S&P but does not obtain the 50% premium preceding the recession.
So we can establish that the day that Apple's potential was discounted was nearly six months before the onset of recession.
What other discounting factors can we discard?
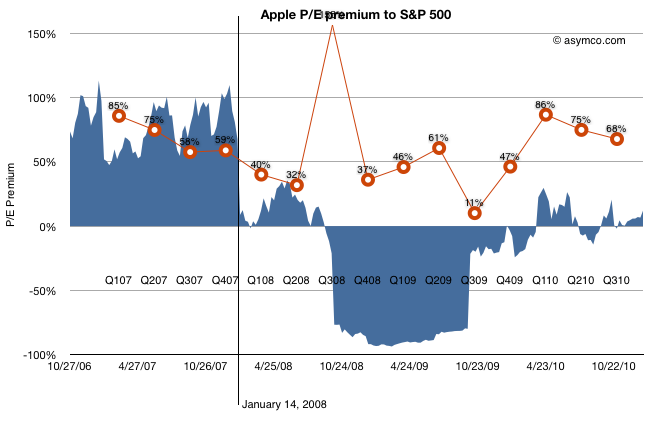
How about earnings growth itself? Did the collapse foretell an earnings collapse?
The chart above shows the P/E premium vs. earnings growth (in red). Although earnings growth began to slow soon after the 14th (earnings for CQ407 were not yet announced at that point), growth recovered six months later after the launch of the iPhone 3G[2]. Growth continued throughout 2009 and 2010 reaching new heights last year of 86%.
Still, the company received no premium to the S&P 500 P/E. Companies in the index averaged, at best, a quarter of Apple's growth in earnings.
What about Android? The first Android device did not ship until October 2008 (HTC Dream or T-Mobile G1). There were no appreciable Android volumes until 2009, one year after the drop in relative value and no talk of a threat until 18 months later.
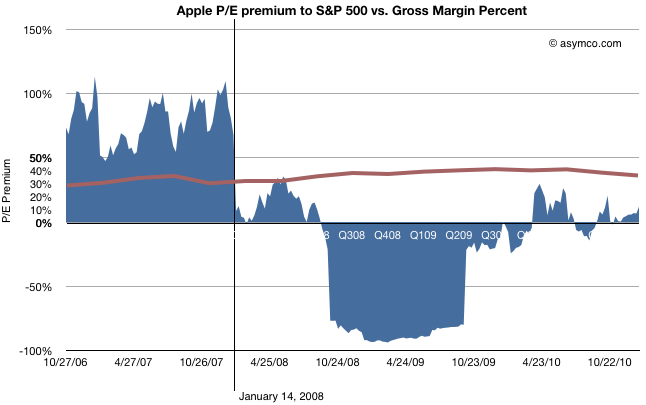
The last objection to be put aside is that of margin compression.
This last chart shows how margins (in brown) behaved during the same time period. They went up. The only slight decline took place during the last few quarters, after the launch of the iPad, long after the collapse.
Regardless of the adjustments with product launches, Apple's GM is the envy of the world and is not at all correlated with the loss of faith in the company.
So What happened on January 14, 2008?
Having led you this far in the story, I'm afraid I'm going to let you down at the end: The cause for the loss of faith is a mystery to me.
There is only one noteworthy event that took place on that date: Macworld 2008 (January 14-18). During the keynote, Steve Jobs introduced the Macbook Air (and Time Capsule and Leopard and pre-announced the iPhone SDK which, six months later led to the app supernova). I remember that day and I remember that the stock began selling off exactly at the point when the Air was mentioned. It has never been the same since.
Obviously, correlation is not causation. The Macbook Air need not be the cause for the loss of faith in Apple as an investment. Or can it? I'm hoping someone can explain this because to me it makes no sense. The product was not a home run but it did not do badly either and its current incarnation seems to be a hit. Whatever sins the original Air may have had have surely been expurgated by now.
Regardless the cause, the bottom line is that, in the eyes of investors, Apple stopped being "special" that day. Its valuation dropped to in-line the S&P and, given its growth, well below what a large growth company should be worth. The company's shares went into the bargain bin and are still there today.
---
[1] I should point out that the P/E ratio is based on post 2009 re-stated earnings. The restatement changed the P/E as the "E" changed. This was based on the abolition of subscription accounting for the iPhone. Although it may seem unfair to hold the market to this standard, restatement did not actually change cash flows which were transparent and visible to all, even to amateurs such as myself and the other unaffiliated analysts that published throughout this period. Earnings may be an opinion but cash flow is a fact. Valuation on the basis of cash flow should have yielded the same results as shown above.
[2] That quarter showed a y/y growth of 150% while the stock was in freefall. In fact, it was during that earnings day that Steve Jobs came on the conference call and pointed out the astronomic iPhone cash flow to an audience of analysts more concerned about their own jobs.
Given new information on subscriber growth and the relationship between Verizon and Apple, it's time to look back and assess how the conclusions are standing up.
The conclusions I drew were that Verizon had three strikes against them:
The iPhone has stolen their growth
They are facing the prospect of a single OS platform supplier
Android is not competitive vs. iOS
Did iPhone really hurt Verizon?
I pointed out that based on retail sampling data from ITG and what we know from AT&T own sales data, that iPhone at AT&T was outselling Android at Verizon by a ratio of 2.5 to 1.
The latest comScore data closely matches the assumed units of Android shipped by Verizon. Here's why: The comScore data shows the number of active users of each platform. So, for example, as the number of Android users at Verizon grew, it follows that the new users had to buy new Android phones. However, you can also sell more phones than just those for new users. Some phones are going to go to replace those of existing users.
When it comes to Android however, all the Verizon Android devices are pretty new, having been purchased less than a year ago. Replacements would only be sold for damaged or lost devices not covered by warranty.
So from comScore the change in subs at Verizon comes out to about 2.2 million and my original estimate was about 2 million. That's pretty close.
On the other hand, if you look at the chart, you'll notice that the number of iPhone users at AT&T grew by a similar amount (about 2 million). However, AT&T activated over 5 million. That means that about 3 million devices were upgrades. This makes a lot of sense since we know that iPhone is the bulk of AT&T smartphone users.
This is highly supportive evidence that iPhone at AT&T did indeed outsell Verizon Android by at least a factor of 2. Each of those phones came with a 2 year lock-in so indeed AT&T did manage to "steal" growth from Verizon.
Another data point in support of this conclusion was provided by Turley Muller in a comment. AT&T smartphones make up a significantly higher proportion of contract subs at 44% vs Verizon at 23%. Effectively, as a result of their sweetheart deal with Apple, AT&T got double the penetration of smartphones than Verizon since these devices are targeted only to contract subscribers. Those are high ARPU customers that either moved from regular voice plans or switched from other carriers.
So far, the first conclusion seems to be holding up pretty well.
Was Android a strategic constraint to Verizon?
Verizon revealed that they had been negotiating with Apple at least since 2008 and that they were testing the phone for a year. This is not as big a surprise as it may seem. Deals of this kind easily gestate for years. The commitment may not be made until the last minute.
Nevertheless, my point was about the fact that Android was making up to 75% of Verizon's smartphone volume in Q3. This might be a strategic constraint. But "so what?" you may say: AT&T's dependance on iPhone was even greater.
That's precisely my point though. As we've seen with the shift by Apple to multi-carrier distribution, AT&T is now facing serious constraints on growth and the share price is suffering. Although Verizon did not deal with Google as a direct supplier, they were at risk of having much of the IP on their network at least orchestrated by a company that was not always aligned with their strategic goals. Much the same predicament AT&T is facing now.
The tale of AT&T and iPhone does lend support to the premise that Verizon felt a bit too constrained by Android hegemony on its network.
Is Android Competitive with iOS?
This last point was supported by the data showing a widening higher sell-through rate for iOS vs. Android on comparable addressable markets. Although the data has been confirmed with survey data, there are issues with this interpretation. First, because the addressable base for iPhone is higher at AT&T with the post-paid contracts being more popular there, iPhone had an easier time getting sold. Second, because 3/5 of the phones were upgrades.
The jury is still out but the apparent pent-up demand (admittedly anecdotal) for iPhone on Verizon does seem to show that given similar pricing, and a similar demographic/geographic addressable market, people do prefer the iPhone.
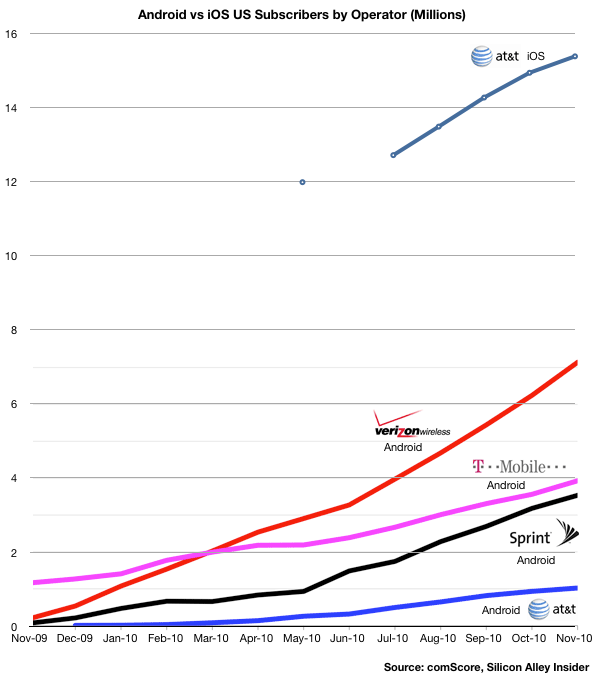
The following chart uses comScore data to show the relative consumption of Android vs. iOS by the subscribers of the four major US operators. I modified an original chart published by Silicon Alley Insider.
A few observations:
As of November, the ratio of iOS to Android users was more than 15 to 1 at AT&T.
iOS at AT&T has twice the users as Android at Verizon
Although T-Mobile had the Android franchise to itself for all of 2009, it was overtaken by Verizon within four months
T-Mobile Android consumption has also been nearly matched by Sprint within a year
The rapid eclipse of T-Mobile smartphone penetration makes one wonder how effective Android is as a differentiator for carrier and device vendor alike. It also explains their new pricing model.
The data also gives clues to how iOS at Verizon will grow.
Since Verizon and AT&T have nearly the same number of subscribers, excluding RIM ,which is common to both, AT&T has a far larger penetration of smartphones (16.5 million vs. 7 million.) Is the cause iOS itself or the delay with the timing of Android launch at Verizon?
Other data from comScore shows that much of the gains for Android at Verizon have been at the cost of RIM, so Android has not been entirely additive. Will there be a similar platform switching going on or will iOS be additive to the Android base?
On one hand, the potential exists for a similar number of touch smartphone users at Verizon as at AT&T (15 million as of November). On the other, Verizon is "half-penetrated" with Android. How many will switch (as they did with RIM) and how many will be new users?
I'm not going to make any predictions yet but I would not be surprised if Android at Verizon will flatline if not drop while iOS at Verizon will jump quickly to make the sum of both equal to AT&T iOS in about twelve months. That would imply about 10 million new Verizon iOS users by 2012.
If Verizon users start to switch from Android to iOS, iOS could add as much as 15 million users. It seems that 10 to 13 is a reasonable estimate.