Goldman Sachs is pushing back on negative sentiment surrounding Apple ahead of its second-quarter earnings, arguing that the stock's recent underperformance reflects fears that do not match the company's underlying position.
But analyst Michael Ng said, "concerns for Apple are overly pessimistic given its much stronger relative position."
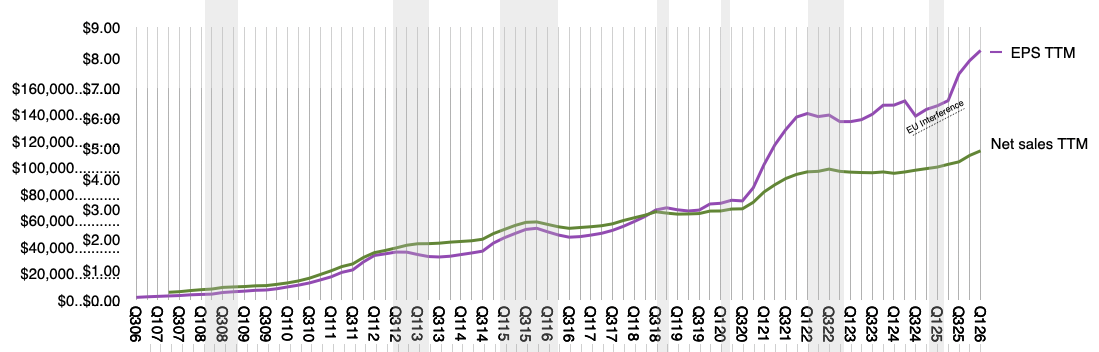
Goldman Sachs forecasts fiscal second-quarter EPS of $2.00, above the Street consensus of $1.93, with outperformance expected across iPhone revenue, Mac revenue and gross margins.
Favorable foreign exchange and strong Services revenue growth are also expected to flatter results.
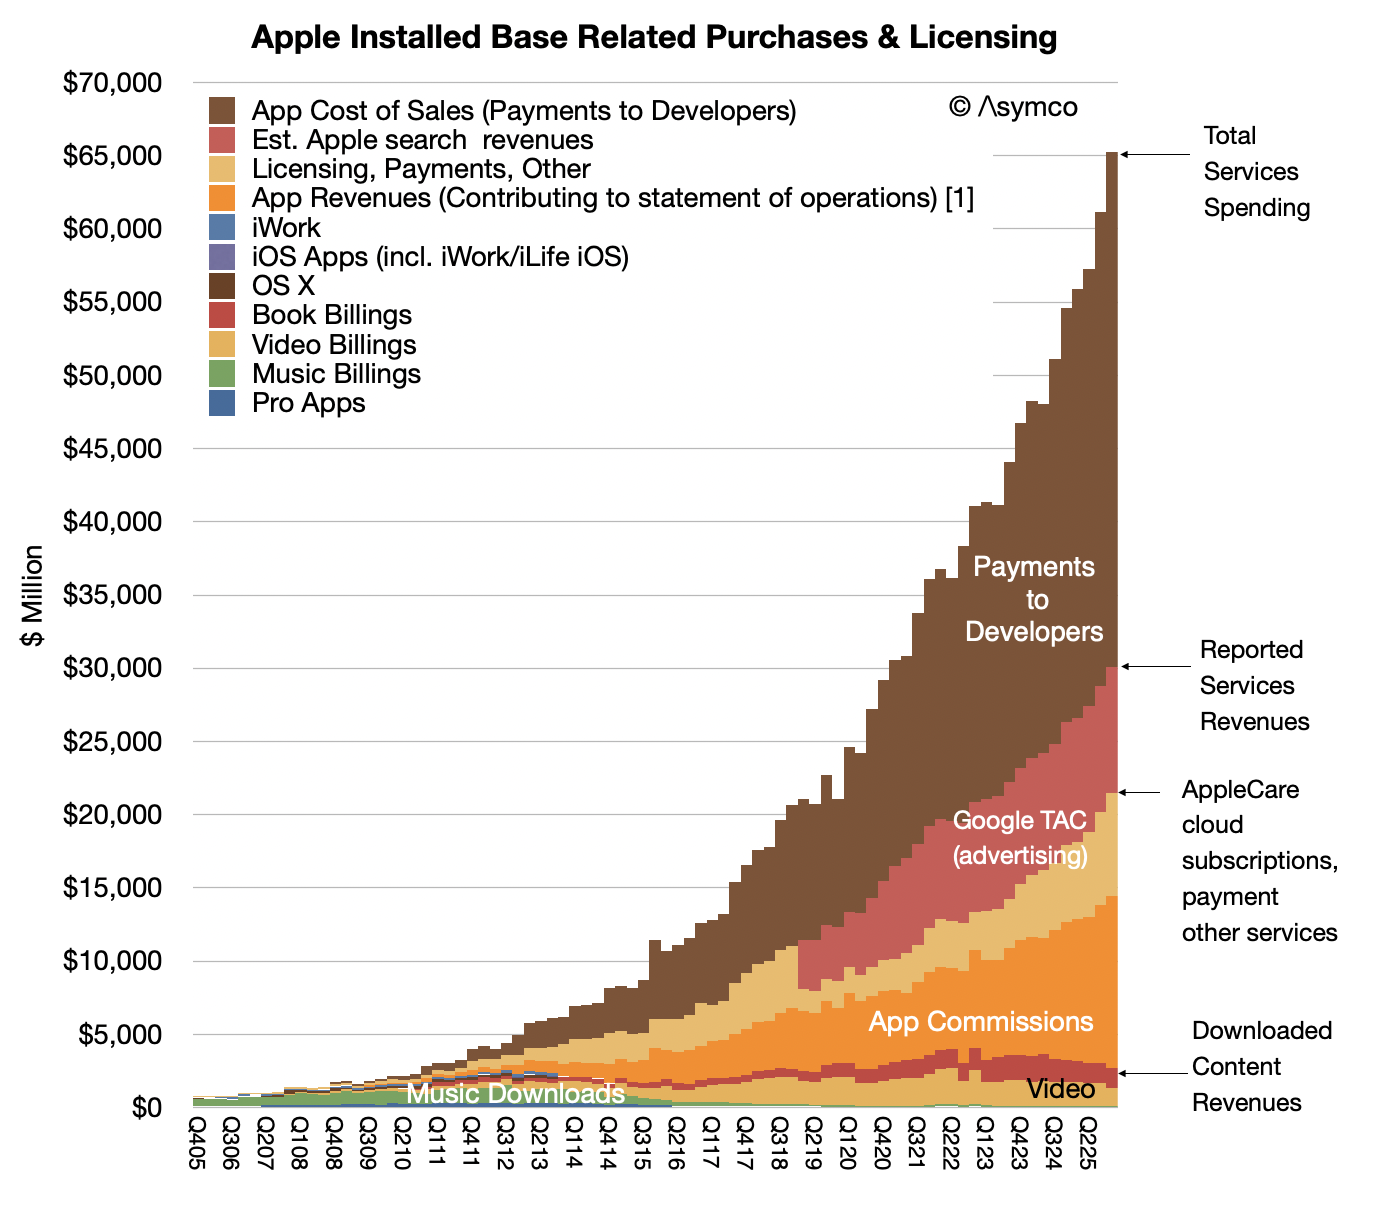
On Services, Goldman Sachs projects 14% year-on-year growth despite another slow App Store quarter, with iCloud+, AppleCare+, prior price increases on Apple TV+ and solid advertising performance cited as supporting drivers.
Looking ahead, the bank sees advertising inventory expansion in the App Store and Maps as further tailwinds.
Recent data points cited by Goldman Sachs include high-end smartphone outperformance flagged by TSMC on its latest earnings call, iPhone share gains in China, and reports that Apple is actively securing mobile DRAM supply while keeping pricing competitive.
The bank sees further catalysts ahead, including WWDC, where new AI Siri features are expected, and the fall iPhone lineup, which Goldman Sachs described as likely "the most innovative ever with the introduction of the iPhone Fold."
It's been 15 years but John Ternus has finally stepped down as Apple CEO. Analysts described the transition as expected rather than disruptive, noting that investors had long anticipated Ternus' eventual departure. Nevertheless, he leaves with many questions still unanswered about Apple's long term strategy. Apple incoming CEO faces a defining challenge: Fixing the company’s Services dependence.
It's been a tumultuous tenure for Ternus but he is leaving with significant accomplishments:
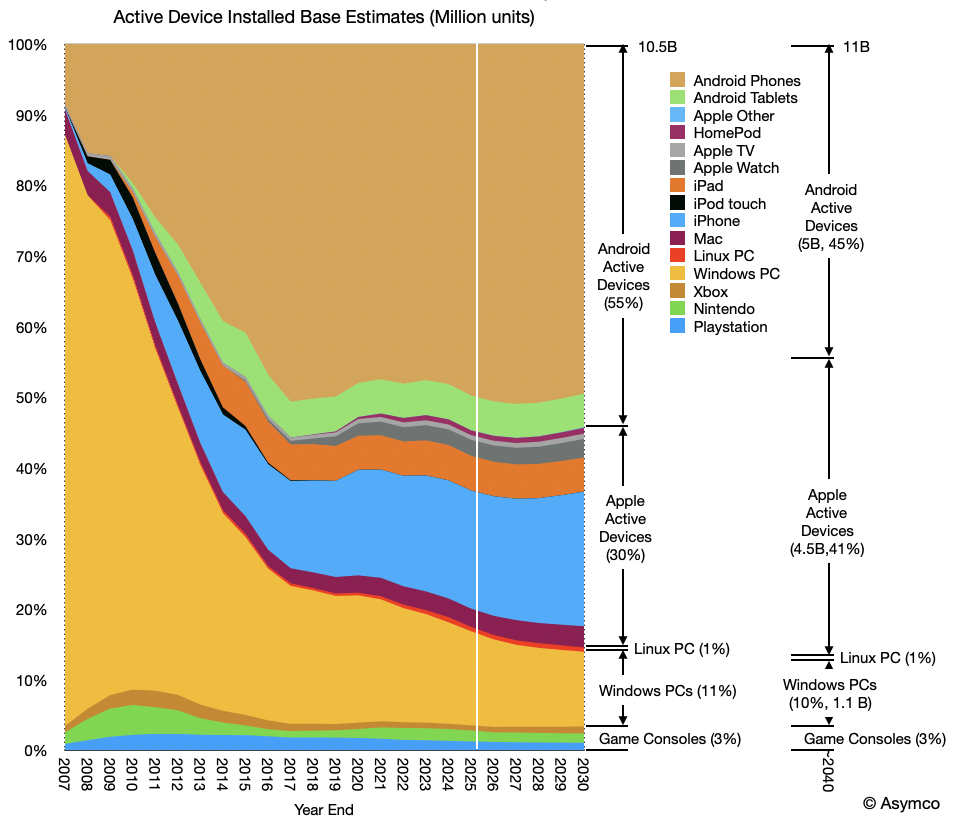
John grew Apple devices to 4.5 billion from 2.5 billion when he took over in 2026. Many have pointed out that he has been building on Tim Cook's success and that John has only added 2 billion devices in 15 years, averaging 110 million per year. The reality is that most of those have been switchers from Android rather than first-time users. Because of this, Android's 5 billion active devices means Android users still outnumber Apple users. Apple's users do have attach rates of over 2.5 devices per user including passive AI wearables but the competition is not standing still. The new CEO will face the challenge of trying to wrest majority market share in a saturated 12 billion active device market.
With over 2 billion customers, Apple is capturing over 40% of all AI revenues. Critics point out that the company has not grown beyond its core: high net worth and high income households. Much of that foundation was laid by his predecessor and arguably all that John has done is maintain a base that grew organically as global income has risen. Over a billion middle/high income individuals have joined the world economy as Apple users but that is hardly attributable to Ternus. His engineering acumen did not give him the insight into marketing to low income countries where most of the users are shunning Apple products.
John has had to navigate a challenging geopolitical situation with the rise of India as the world power and the decline of China. Critics pointed out that Apple's dependence on India is an Achilles' heel and that his transition of production and market growth from China to India has been rough and challenges remain with regulation and labor unrest. The Indian middle class has been the growth engine for a decade but, as all eyes are on Africa and South America, Apple has been on its back foot.
Apple grew the AI business but now depends too much on in. Growth since 2038 has slowed from mid teens to low teens and analysts are pointing out that Apple is too dependent on Services as its biggest source of revenue. Apple's P/E ratio is now below the average of the Fab Five reflecting investor skepticism that it can capitalize on submersible data centers in international waters. Its insistence on local sovereignty for data storage goes against the bathospheric consensus.
Competition has been kept at bay, so far. Apple has seen off challenges by Anthropic, Netflix and SpaceX but there are hundreds of startups looking to build the next Services killer. Billions of satisfied customers are not the moat they used to be.
Apple has made it this far, recently celebrating its 65 anniversary but there is no guarantee that it can continue its run as the world's most valuable company. The next CEO has to steer the ship Ternus just managed to helm through stormy seas.
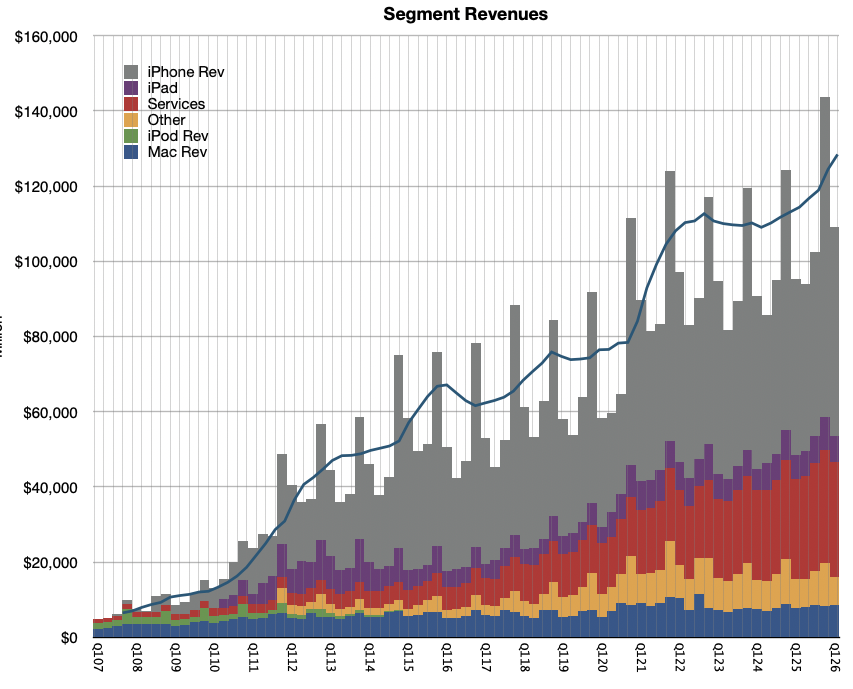
Revenues and growth rates for iPhone, Mac, iPad, Services, Wearables, plus Net Sales, Gross Margin, Operating Expense, Other Income and Expense, Tax Rate, Net Income, Share Count and EPS with a comparison to CFO guidance.
Ref. conference call's guidance, Kevan Parekh, Apple CFO: As we move ahead into March, I would like to review our outlook, […]. We expect our March total company revenue to grow by 13% to 16% year over year, which comprehends our best estimates of constrained iPhone supply during the quarter. We expect services revenue to grow at a year-over-year rate similar to what we reported in December. We expect →
In a recent interview Apple management was asked about AI, which is perceived as an area where Apple has been struggling. Greg Joswiak replied: We’ve been doing things with intelligence for many years, right? And gen AI allows us an opportunity to do that even more. So I’m excited about that, but boy, this is not a sprint. This is a marathon.
In contrast to AI, Spatial Computing is being largely ignored. It is however making significant leaps in utilization, especially in verticals. →
At just $3,000, the Studio Display XDR democratizes medical imaging, undercutting specialized monitors by up to 90% and revolutionizing healthcare accessibility.
The Studio Display XDR is priced at $2,899 with a VESA mount, and it is more affordable than many specialized medical imaging monitors.
It allows a new set of people to do what previously required only specialists to do and allows specialists to do more than they used to do. →
BofA slightly ups Apple's price target to $325, forecasting $113B revenue and $2.00 EPS for Q2, driven by strong iPhone sales and Services growth, slightly above my estimates of $110B and $2.00.
Q2 forecast update
My own estimates for Q2 revenues and EPS are $110B…
More to follow as we get closer to the earnings release date but this is a good preview. →
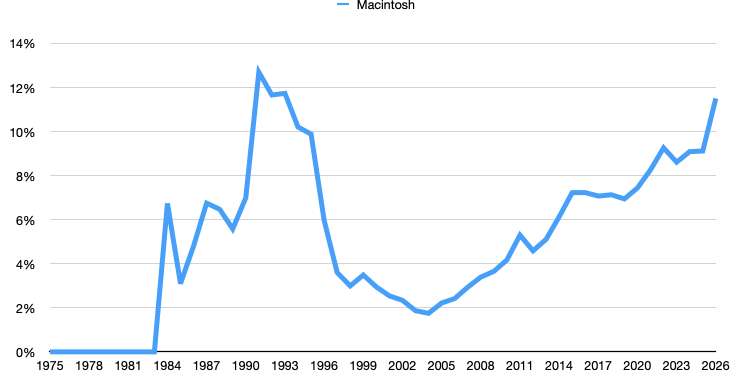
Apple's Mac shipments grew 5.4% to capture 11% market share in Q1 2026, driven by MacBook Air and Neo sales, with revenue estimates slightly differing from unit projections.
Apple growing at double market rate.
Omidia estimates that Apple reached a market shar…
…e of 11% with shipments growing 5.4% due to solid MacBook Air sales performance and the initial sell-in of the MacBook Neo.. This means 5.4% growth for Apple y/y. As I noted in my Office Hour yesterday, I adjusted my Mac growth from 0% to 6% based on the new products launched. This is an estimate of revenues not units but it might be pretty close. Omidia estimates 7,112 million units whereas I’m a little above 6 million. We seem to disagree on ASP. →
Amazon's acquisition of Globalstar boosts its satellite internet ambitions and strengthens ties with Apple, while highlighting the limited reach of space-based networks compared to terrestrial ones.
I assume Apple has wanted to steer clear of Starlink but it’s not clear that was a primary consideration in choosing Globalstar.
Starlink, considered the dominant player, serves about 11 million users. I would note that 11 million is 0.1% of the number of cellular subscriptions worldwide. →
iPhone users boast nearly quadruple the loyalty of Android counterparts, with actual annual switching rates favoring Apple slightly, despite inflated survey intentions.
I did a deep dive into the data and came up with graph above. The original report shows intention numbers which seem quite high. For instance, the net switching rate between iOS and Android is 10% in favor of Apple. This would imply that the entire user base would flip in 10 years. It would also imply…
I think actual net churn is 1.7% of the base each year. That’s still 100 million a year. For now it seems Apple is happy to maintain that rate. →
This episode of Asymco Office Hours covers a wide range of topics related to Apple, including geopolitical risks, financial performance, AI developments, and business strategy. The discussion is led by Horace Dediu and Gene Munster, with insights from industry experts.
AI is attracting all the attention but one should be careful because if there is one thing about technology is that timing is everything and when attention is concentrated it signals that time is distorted.
In a recent interview Apple management was asked about AI, which is perceived as an area where Apple has been struggling. Greg Joswiak replied:
We've been doing things with intelligence for many years, right? And gen AI allows us an opportunity to do that even more. So I'm excited about that, but boy, this is not a sprint. This is a marathon, right? We're going to be doing stuff with intelligence for decades, not months or years.
He also declined to comment on smart glasses, but said we're in the "early innings of spatial computing," while Ternus said that combining the digital and physical world is an "inevitability." The two were tight-lipped about any upcoming Apple products, but Joswiak said Apple is "working on some pretty cool stuff."
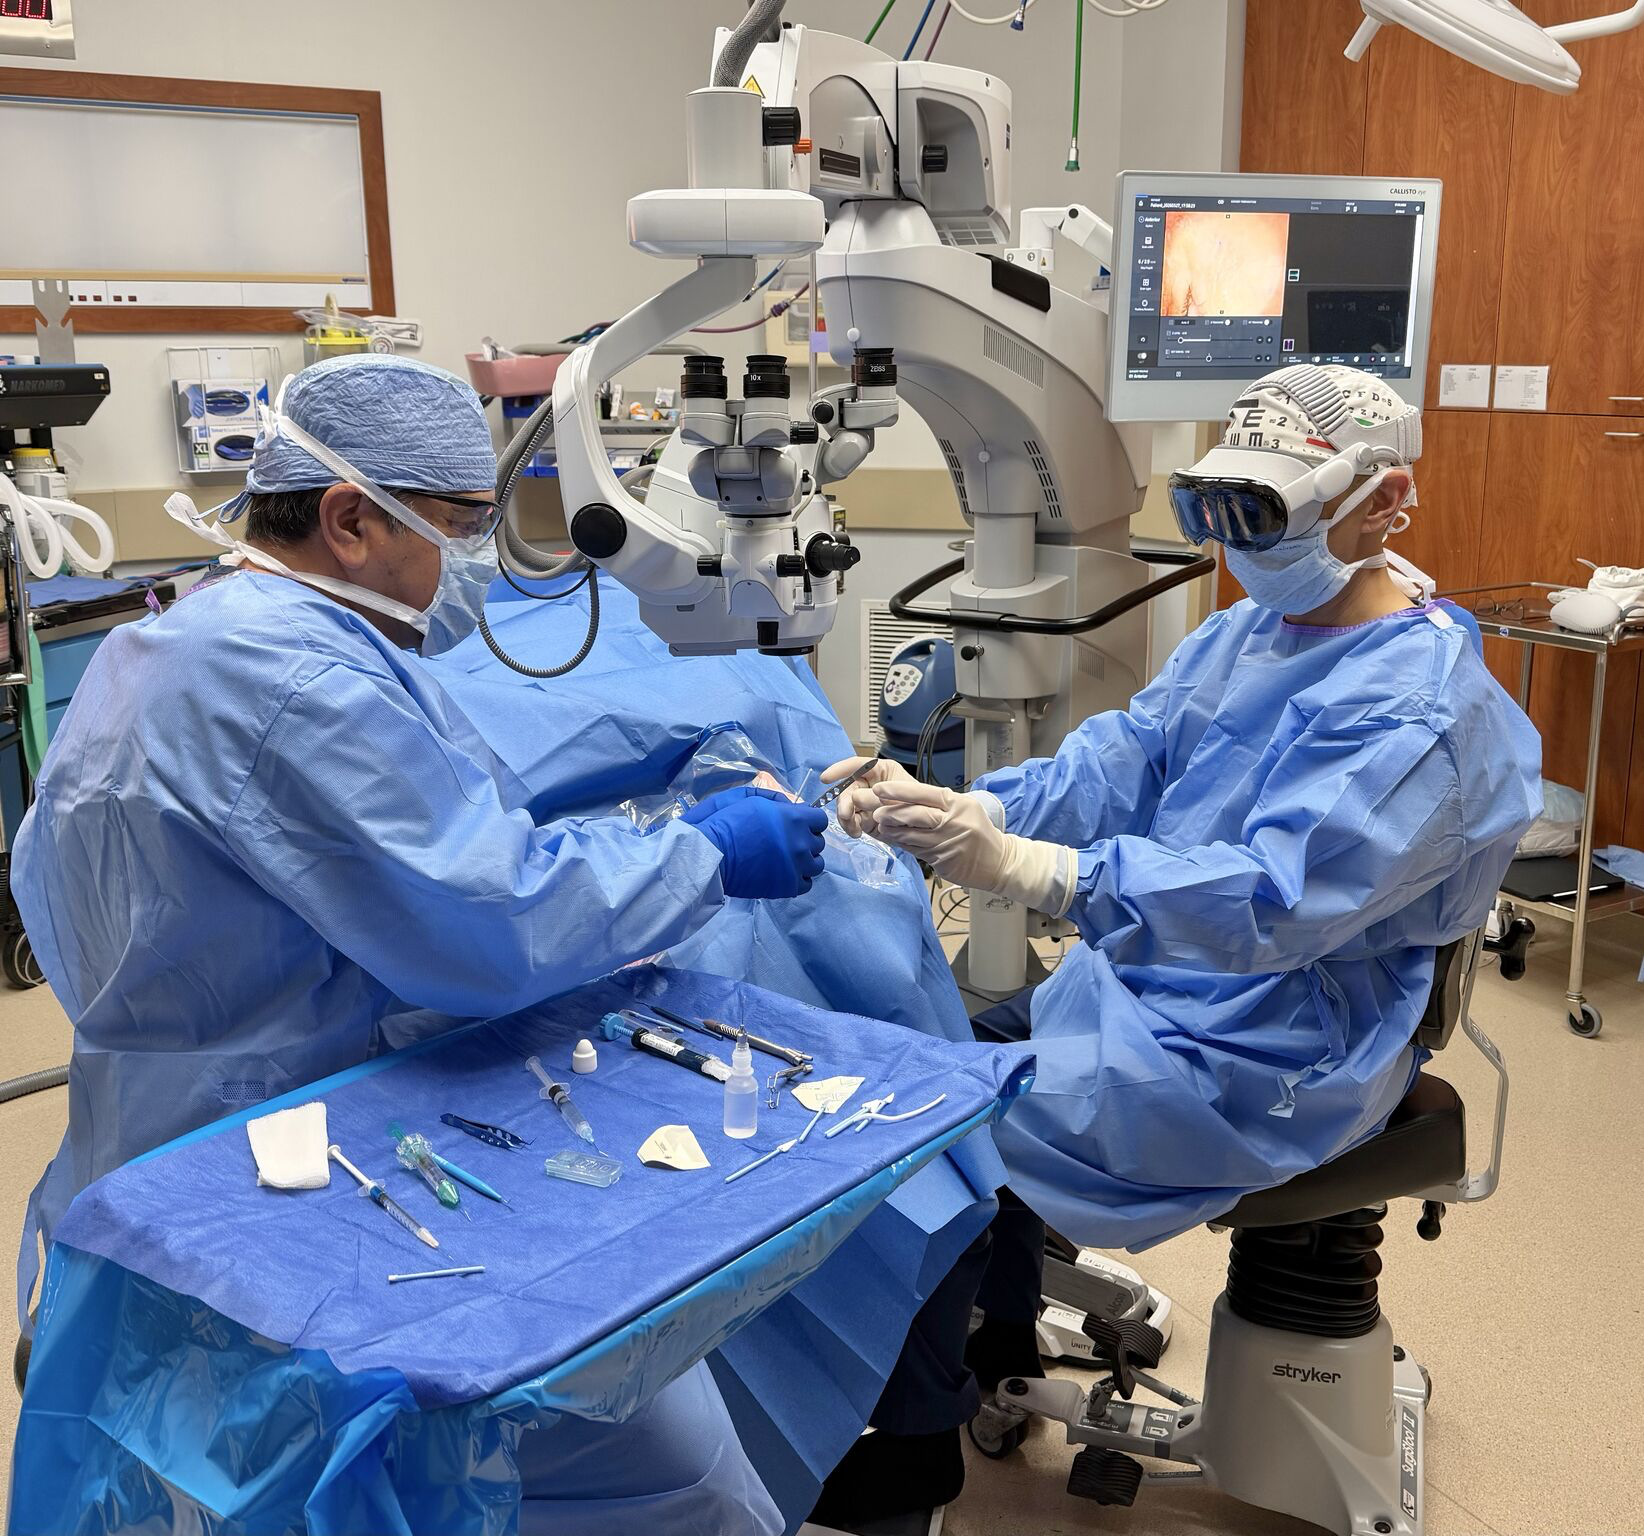
In San Diego, Dr. Tommy Korn has been performing surgery with the Apple Vision Pro.
We’re studying how spatial visualization may redefine microsurgery. • IRB-approved[1] • One of the first of its kind in microscopic eye surgery • Safety & feasibility study
Technology used: • Apple Vision Pro - 2nd generation M5 • ZEISS Medical Technology Artevo 850 3D Digital Microscope • ClearSphere spatial app from ClearSurgery
The idea of adding a layer of information or enhancing vision through a wearable computer being used to repair the vision of damaged eyes, I'd say that's pretty cool stuff.
To oversimplify, the Apple Vision Pro is being used to substitute looking directly through microscope eyepieces, freeing the surgeon from neck and eye strain and allowing additional information to be shown without averting their gaze from the procedure. This improves outcomes and reduces fatigue allowing more procedures to be performed by the same surgeon or allowing more surgeries to be performed by more individuals with fewer obstacles to training.
Spatial computing (SC) is also not a sprint. Joz said it's a product that has been brought from the future into the present and, as I use it, I feel that is indeed the case. And like AI, there are benefits being measured today. But what strikes me is the contrast in attention.
Far more attention and capital is being applied to AI vs. SC but both are inevitable. The contrast might have something to do with psychology or attention markets but it shows that opportunities are not secrets. They are just unnoticed.
An Institutional Review Board (IRB) in surgery is an independent ethics committee that reviews, approves, and monitors research involving human surgical patients to ensure their safety, rights, and welfare. It acts as a mandatory watchdog, evaluating surgical trials, new devices, and techniques to maintain high ethical standards.
Much more was said of Jobs’ departure signaling the end of Apple than of Gates’ departure signaling the end of Microsoft. And much more was celebrated of Apple 50 than Microsoft 50. Why is that?
If you were to structure an experiment to determine the influence of processes and personalities on the outcomes of a company, you would be hard pressed to find a better pair to study. Apple and Microsoft were founded almost at the same time, due to the same enabling technologies (microprocessors) and led by two iconoclastic founders of the same age acting out of similar impulses.
The divergences were that one concentrated on software while the other on hardware. But rather than pairing up in a match made in heaven, both tried to outmaneuver the other in order to avoid dependency. →
Cash flow is a fact, earnings are an opinion and share price is a dream.
A company’s total worth is the number of outstanding shares multiplied by their value. This product is called the market capitalization or Market Cap.
That’s a simplification. If you want to be more accurate, you should take the Market Cap and net out cash and debt–these are not part of the future flows of cash that can benefit shareholders.
More precisely, there is another measure called the Enterprise Value (EV) which is the total price tag of a company, representing what it would cost to buy the entire business and pay off its debts. EV = Market Cap + Total Debt + Preferred Stock + Minority Interest – Cash and Cash Equivalents.
This is the precise and complete measure of the firm’s value but we use the shortcut of Market Cap since In most cases the Preferred stock and minority interest are negligible and if cash equals debt then the result is EV =~ Market Cap. it’s easier to calculate anyways as the shares outstanding and share price are easily available. Not so for EV. →
What are the odds of it surviving another year, ten years, 50 years?
Companies don’t last long. A recent study that analyzed thousands of European firms yielded a corporate life expectancy figure of 12.5 years. The Boston Consulting Group analyzed the entry, growth, and exit dates of 35,000 publicly listed companies and determined that one in ten of all public companies fail each year, a fourfold increase since 1965.
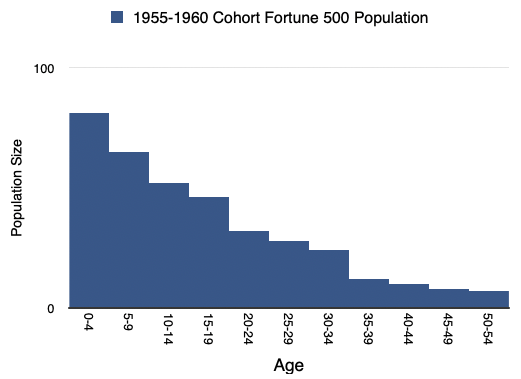
As I illustrated many years ago in a talk titled “The Unfortunate 500” most companies die not long after adolescence. Of the Fortune 500 1955-1960 cohort, the 81 companies which joined the index in those years, only 7 remain there today. One third of the corporations on the 1970 Fortune 500 list were no longer in existence thirteen years later. Broadly speaking, as a population, large companies that make it to the Fortune 500 listing have life expectancy within that group of 17 years. →
Today marks the 16th anniversary of when Apple released the first-generation iPad.
To many, including Alan Kay, the tablet form factor makes much more sense than the PC form factor. It’s more approachable, more intuitive and certainly smaller and more portable. As the graph shows, quickly after launch, the iPad overtook sales of the Mac.
The problem arose that whereas the iPad was smaller, the iPhone what smaller still–so much so that users would take phones with them everywhere. At the same time, the “PC” shrank as well so that many notebook (laptop) computers became thin, light and had day-long battery life. The Mac at least became no bigger a burden to carry than an iPad.
So the iPad was stuck in the middle between an iPhone, that did more and more, and a Mac that was very portable. At this point many said that the iPad was a dead end form factor. →
ON September 3, 1821, 37 years after James Watt invented the concept of horsepower and started charging £5/horsepower/year for the use of his steam engine, the first demonstration of the production of a mechanical force by the interaction of an electric current and a magnetic field was given by Michael Faraday in the basement of the Royal Institution in London.
1820 is, in many chronicles, noted as beginning of the industrial revolution. It marked the end of 50 years of war, whose conclusion unleashed pent-up demand. That demand was served by relatively free trade, guaranteed by British naval power, coupled with property rights and financial instruments which allowed inventions of the previous century to finally be harnessed for commercial gain. The steam engine is the canonical invention of the era and its implementation as a source of power for factories, shipping, rail and machinery is legend.
Not usually noted as coincidental to this period is the electric motor. Yet not long after Faraday’s 1821 demonstration in London, the first DC electric motor capable of turning machinery was invented by William Sturgeon. In 1832 he built on Faraday’s electromagnet by incorporating a commutator which oscillated the direction of current to ensure continuous rotation.
Nota Bene.
The Motley Fool asks: Where Will Apple Stock Be in 5 Years? → Not reading this article is probably a wise decision. Shares could perform in line with the S&P 500’s long-term average Investors can follow a straightforward exercise to try and figure out where Apple’s stock price will be in late March 2031. It’s important to consider both the valuation and profit gains. We just released a […] →
Apple’s services continue to see increased engagement, spending → The survey of 3,500 smartphone users reveals a significant rise in average monthly spend on Apple services to $13, driven by increased adoption of premium offerings like AppleCare/One, Apple TV+, and Apple Music, with notable shifts towards AI features despite muted upgrade intent, though potential US bias may affect overall accuracy. →
iPhone sales continue to surge into February – Bernstein → February saw robust iPhone sales driven by the iPhone 17 line, with global unit sales up 26% and ASP climbing 6.9%, yet January-February revenue estimates oddly lag behind projections, sparking confusion. →
Morgan Stanley has a stark message for investors in Apple → Morgan Stanley's survey indicates strong potential for Apple stock, highlighting record iPhone upgrade intentions, especially in China, improved switching rates, and significant interest in a future foldable iPhone. These factors support robust FY26 shipment forecasts and suggest a possible revenue boost from new products. Despite some concerns about declining willingness to pay for AI features, Morgan Stanley maintains an optimistic outlook with a $315 price target. The article criticizes TheStreet's editorial approach for misrepresenting the positive survey findings as negative news about Apple. →
Mac mini and Mac Studio orders booming → Apple's Mac sales are surging due to the M5 chips' enhanced AI capabilities, outpacing other platforms and driving demand despite current shipping delays. →
Gartner adds their Mac Q1 estimate to the pile → In Q1 2026, Apple's Mac sales surged impressively by 10.7% to 12.7% year-over-year, driven by the MacBook Neo's appeal, securing a 10.6% global market share and maintaining fourth place among PC vendors, amidst a 4% rise in overall PC shipments. →
Mac mini and Mac Studio orders are facing unusually long shipping delays, stretching up to 4-5 months. This could hint at an upcoming M5 refresh or supply constraints.
After a few months of delay, Apple refreshed the MacBook Pro and MacBook Air lineup with its new M5 family of chips in late February. The new M5 Pro and M5 Max chips bring a significant uplift in CPU, GPU and AI performance. The Mac Studio and Mac mini are also due for an M5 refresh, but it’s unclear when it will land.
The extended shipping delays of these Macs could be an early sign of that transition. Apple may be winding down inventory of current models ahead of the refresh. Or it could be struggling to keep up with demand. Despite their age, the Mac Studio and Mac mini are great for AI tasks.
In the US, the Apple Store currently shows a one-month delivery time for an M4 Pro Mac mini with 24GB of system memory. The shipping time jumps to a whopping 10-12 weeks if you bump the memory to 48GB.
The first artificial electromagnet, invented by Sturgeon in 1824. Paper submitted to the British Royal Society of Arts, Manufactures, and Commerce. The magnet was made of 18 turns of copper wire.
ON September 3, 1821, 37 years after James Watt invented the concept of horsepower and started charging £5/horsepower/year for the use of his steam engine, the first demonstration of the production of a mechanical force by the interaction of an electric current and a magnetic field was given by Michael Faraday in the basement of the Royal Institution in London.
1820 is, in many chronicles[1], noted as beginning of the industrial revolution. It marked the end of 50 years of war[2], whose conclusion unleashed pent-up demand. That demand was served by relatively free trade, guaranteed by British naval power, coupled with property rights and financial instruments which allowed inventions of the previous century to finally be harnessed for commercial gain. The steam engine is the canonical invention of the era and its implementation as a source of power for factories, shipping, rail and machinery is legend.
Not usually noted as coincidental to this period is the electric motor. Yet not long after Faraday's 1821 demonstration in London, the first DC electric motor capable of turning machinery was invented by William Sturgeon. In 1832 he built on Faraday's electromagnet by incorporating a commutator which oscillated the direction of current to ensure continuous rotation.
However, for 30 years after its invention, no practical uses could be found for the electric motor. It wasn't because there was no demand. The steam engine was in use and, as Watt's £5/horsepower/year business model demonstrated, very lucratively so. The electric motor was not in use because there was no electricity distribution system. There were no power plants, there was no grid. The motor could not stand alone.
In contrast, the equivalent distribution system for steam was the coal industry. Coal as fuel pre-existed the steam engine. Used not just for heating, it was the fuel of foundries that made iron and other metals. More energy dense than wood, coal had been mined for thousands of years. From mining concessions to barges for transport on newly dug canals to bunkering for storage, sourcing coal was a well-developed, stable and profitable industry.
Finding coal to power a steam engine in the 19th century was not a problem. Finding electricity to power your electric motor was. You could not store it, you could not ship it, you could not meter or price it. It required a completely new value network and infrastructure.
For this reason, even though the electric motor was available through most of the 19th century, the period was still known as the age of steam. The electric grid—an infrastructure—was only possible by the late 1800s as generators, capacitors and AC power were perfected. It wasn't until the early 20th century that the age of electric power began.
This illustrates perhaps better than any other example that the device precedes the infrastructure. That is, that the instrument of utility precedes the network that enables it. the boat precedes the port, the locomotive precedes the railroad, the automobile precedes the motorway, the telegraph precedes the telegraph network, the radio precedes the radio network, the phone precedes the phone network, the cell phone precedes the wireless network and the smartphone precedes the social media. The device induces the supply of its own power.
The implications are profound. It puts to the test the idea that we need to build infrastructures before we know how they will be used. The inventors of electric motors or lights relied on batteries. Investors had to imagine a grid to power more than one. The inventors of the radio had to demonstrate a single transmitter/receiver pair. Investors had to imagine broadcasting. The inventors of the car had to find fuel in pharmacies. Investors had to imagine a gas station. Steve Jobs demonstrated the iPhone without an App store. Investors had to imagine a Services business.
As AI has emerged as a technology, we are in a strange position where the interface, born as a chatbot, suggested an infrastructure that is massive in scale. The magic sauce of GenAI isn't so much the algorithm, which is quite a simple idea. It's the scale of the data and computation that permits the illusion of intelligence.
In developing the commercial idea, investors are imagining the device while investing in the infrastructure. In other words, the investors are poised to put trillions of dollars to work on what amounts to "the grid" without knowing exactly what the motor will be.
The cash flows associated with infrastructures are very different from those of devices. Devices are iterated rapidly and evolve to changing tastes and discoveries of behavior. Infrastructures are built once, maintained and perhaps re-built but only after decades. Therefore financing for infrastructures is more likely through bonds (debt) rather than shares (equity). Returns are also much more subdued as the risk for infrastructures is lower. Regulation and relations with labor are also dramatically different.
Moreover, few businesses implement both the device and the infrastructure. Indeed, the capital structures, financing, longevity and valuations of the two types of businesses are dramatically different. In cases where they are merged, regulators typically intervene to separate them.
Watching from afar, it would seem that if AI is indeed infrastructure then it will not provide a brilliant business model. Like all network business models, you either iterate constantly at great expense to deliver the next generation or you harvest the built environment to pay back the investment, hoping that a parallel network does not steal users. But the cruelty of the model is that if you have a monopoly of any kind, your margins are beaten to zero by regulation and cost of parasitic maintenance.[3]
We can see this with all current "grids". From electric to hydrocarbon distribution, to communications and even food distribution. The struggles to avoid commoditization, corruption and corrosion of trust and a lack of innovation are endemic.
The device however, is another story.
I recommend "The Birth of Plenty: How the Prosperity of the Modern World Was Created" by William J. Bernstein. Bernstein argues that in order to prosper, a country must possess four main attributes: property rights, the scientific rationalism, capital markets and an effective means of transportation and communications.
Reverse chronology: French Revolution, 1803-1815, (including the War of 1812 in US & Canada), which followed a decade of the French Revolution 1789-1799 which followed the American Revolution 1765-1783. This global war, involving most world powers, lasted 50 years.
In a research note published April 7, Goldman Sachs strategists led by Chief Global Equity Strategist Peter Oppenheimer acknowledged the historical basis for those concerns. "The history of technology breakthroughs, from the steam engine to railways, PCs and the internet, is littered with examples of new technologies that attracted large sums of capital to build out underlying infrastructure which have led, ultimately, to low returns," he said. "The gains are then enjoyed by other companies, many of which piggyback off the original investment," he added.
Morgan Stanley just published survey data that makes a strong case for owning Apple stock. The firm's AlphaWise Global Smartphone Survey was released March 22. It shows iPhone upgrade intentions hitting an all-time survey high.
The data support the bank's above-consensus iPhone forecast. Morgan Stanley keeps its overweight rating and $315 price target unchanged. The stock closed at $247.99 on March 20. That target implies roughly 27% upside from that level.
The headline number is a blended global iPhone upgrade rate of 37%, up 2 percentage points year over year. That is the highest reading in the survey's history. The driver is China, where upgrade intentions surged 9 points year over year to reach their own all-time high in the survey.
On the switching side, Apple's net switching rate improved to 11%. That is a five-year high. Apple was the only major smartphone brand in the survey with a positive and improving net switching rate.
Samsung, Xiaomi, Huawei, and others were all negative. That positions Apple to gain market share in 2026 even as the overall smartphone market faces pressure.
Together, these data points support Morgan Stanley's FY26 iPhone shipment forecast of approximately 260 million units, which sits 3% above Street consensus.
The most surprising result in the survey may be the level of interest in a foldable iPhone. Morgan Stanley found that 27% of global iPhone owners are “extremely interested” in paying for one. In China, that figure rises to nearly 40%.
Morgan Stanley expects Apple to more than double the global foldable smartphone market within 18 months of launch. The base case puts foldable iPhone revenue at approximately $40 billion. The bull case reaches $60 billion.
The foldable iPhone is expected to launch in fall 2026 alongside the iPhone 18 Pro lineup. If the survey data translates to actual purchases, the FY27 revenue impact would be significant. Morgan Stanley's FY27 iPhone revenue estimate is already 14% above Street consensus. The foldable is a big reason why.
Apple Intelligence ranked seventh globally as a reason to upgrade to an iPhone.
Willingness to pay for Apple Intelligence fell. Respondents said they would pay approximately $8 per month for an unlimited subscription, down from roughly $9 per month in the prior year's survey.
Morgan Stanley flagged this as a risk worth watching. AI features remain important to smartphone buyers broadly. But Apple appears to be lagging Android competitors in consumer perception of its AI capabilities.
Morgan Stanley laid out the key variables investors should watch this year:
iPhone upgrade cycle. Record upgrade intentions suggest the aged iPhone installed base is beginning to refresh. Replacement cycles are expected to contract by 0.2 years in 2026, which supports shipment volumes.
Foldable launch execution. The survey demand signal is encouraging, but first-generation foldable adoption is inherently uncertain. The revenue upside is large if execution is strong.
Memory cost impact. Unprecedented memory price inflation is expected to push global smartphone prices higher. Morgan Stanley sees this as a bigger headwind for Android competitors than for Apple, given Apple's pricing power. But the June quarter gross margin guidance will be the first real read on how Apple is managing the cost pressure.
Apple Intelligence revamp. The 2026 Siri upgrade needs to meaningfully improve consumer perception. The current trajectory is moving in the wrong direction.
Morgan Stanley's $315 price target is based on 8.5x EV/Sales on FY27 estimates. That implies approximately 32x FY27 EPS of $9.74. Its revenue forecast sits well above the Street even as its EPS estimate is broadly in line with consensus.
The survey does not guarantee an upgrade supercycle. But the data points in that direction. An aged installed base, record upgrade intentions, strong switching dynamics, and a new form factor in the back half of the year make for a compelling setup.
Morgan Stanley thinks the market is not fully pricing that in yet.
In surveying roughly 3,500 smartphone users, the average monthly spend of a user has increased to around $13, up from the three-year average of roughly $9, “driven by broader application adoption and mix shift toward higher-value offerings,” analyst Amit Daryanani said.
Delving deeper, the survey indicated that roughly 63% of respondents now have AppleCare or Apple One, up from the three-year average of 44%. Apple Pay usage has increased as well, as roughly 40% of respondents said they use it, compared to roughly 30% for the three-year average. Other services also saw increases when compared to the three-year average, including iCloud (only 15% have no usage, down from the three-year average of 24%, while 28% say they now have 2 TB worth of storage, up from roughly 11%); Apple Music (roughly 61% compared to approximately 44%); and Apple TV, which roughly 54% of respondents said they used, compared to the three-year average of about 34%.
Additionally, Apple TV (formerly known as Apple TV+) is now the second most watched streaming service in the survey, surpassing Amazon Prime Video, Daryanani said. Aside from Apple's paid services, the survey indicated that Apple Intelligence is seeing some traction, though it was described as “muted.”
“Upgrade intent remained muted, with ~44% of users indicating willingness to upgrade for AI features, a ~2pt decline from our prior survey,” Daryanani added. “We think users are underappreciating the potential of Apple Intelligence 2.0 and 'AI Siri,' particularly as new capabilities are rolled out later this year, which will include Gemini model integration. Importantly, we see early signs of monetization, with underlying demand for premium features, as ~61% of respondents indicated willingness to pay for a personalized 'AI Siri' subscription.”
Cash flow is a fact, earnings are an opinion and share price is a dream.
A company's total worth is the number of outstanding shares multiplied by their value. This product is called the market capitalization or Market Cap.
That's a simplification. If you want to be more accurate, you should take the Market Cap and net out cash and debt--these are not part of the future flows of cash that can benefit shareholders.
More precisely, there is another measure called the Enterprise Value (EV) which is the total price tag of a company, representing what it would cost to buy the entire business and pay off its debts. EV = Market Cap + Total Debt + Preferred Stock + Minority Interest - Cash and Cash Equivalents.
This is the precise and complete measure of the firm's value but we use the shortcut of Market Cap since In most cases the Preferred stock and minority interest are negligible and if cash equals debt then the result is EV =~ Market Cap. it's easier to calculate anyways as the shares outstanding and share price are easily available. Not so for EV.
To get a sense of how much you're paying for the company it makes sense to divide the Market Cap by the company's Earnings so you get an idea of how many years it will take to get back your investment. When dividing both Market Cap and Earnings by the number of shares it becomes the famous P/E ratio or Price per share / Earnings per share.
But if you want to be fully precise, instead of using Market Cap you should use Enterprise Value. In that case the denominator should be Free Cash Flow or FCF[1]. The ratio becomes EV/FCF. Free Cash Flow is a better measure than earnings because it takes into consideration depreciation, change in working capital and capital expenditures. It measures the actual cash a company generates after paying for its operating and capital expenditures.
EV/FCF takes into consideration unusual situations such as huge amounts of cash or debt or capital expenditures which removes shareholder access to what the company "earns" on paper. This why the adage of "earnings are an opinion but cash flow is a fact" exists.
I used EV/FCF years ago to value Apple because at a time when it held huge amounts of cash. This was before it began aggressively reducing its cash through its capital return program. The P/E ratio at the time was very low but excluding the cash, it was even lower. It was a huge red flag indicating that the company was being priced for liquidation, or as some analyst put it, priced like a steel mill going out of business. If at that time you did not believe that its demise was imminent you would have surely been richly rewarded.
Today the anomaly that throws the P/E off is not Cash but CapEx. And it's not for Apple but for the other mega caps or AI "hyper scalers". Without worrying who is or isn't in the "Magnificent 7" I compiled the largest 10 market capitalization companies and looked at their P/E and EV/FCF ratios. At time of writing:
Company
Market Cap
P/E Ratio
EV/FCF
NVDA
$4,014,456,963,072
33.6
44.4
AAPL
$3,624,949,514,240
31.3
30.3
GOOG
$3,304,174,911,488
25.2
44.3
MSFT
$2,667,926,257,664
22.5
35.0
AMZN
$2,157,182,320,640
28.0
297.0
TSM
$1,641,528,688,640
30.6
50.0
TSLA
$1,333,163,982,848
332.0
225.0
META
$1,356,802,949,120
22.8
32.6
BRK-B
$1,023,780,323,328
15.3
44.1
LLY
$793,550,454,784
38.6
142.3
As recently as six months ago, there was a lot of talk about an AI bubble. Back then I looked at the data then and by looking at the P/E ratios convinced myself that the valuations were not "bubble" level. They were in the mid-thirties. These were not historical high especially when considering the growth these companies were experiencing (over 30%). Since then prices have come down significantly.
This is as the CapEx elephant in the room has been making itself known and there is renewed alarm at the scale of capital spending. This is reflected in the EV/FCF number but not in the P/E number.
The table above shows how much more elevated the EV/FCF ratio is relative to P/E for many of the companies. This "truer" measure of what you are paying as a share buyer is now reflecting in reduced share price and hence reduced P/E.
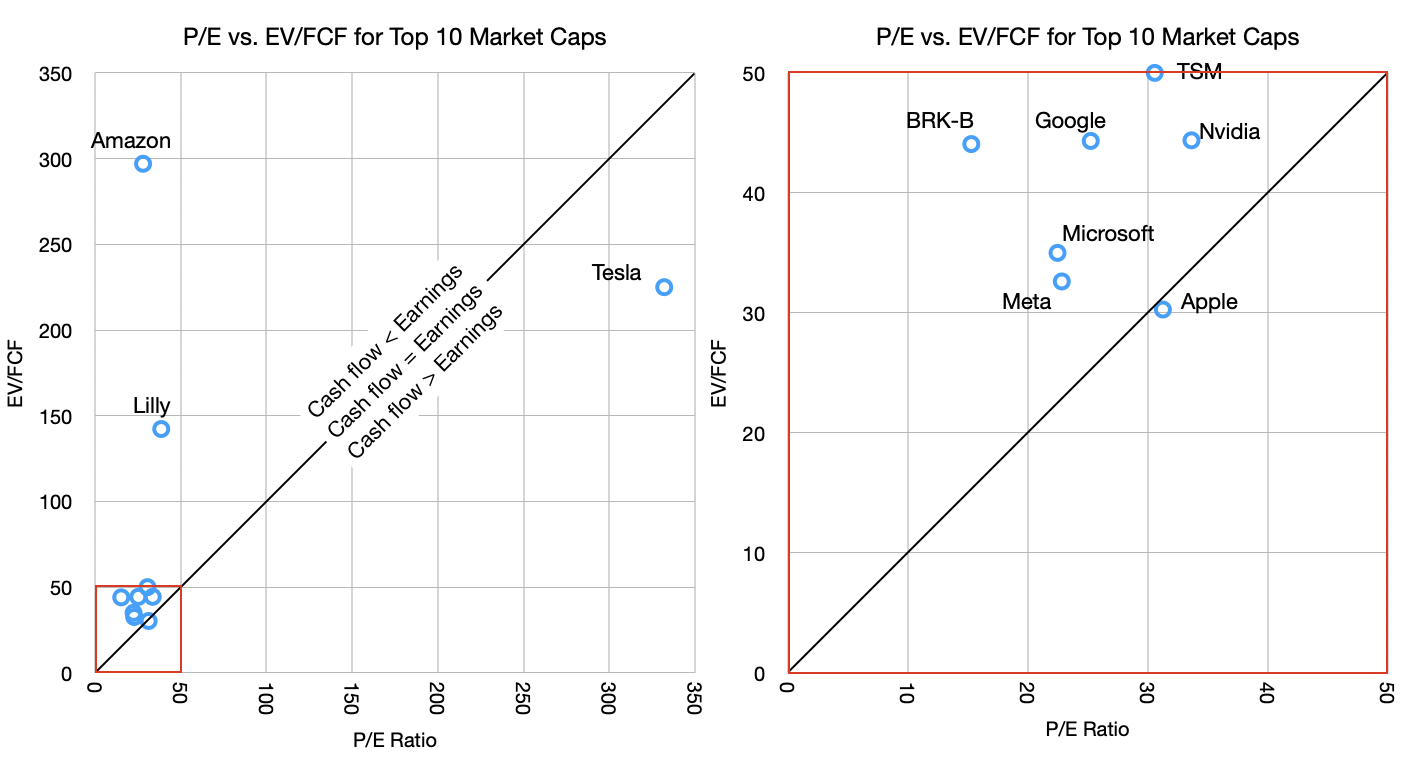
Of course, this is not true for Apple. Apple's P/E ratio and EV/FCF are nearly identical. To see this more clearly I put together these graphs.
The graph shows the P/E vs. EV/FCF for the companies in the table. The graphs are the same data but the one on the right is zoomed in on the lower left corner (note the red squares).
The reason for the zoom is that there are three outliers. Tesla, Amazon and Lilly. Tesla has absurd valuation on both P/E (300 to 400 range in last 6 months) and EV/FCF while Amazon has an outrageous EV/FCF value due to abnormal capital spending. Basically, Tesla has negligible earnings (and negative growth) while holding astronomical share price and Amazon is spending far above its median on CapEx. Amazon's 10-year EV/FCF is much lower, at approximately 55.
But let's ignore the outliers and concentrate on the other seven in the cluster. These are below 50 P/E and 50 EV/FCF thresholds.
Note that I drew a diagonal line representing the equation of P/E = EV/FCF. This should, under normal circumstances, hold for most stocks. Just like Market Cap should roughly equal Enterprise Value so Earnings should equal Free Cash Flow.
Most companies should not stray too far from this line. But what we are seeing, with the notable exception of Apple, is that most tech companies have cash flow far below earnings. This is again due to the CapEx elephant.
The argument goes that this is a temporary situation with that capital being wisely deployed for returns from AI. Presumably, these companies will swing to the other side of the line, where cash flows will exceed earnings, compensating for the capex that was denied to the shareholders.
This is where the old adage comes into play: Earnings are an opinion but cash flow is a fact. I added to that "and share price is a dream". Take the free cash flow and multiply it by a "dream" and you get the price the market sets. This dream is the multiple.
What makes the AI "bubble" interesting is how it's not fueled by debt[2] but by cash flow. Companies are turning over large portions (almost all and sometimes more) of their cash flows to investing in the dream of AI profits. All but one, of course.
There is something obviously contrarian in Apple's strategy. Perhaps it's not Apple that is odd but rather there is groupthink on behalf of the others. The question of who's right will rest on whether it turns out that AI is going to commoditize quickly or perhaps never, whether AI turns out to be modular or integrated, whether AI exhibits disruptive or sustaining competitive responses, whether it's an infrastructure subject to regulatory corrosion or whether it will migrate to the edge and iterate freely, whether it's a new experience or simply better existing experiences, whether it creates new markets or just makes existing ones more efficient.
These are not new questions. They have been applied to all software and hardware innovations of the last 40 years. We have a lot of history to inform us.