Asymco

Asymmetric Intelligence

cash flow

  1. The problem with the P/E ratio

    Research · 1 comment

    Why the most common measure for valuation is inadequate in an age of AI

    Software and services companies like Google, Microsoft, Amazon, Meta are spending on Capital Expenditures at the rate of heavy industry manufacturing. This defies their description as "asset light" business models which depend on services, distribution or platform economics.

    The problem isn't just semantic. It is that for their entire existence, these companies were valued for their profitability and measured in terms of a P/E ratio and earnings growth. The situation has changed dramatically. Their revenues are up, the earnings are up and growth is up and share prices are way up. But not their P/E ratios. Why is this?

    Consider the graph below showing the (forward) P/E ratios of the Dot Com market leaders vs. the market leaders today.
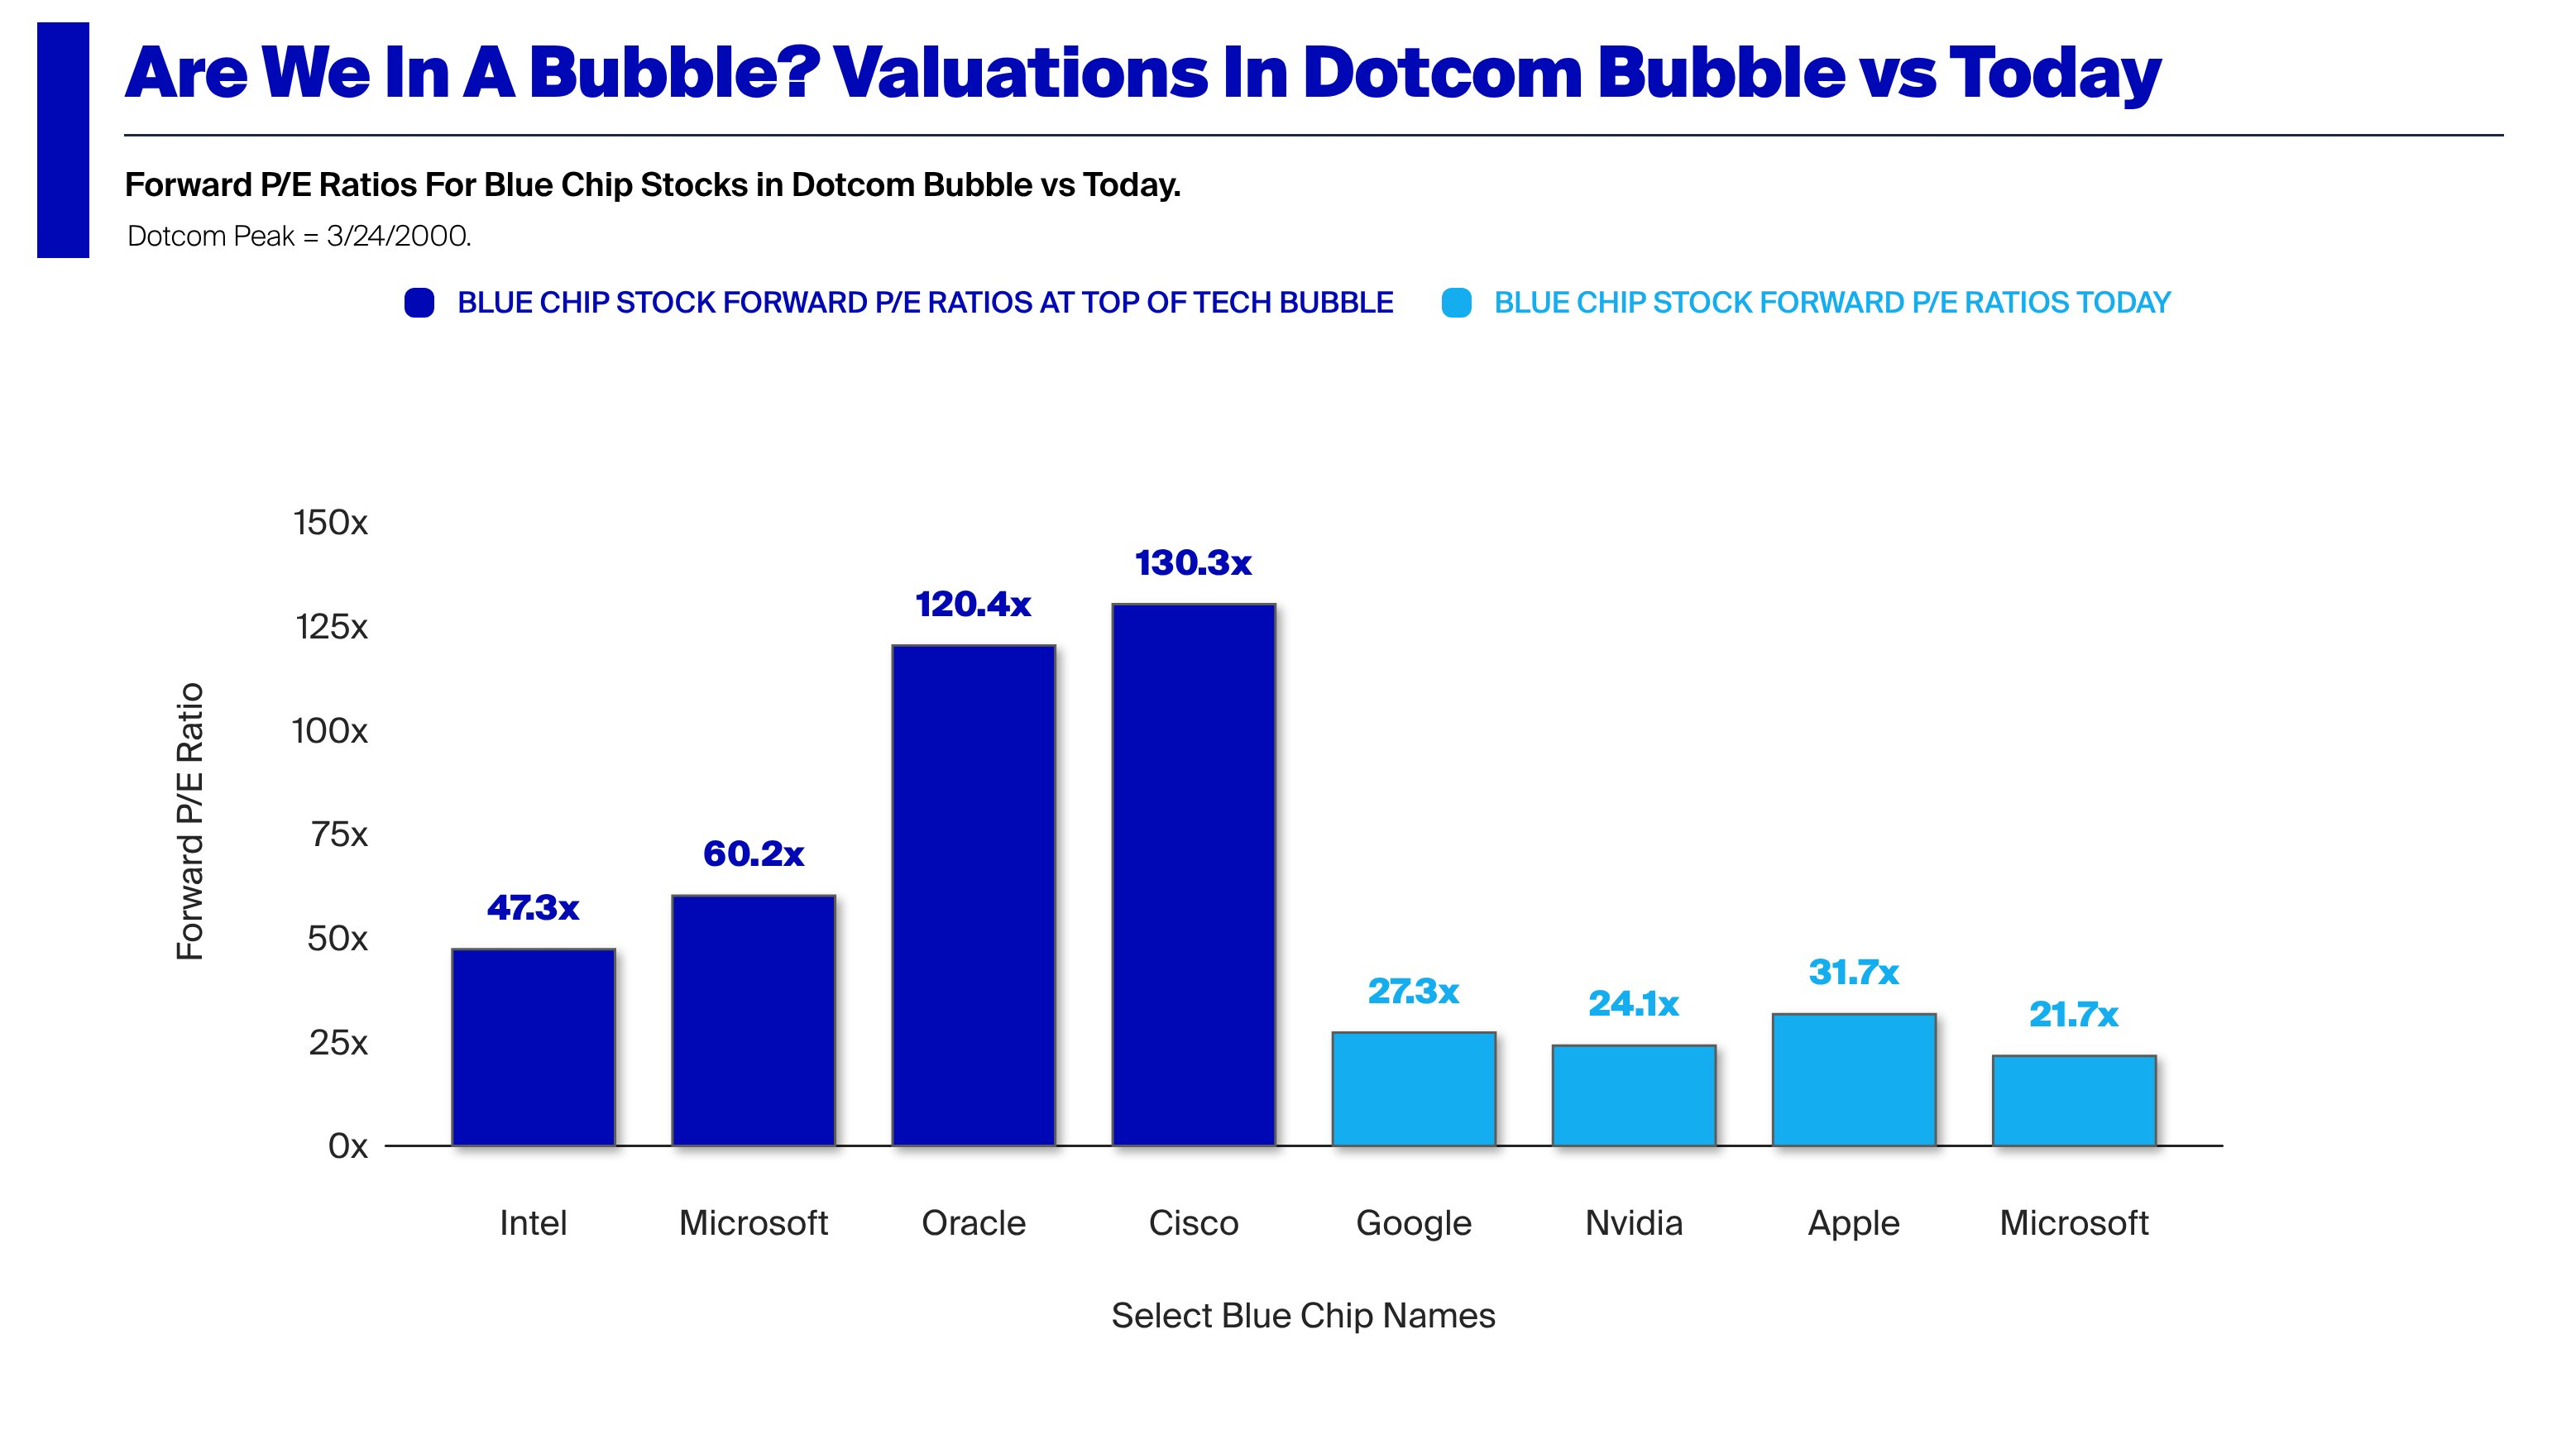
    This even as share prices and value concentration have risen even faster than in the Dot Com era. Seen from the P/E basis, it does not look like we are in a bubble. Earning growth is way up so the share prices are not outrageous on that basis. That is contrary to 1999 when P/E ratios in the hundreds were considered normal. Expectations of an internet fueled boom were speculative. Expectation of an AI earnings boom seem well founded.

    But these companies could still be over-valued. The P/E ratio is not the full picture. It is in fact a simplifying shortcut which ignores significant pockets and omissions of value.

    For this analysis I'll use a sample including some of the largest market caps in the world with two exceptions. The exceptions are Lilly (LLY), Berkshire Hathaway (BRK-B) which are on the list but not in the top 10 (though in top 15) and Saudi Aramco and Broadcom which are in the top 10 but not on the list[1].

    CompanyMarket Cap
    NVDA$5,709,746,405,376
    AAPL$4,379,916,369,920
    GOOG$4,811,891,146,752
    MSFT$3,041,424,048,128
    AMZN$2,874,514,866,176
    TSM$2,166,463,135,744
    TSLA$1,664,912,326,656
    META$1,569,837,154,304
    BRK-B$1,044,046,610,432
    LLY$897,716,060,160

    The following diagram shows the P/E ratios of the sample relative to the top 100 US market caps[2]. Note that, with one exception, the companies are not in the dark red zone with above P/E of 60. The exception is, of course, Tesla, which, at P/E of 400+ is 14x the average multiple.
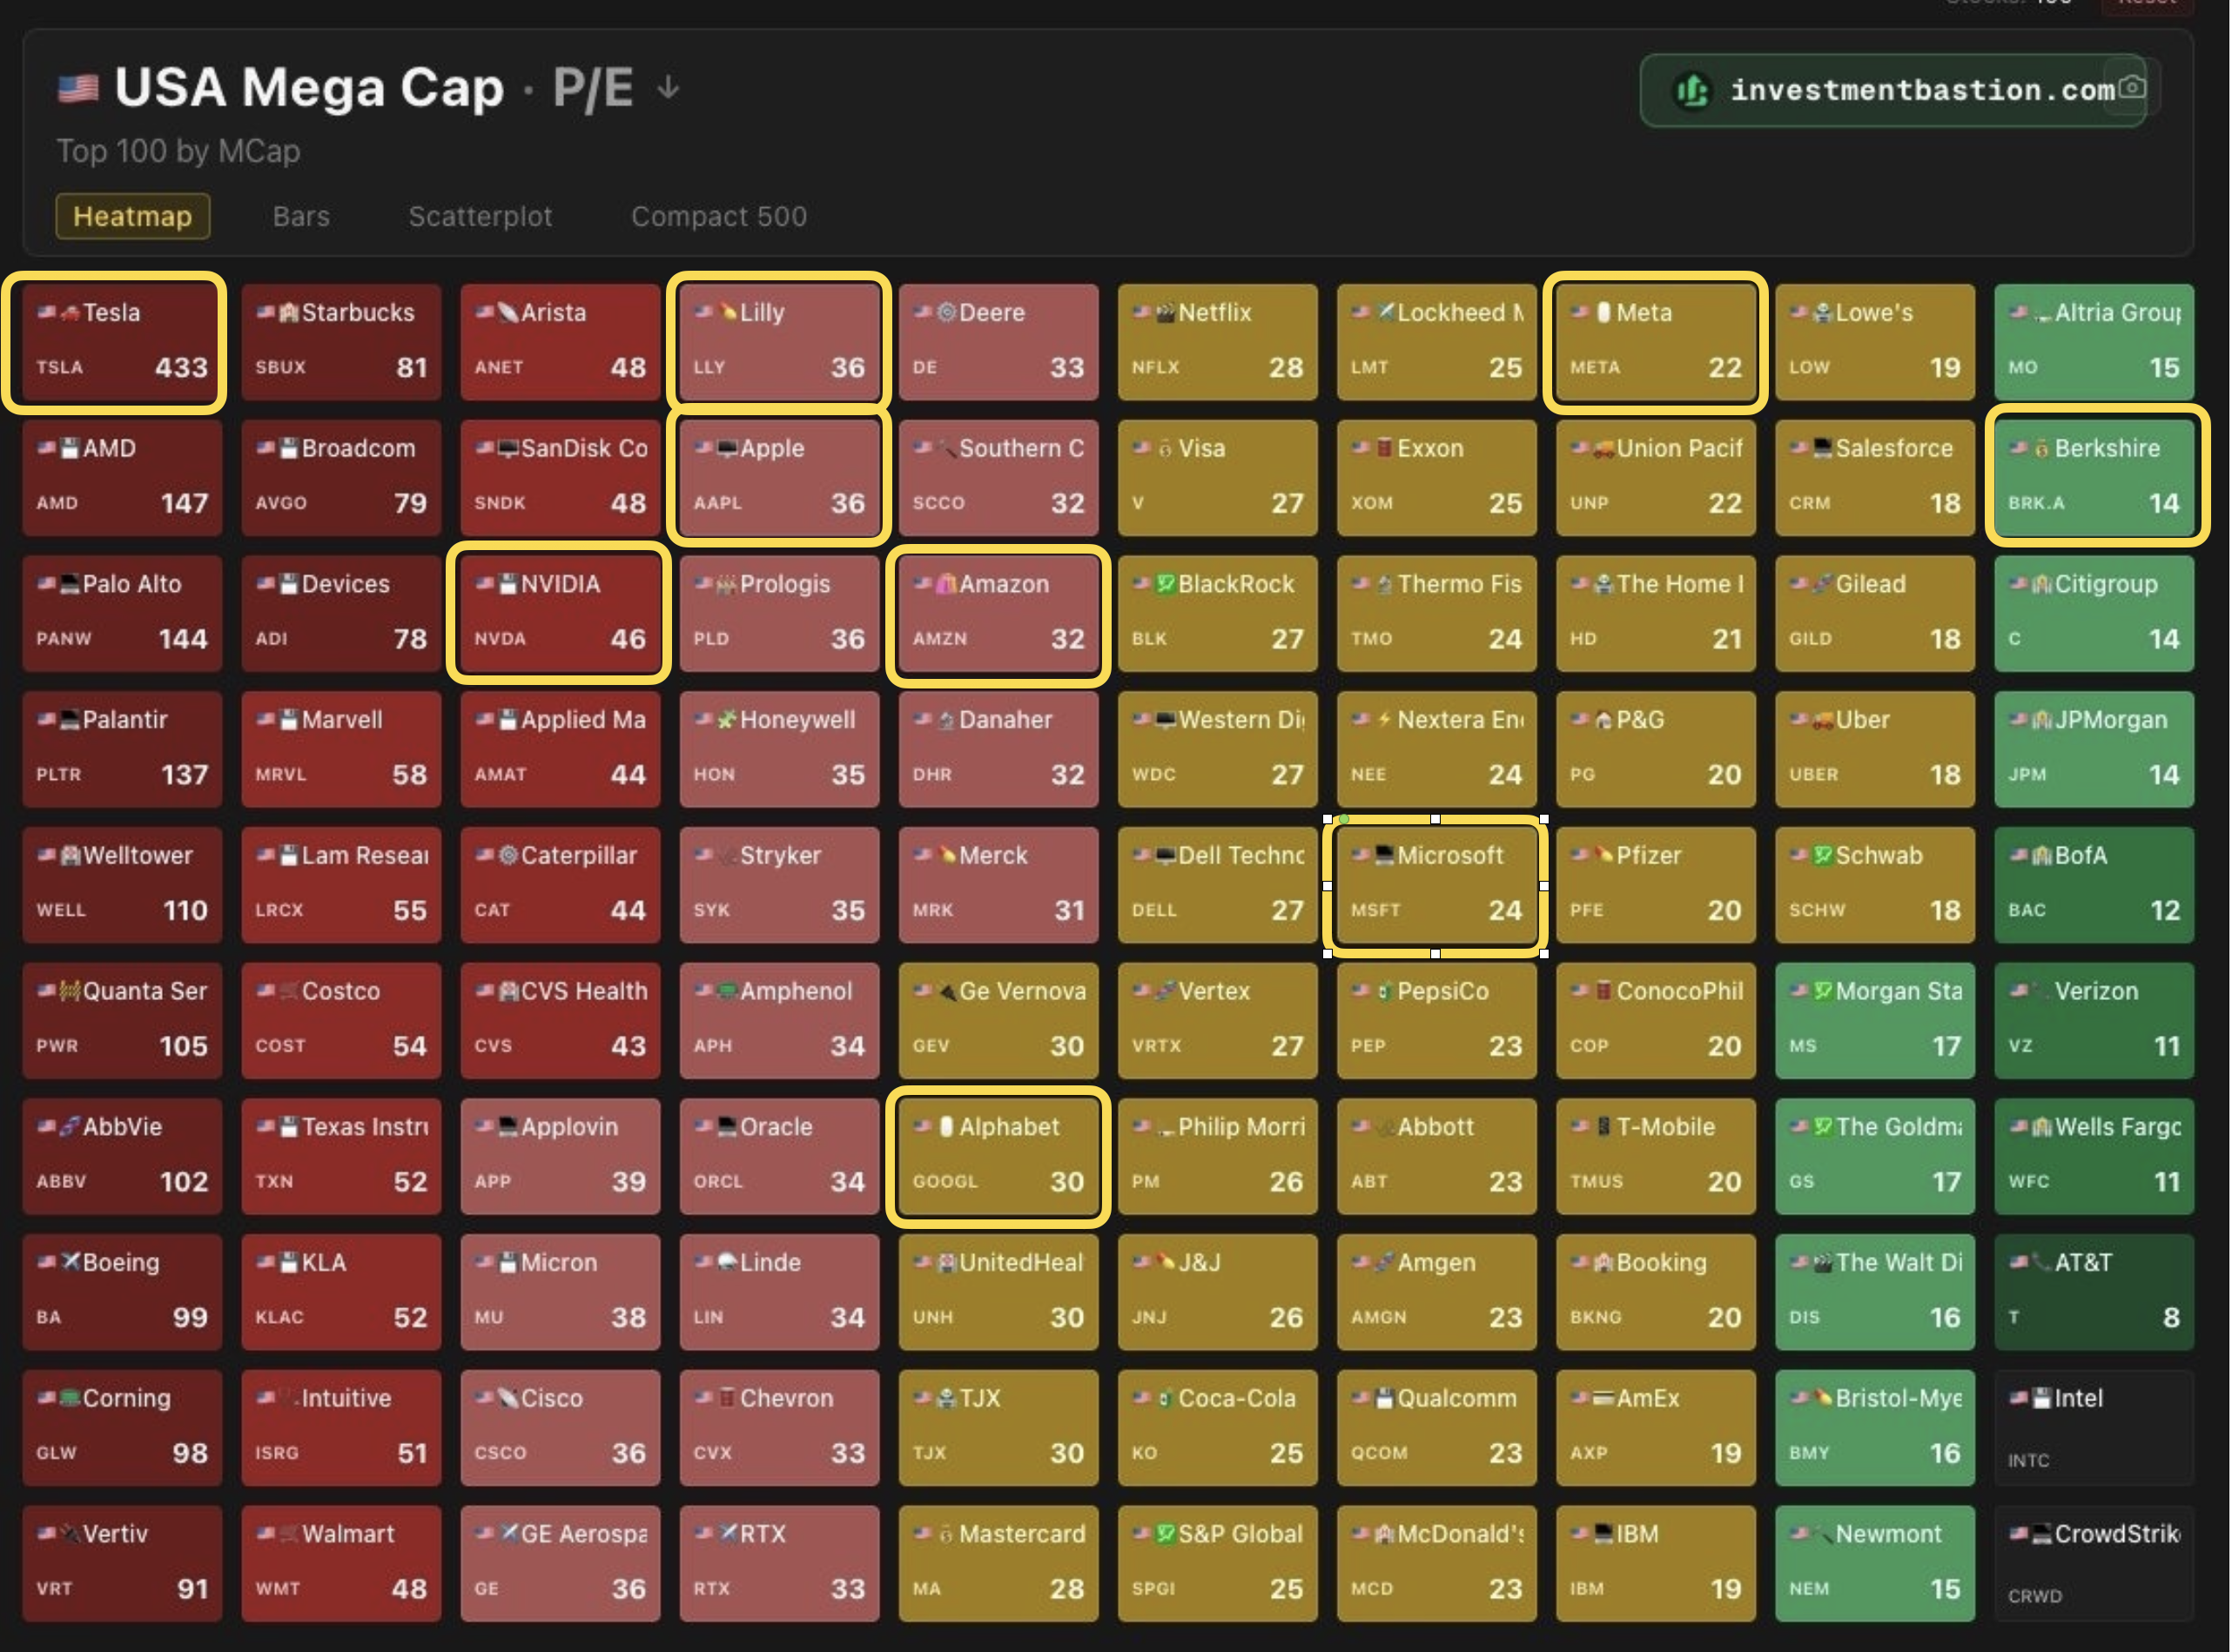
    Moreover, compared with the S&P 500, these P/E ratios are in-line with the median. The following graph shows the sample set with P/E ratio vs. Market Cap.
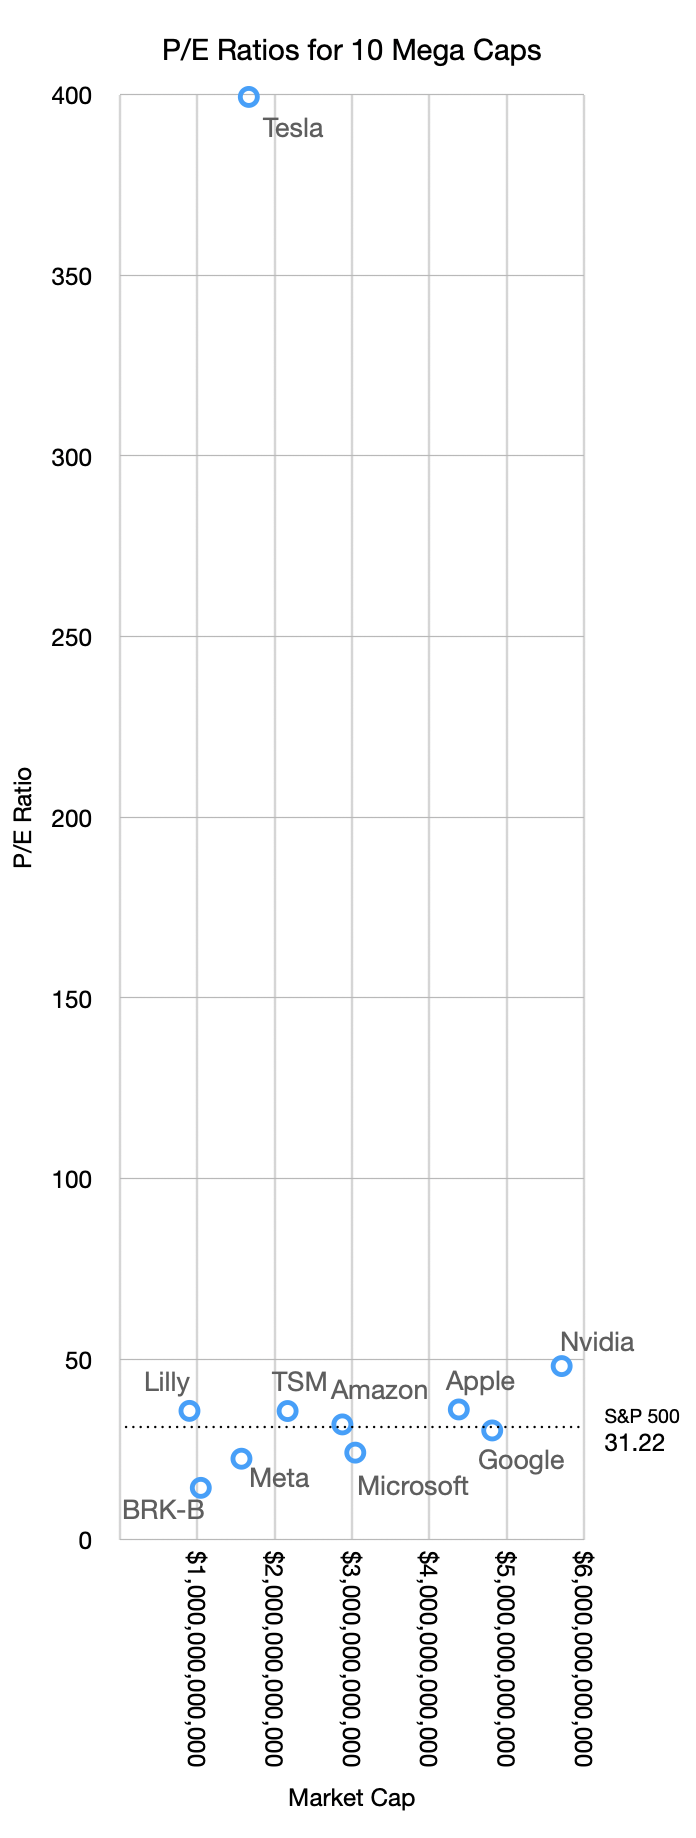
    Excluding the one anomaly the relationship seen is that higher market caps roughly correspond to higher P/Es. Nvidia has a market cap over $5.7 trillion with a P/E of 48 while Meta has a market cap of $1.5 trillion and a P/E of 22.5.

    Higher P/Es should also correspond to higher growth rates. The graph below shows the relationship between P/E and growth, both in the most recent quarter (MRQ) and trailing twelve months (TTM).
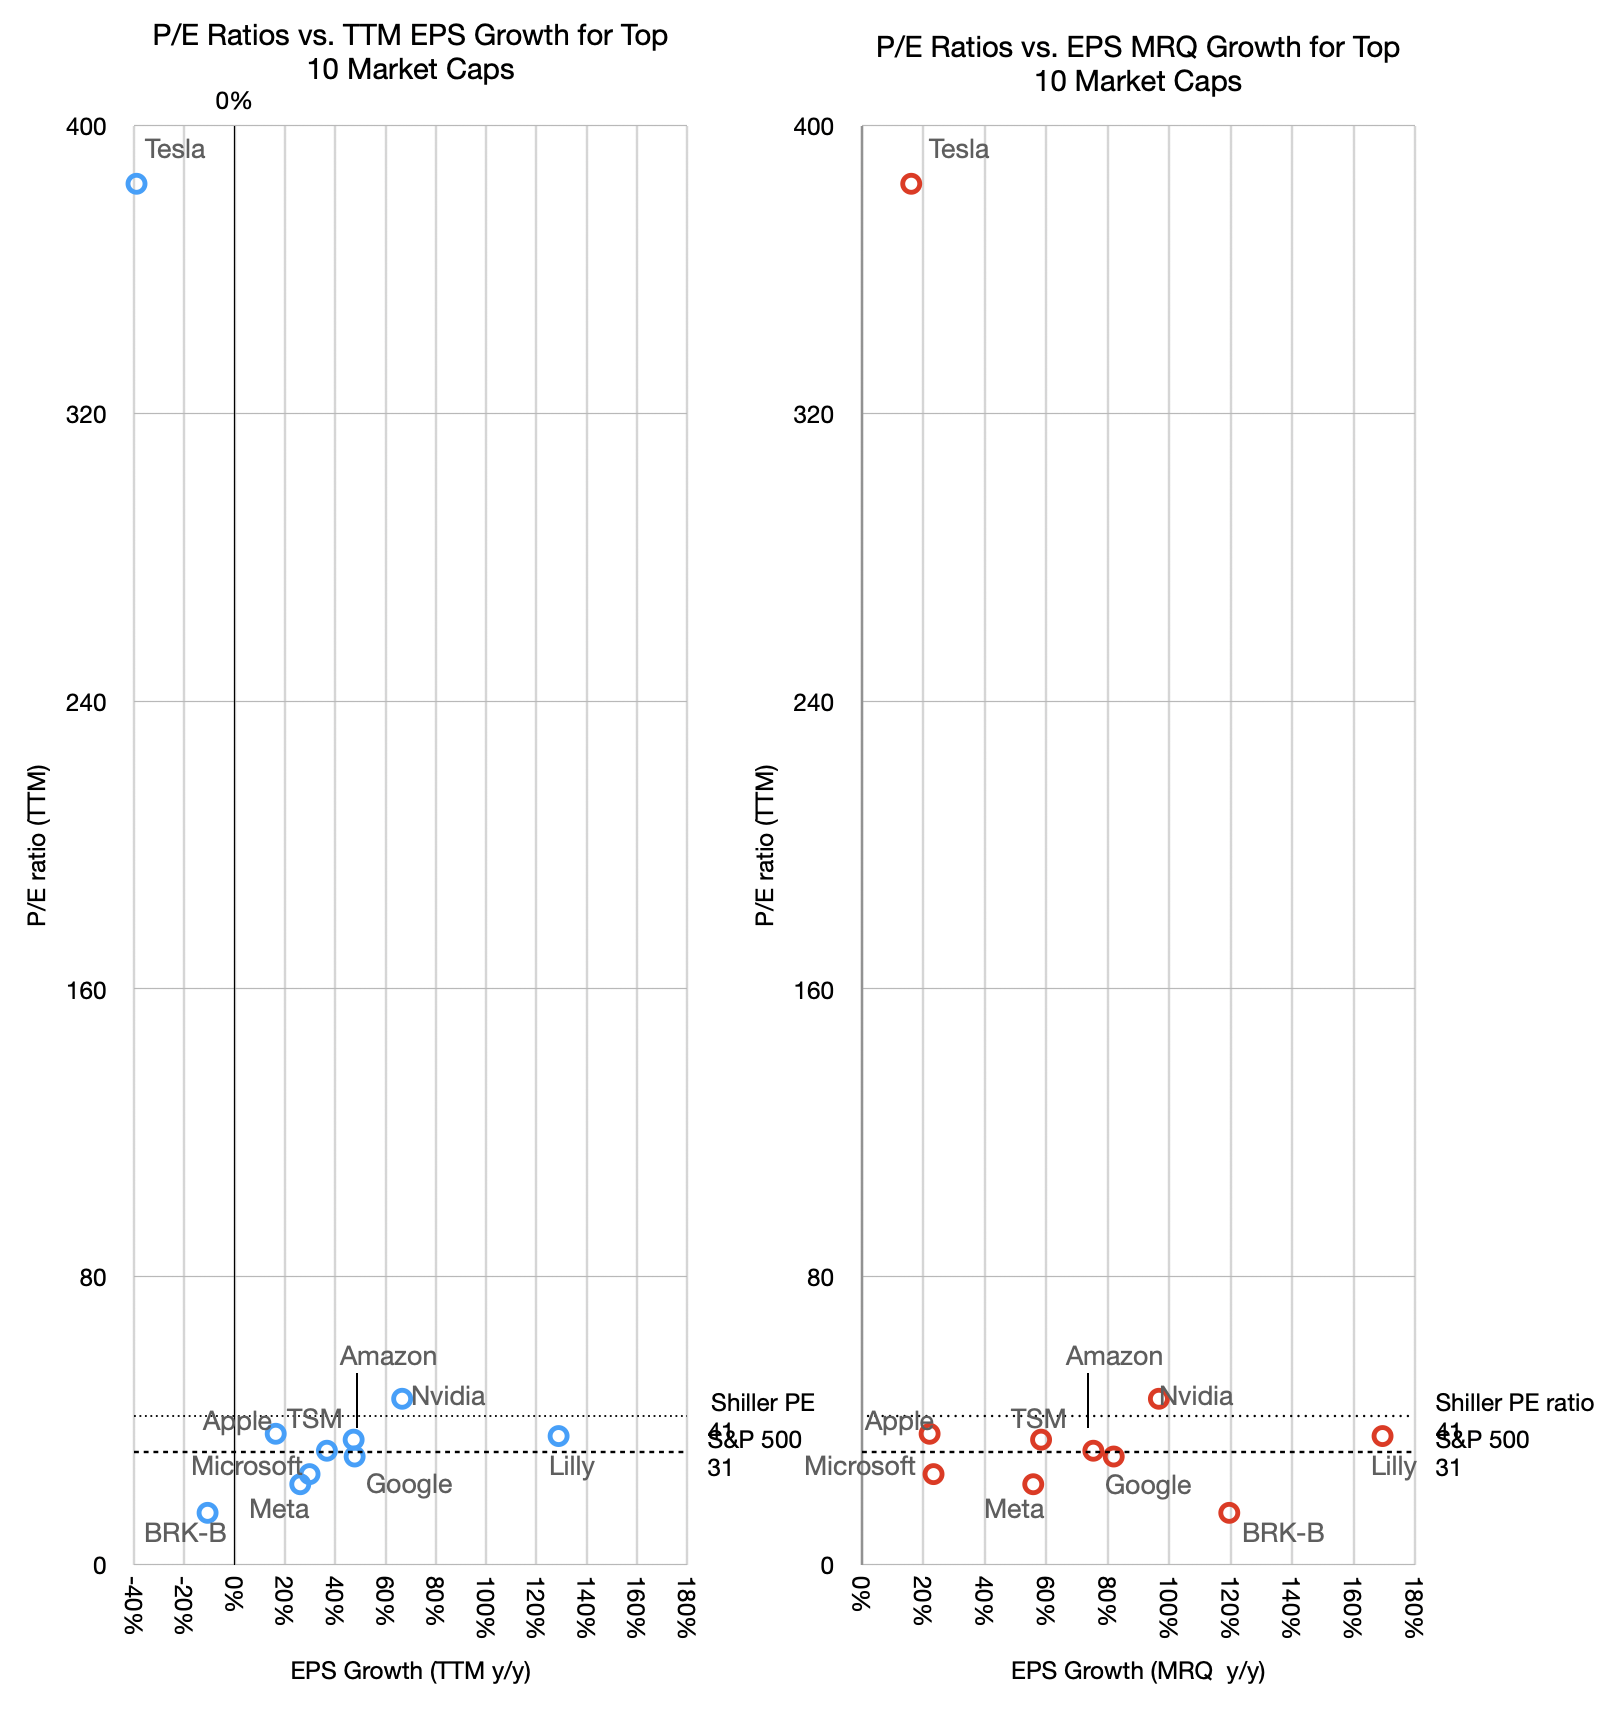
    There is a loose relationship between P/E and TTM growth but not with last quarter's growth. The one anomaly is even more prominent as it shows negative growth with exceptional valuation. Fundamentally however the relationship between P/E and growth is weak. Companies having widely divergent growth show similar P/E ratios. Alphabet for example has seen its P/E ratio in the 20s with growth in the 80s TTM and 50s MRQ.

    This might sound familiar. From 2008 to 2020 Apple was trading at a P/E ratio in the teens and low 20s while growing as fast as 80%. The logic was captured by my analogy of the goose that lays the golden eggs. Apple was able to create extraordinary products but the market considered such hits fleeting. It valued consistency over heroism. Getting on base vs. home runs. And so the P/E began to rise only once Services became more prominent. Regardless of how foreseeable this pattern was, it took a decade and is still ongoing for the pricing to catch up.

    But the situation with AI companies (that is, all the big tech companies but Apple) is that their earnings today are somewhat an illusion.

    An old maxim that says "earnings are an opinion while cash flow is a fact.[3]"

    This is because Net income can be manipulated by accounting abstractions, whereas cash flow is based on bank transactions.

    To wit: Net income (earnings) is calculated using accrual accounting, which relies heavily on judgment calls rather than bank balances. Companies recognize revenues the moment a contract is signed, even if the cash won't be collected for months. Or they can dial in a delay as they desire.

    Because of varying accounting policies, two identical companies with the exact same physical business can report vastly different earnings figures.

    Cash flow is objective and simply tracks the actual movement of money in and out of the business. Real dollars either enter the bank account or they don't. A company can look highly profitable on an income statement but still go bankrupt if its cash is trapped in unpaid invoices or unsold inventory.

    Finally, cash flow can be strongly negative while earnings are strongly positive. This is because investment in capital equipment does not appear in the income statement.

    Therefore true economic value is determined by the cash a company can actually distribute or reinvest rather than how it declares profitability based on accounting abstractions.

    AI companies are not necessarily hiding behind suspect earnings but their extraordinary capital expenditures are draining their cash and thus what investors have access to.

    Earnings seem to be soaring so the ratio P/E suggests a modest valuation. This is based on opinion or at least incompleteness.

    We should look at a better indicator. It's the EV/FCF ratio. We will look at this next.

    1. The top 10 ranking can change rapidly and it makes analysis difficult over longer time periods. The inclusion of LLY and BRK-B allow for visibility outside of the tech sector and they were in the list mid 2025. Saudi Aramco is in a completely different environment influenced by non-economic factors.
    2. TSMC is absent from the table as it is US only companies. It is notable perhaps that of the top 15, three are not US companies (TSMC, Samsung and Saudi Aramco). Furthermore the top Chinese company, Tencent is 25th, valued at $532 billion and the top European company is ASML at 21st and $610 billion.
    3. Attributed to economist Alfred Rappaport.
  2. Asymetric Episode 137 — E is Our Friend

    Asymetric Podcast

    Horace speaks carefully and with knowledge about opinions, facts and fantasies, and shares what he thinks John Ternus’s most important job is.

    Topics include:

    • Is a crash coming? 
    • The CapEx problem
    • AI and Apple
    • Convergence vs. fragmentation
    • Ternus and Apple's culture

    Now in Beta for asymco one subscribers

    Listen to Asymetric in your favorite podcast app.

  3. Apple FQ2 2026 Earnings Call: Live Commentary by Horace Dediu

    Office Hours · 1 comment

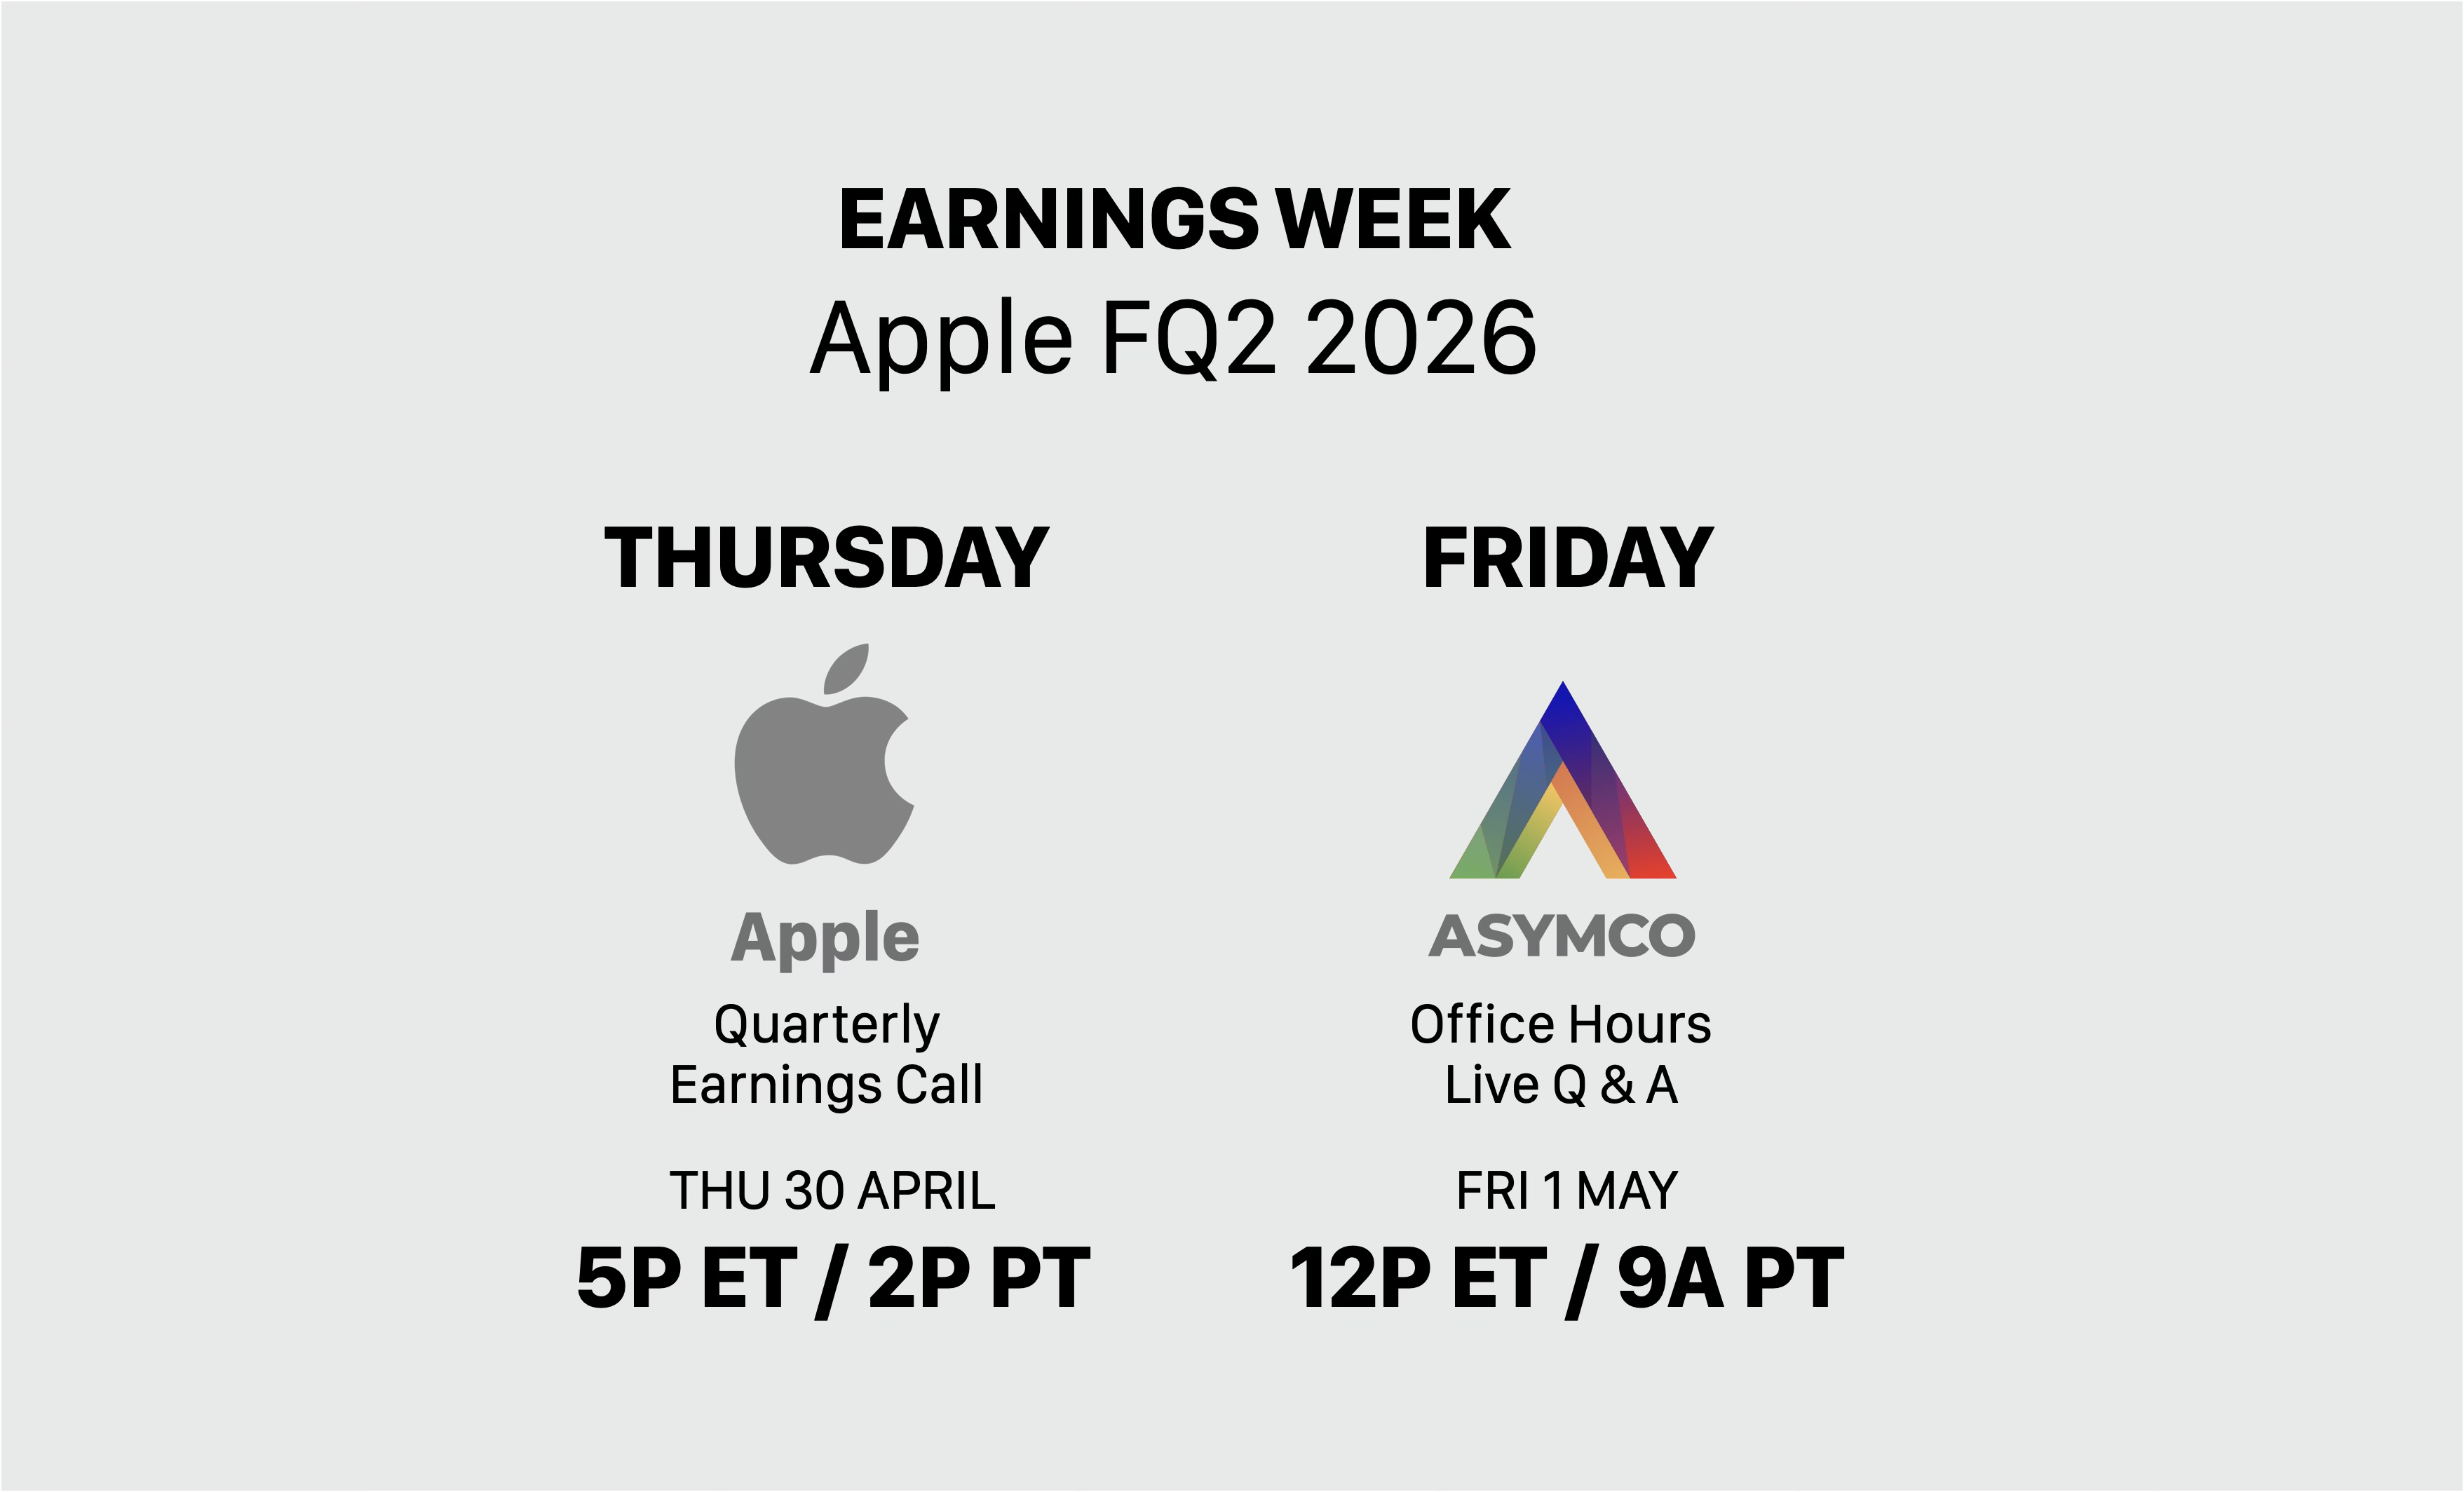
    Below are Horace's live commentary during the release of Apple FQ2 2026 Earnings, lightly edited. For an in-depth look, and a discussion of what turned out to be a record-breaking quarter, join uss at Asymco Office Hours: Apple Live Q&A.

    Transcript: Friday 30 April 2026, 4:30pm-6pm EST | asymco@mastodon

    Apple will release earnings at 4:30PM ET and conference call begins half hour later and lasts for one hour. I will try to make some comments as I process the news. This might be the 75th Apple conference call I listen to.

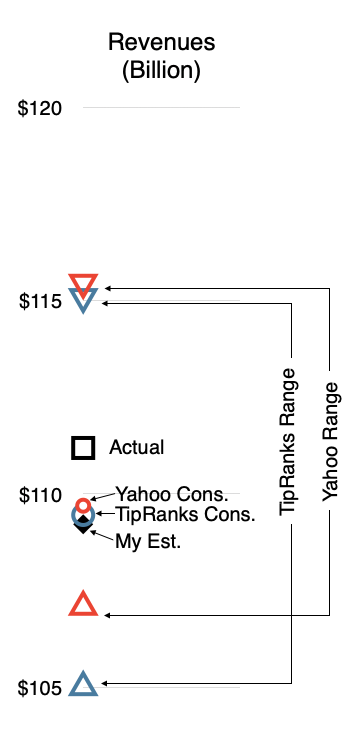
    My estimates: EPS $1.98 Rev. $109.2b iPhone Rev 55.716684 Mac Rev 8.640 iPad Rev 6.9552 Wearables & Home Rev 7.522 Services Rev 30.3753

    iPhone revenue came in at $56.99 billion. My estimate was $55.71b.

    Here is a graph of the expectations vs. actual Revenue results.

    Image (files.mastodon.social)

    iPhone revenues grew 22%. Extraordinary. The growth barely slowed from 23% the previous quarter.

    Mac revenue growth was 6%. Slightly less than I expected.

    Revenues were up 17%, earnings per share were up 22%.
    Best March quarter ever.

    The board of directors has declared a cash dividend of $0.27 per share of the, an increase of 4 percent. Repurchase program authorized for up to $100 billion for the next 12 months. No surprises here.

    Greater China growth was 28%.

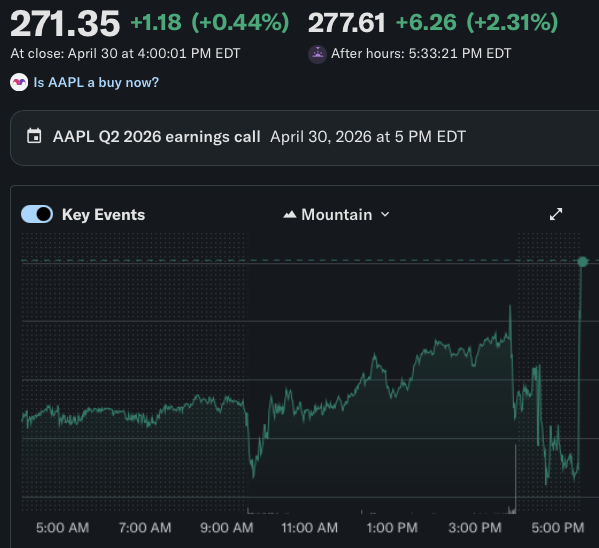
    Apple shares are down 0.6% after-hours. Normal drop when company beats on the top and bottom. The big drop comes when the CFO talks guidance.

    John Ternus will join the call for a few remarks.

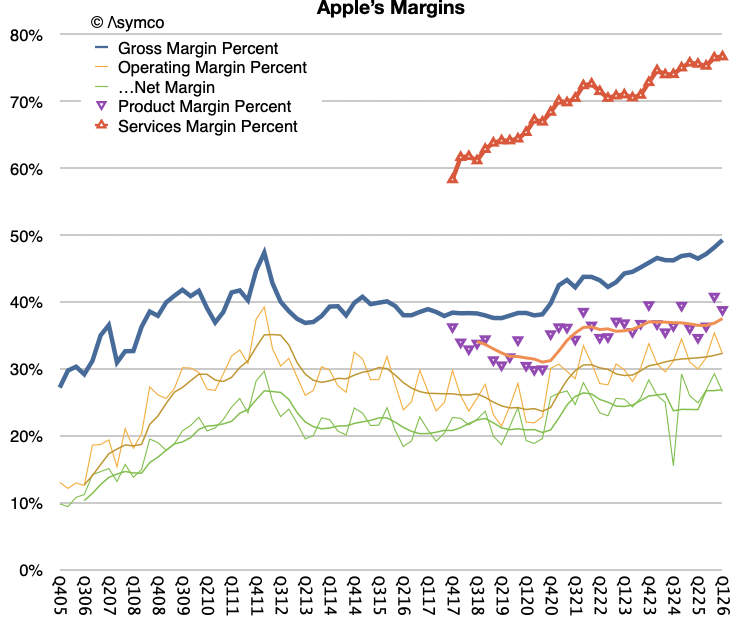
    Gross margin came in at a record high of 49.3%. This is three months after the great memory panic of 2026 was declared.

    Shares fall 0.81% after John Ternus remarks.

    Apple reports double digit growth in every emerging market.

    Mention of Mac Neo leads to more drops in the share price as the pain of share growth sinks in. Now down 1% after hours.

    iPhones went to the moon, stock not mooning.

    “Our strong business performance during the March quarter generated over $28 billion in operating cash flow and drove new March quarter records for both operating cash flow and EPS,” The fact that Apple did not turn over this cash flow t...

    5% in Wearables and Home. Modest growth is shameful growth. Compounding shompounding.

    Apple has 6 stores in India. So much more to do there.

    Supply constraints mean that the growth could have been higher —CFO.

    Active iPhone install base grew to all-time high. (No surprise). Customer satisfaction was 99% for iPhone 17 in the US.

    Customer satisfaction for Mac was 97%.
    Half of customers buying an iPad are new to the product. Most of these new customers are in emerging markets.
    Customer sat for iPad at 98%.

    Tap to pay (Apple Pay) now in 50 markets.

    Net cash was $62 billion. No longer placing net cash neutral as a target!!!! OMG OMG.

    June Q guidance: 14% to 17% growth. Shares recovered to +1.35%.

    Margin guidance: 47.5% to 48.5%. Despite the great memory panic of 2026 being in full effect.

    Shocked, shocked, shocked that CFO remarks did not crash the stock.

    Image (files.mastodon.social)

    Several months to reach Mac supply demand balance. Neo and Studio constrained.

    Net cash neutrality question and comments. Returned over $1 trillion so far. Another $100b allocated so they are still committed to that.

    Shares now +4% in AH but not at record high.

    Margins synopsis.

    Image (files.mastodon.social)

    Tim says they did see higher memory costs. For the June quarter they expect significant higher memory costs and more beyond that. Still, margins are brilliant.

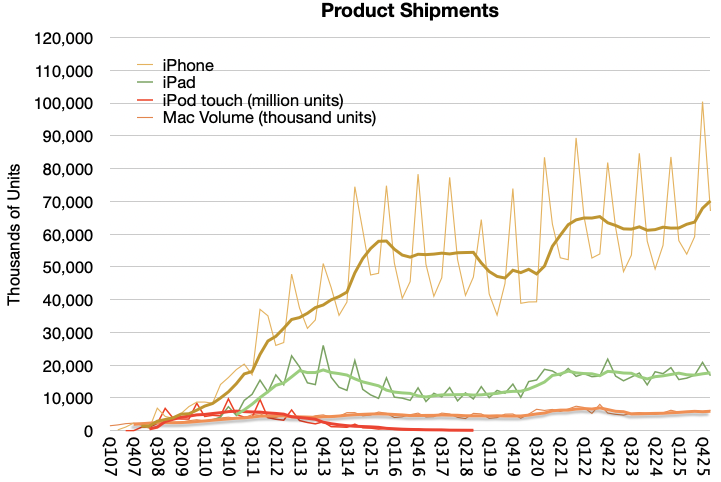
    My estimates for unit shipments for Products.

    Image (files.mastodon.social)

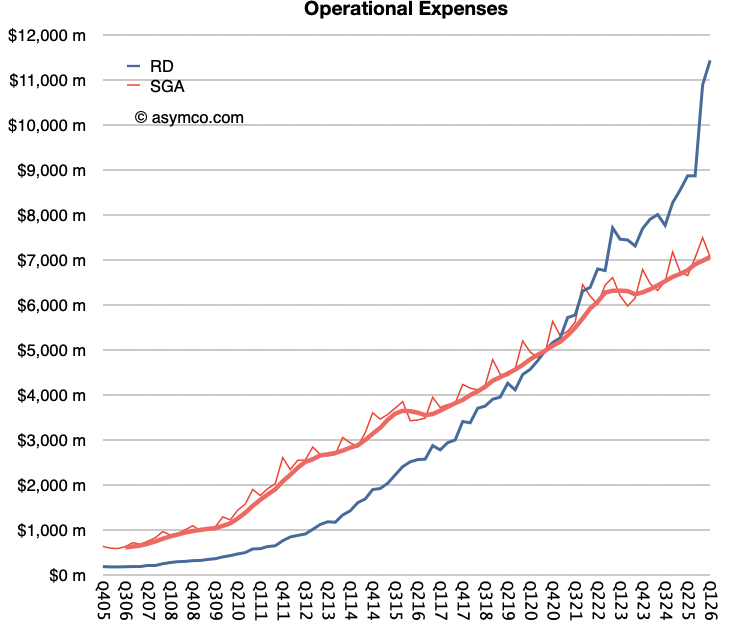
    Look at that R&D.

    Image (files.mastodon.social)

    Any tariff refunds will be re-invested in US production or operations (beyond existing commitments.) —Tim the Enchanter.

    India: low share is an opportunity; large middle class growing. I see no reason why it's not an equal opportunity to that of China.

    That' a wrap. See you during the Office Hours tomorrow.

  4. Valuation in a time of AI

    Research · 1 comment

    Cash flow is a fact, earnings are an opinion and share price is a dream.

    A company's total worth is the number of outstanding shares multiplied by their value. This product is called the market capitalization or Market Cap.

    That's a simplification. If you want to be more accurate, you should take the Market Cap and net out cash and debt--these are not part of the future flows of cash that can benefit shareholders.

    More precisely, there is another measure called the Enterprise Value (EV) which is the total price tag of a company, representing what it would cost to buy the entire business and pay off its debts. EV = Market Cap + Total Debt + Preferred Stock + Minority Interest - Cash and Cash Equivalents.

    This is the precise and complete measure of the firm's value but we use the shortcut of Market Cap since In most cases the Preferred stock and minority interest are negligible and if cash equals debt then the result is EV =~ Market Cap. it's easier to calculate anyways as the shares outstanding and share price are easily available. Not so for EV.

    To get a sense of how much you're paying for the company it makes sense to divide the Market Cap by the company's Earnings so you get an idea of how many years it will take to get back your investment. When dividing both Market Cap and Earnings by the number of shares it becomes the famous P/E ratio or Price per share / Earnings per share.

    But if you want to be fully precise, instead of using Market Cap you should use Enterprise Value. In that case the denominator should be Free Cash Flow or FCF[1]. The ratio becomes EV/FCF. Free Cash Flow is a better measure than earnings because it takes into consideration depreciation, change in working capital and capital expenditures. It measures the actual cash a company generates after paying for its operating and capital expenditures.

    EV/FCF takes into consideration unusual situations such as huge amounts of cash or debt or capital expenditures which removes shareholder access to what the company "earns" on paper. This why the adage of "earnings are an opinion but cash flow is a fact" exists.

    I used EV/FCF years ago to value Apple because at a time when it held huge amounts of cash. This was before it began aggressively reducing its cash through its capital return program. The P/E ratio at the time was very low but excluding the cash, it was even lower. It was a huge red flag indicating that the company was being priced for liquidation, or as some analyst put it, priced like a steel mill going out of business. If at that time you did not believe that its demise was imminent you would have surely been richly rewarded.

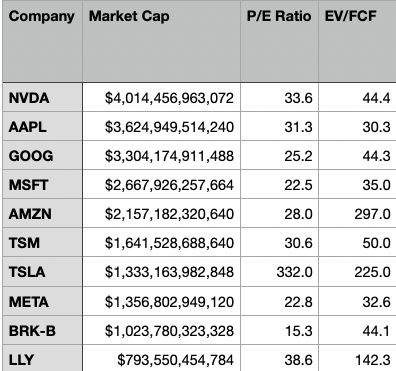
    Today the anomaly that throws the P/E off is not Cash but CapEx. And it's not for Apple but for the other mega caps or AI "hyper scalers". Without worrying who is or isn't in the "Magnificent 7" I compiled the largest 10 market capitalization companies and looked at their P/E and EV/FCF ratios. At time of writing:

    CompanyMarket CapP/E RatioEV/FCF
    NVDA$4,014,456,963,07233.644.4
    AAPL$3,624,949,514,24031.330.3
    GOOG$3,304,174,911,48825.244.3
    MSFT$2,667,926,257,66422.535.0
    AMZN$2,157,182,320,64028.0297.0
    TSM$1,641,528,688,64030.650.0
    TSLA$1,333,163,982,848332.0225.0
    META$1,356,802,949,12022.832.6
    BRK-B$1,023,780,323,32815.344.1
    LLY$793,550,454,78438.6142.3

    As recently as six months ago, there was a lot of talk about an AI bubble. Back then I looked at the data then and by looking at the P/E ratios convinced myself that the valuations were not "bubble" level. They were in the mid-thirties. These were not historical high especially when considering the growth these companies were experiencing (over 30%). Since then prices have come down significantly.

    This is as the CapEx elephant in the room has been making itself known and there is renewed alarm at the scale of capital spending. This is reflected in the EV/FCF number but not in the P/E number.

    The table above shows how much more elevated the EV/FCF ratio is relative to P/E for many of the companies. This "truer" measure of what you are paying as a share buyer is now reflecting in reduced share price and hence reduced P/E.

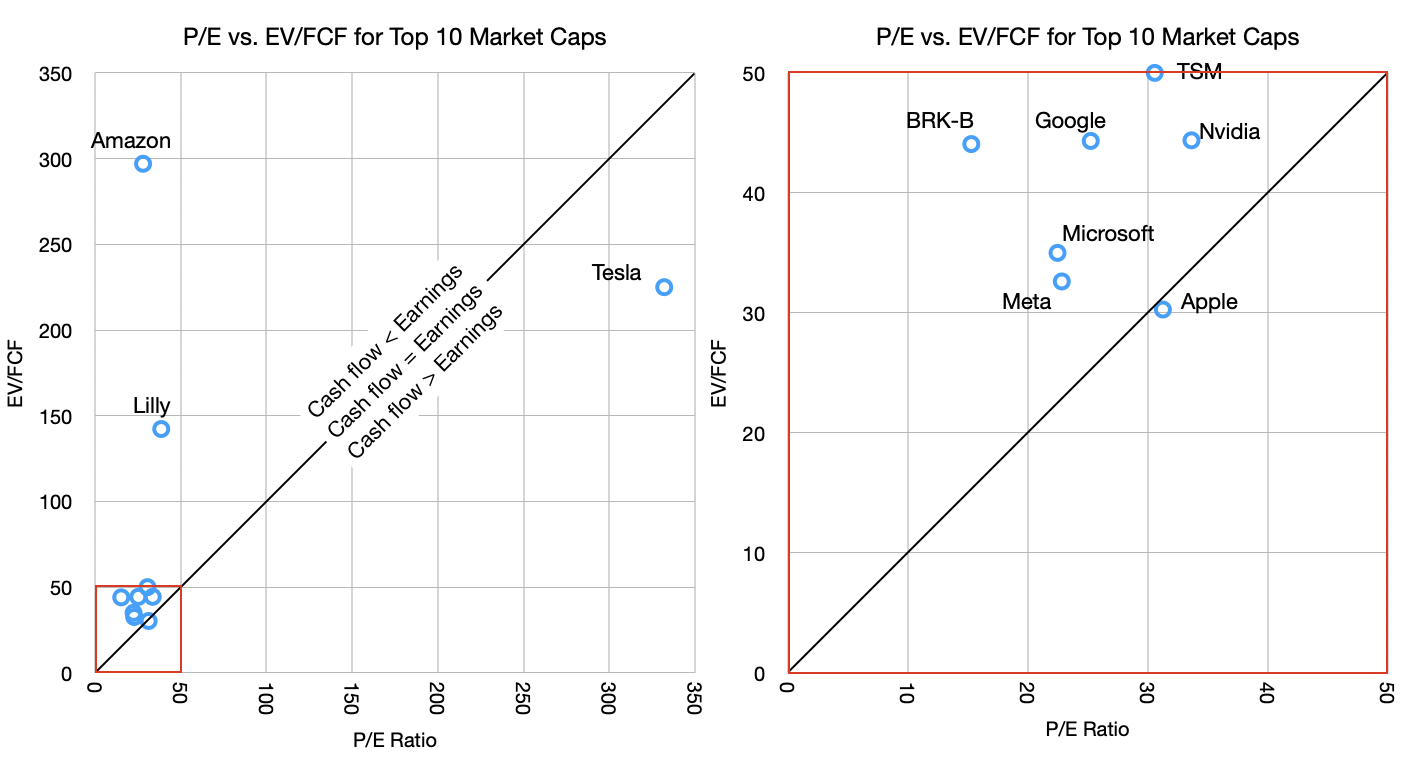
    Of course, this is not true for Apple. Apple's P/E ratio and EV/FCF are nearly identical. To see this more clearly I put together these graphs.

    Valuation in a time of AI

    The graph shows the P/E vs. EV/FCF for the companies in the table. The graphs are the same data but the one on the right is zoomed in on the lower left corner (note the red squares).

    The reason for the zoom is that there are three outliers. Tesla, Amazon and Lilly. Tesla has absurd valuation on both P/E (300 to 400 range in last 6 months) and EV/FCF while Amazon has an outrageous EV/FCF value due to abnormal capital spending. Basically, Tesla has negligible earnings (and negative growth) while holding astronomical share price and Amazon is spending far above its median on CapEx. Amazon's 10-year EV/FCF is much lower, at approximately 55.

    But let's ignore the outliers and concentrate on the other seven in the cluster. These are below 50 P/E and 50 EV/FCF thresholds.

    Note that I drew a diagonal line representing the equation of P/E = EV/FCF. This should, under normal circumstances, hold for most stocks. Just like Market Cap should roughly equal Enterprise Value so Earnings should equal Free Cash Flow.

    Most companies should not stray too far from this line. But what we are seeing, with the notable exception of Apple, is that most tech companies have cash flow far below earnings. This is again due to the CapEx elephant.

    The argument goes that this is a temporary situation with that capital being wisely deployed for returns from AI. Presumably, these companies will swing to the other side of the line, where cash flows will exceed earnings, compensating for the capex that was denied to the shareholders.

    This is where the old adage comes into play: Earnings are an opinion but cash flow is a fact. I added to that "and share price is a dream". Take the free cash flow and multiply it by a "dream" and you get the price the market sets. This dream is the multiple.

    What makes the AI "bubble" interesting is how it's not fueled by debt[2] but by cash flow. Companies are turning over large portions (almost all and sometimes more) of their cash flows to investing in the dream of AI profits. All but one, of course.

    There is something obviously contrarian in Apple's strategy. Perhaps it's not Apple that is odd but rather there is groupthink on behalf of the others. The question of who's right will rest on whether it turns out that AI is going to commoditize quickly or perhaps never, whether AI turns out to be modular or integrated, whether AI exhibits disruptive or sustaining competitive responses, whether it's an infrastructure subject to regulatory corrosion or whether it will migrate to the edge and iterate freely, whether it's a new experience or simply better existing experiences, whether it creates new markets or just makes existing ones more efficient.

    These are not new questions. They have been applied to all software and hardware innovations of the last 40 years. We have a lot of history to inform us.

    Join me as we learn.

    1. To calculate FCF, look at the Income statement, start with earnings before interest and taxes (EBIT), add depreciation, subtract taxes and CapEx.
    2. There is some debt of course, but the scale is so immense and the risks so high that most lenders would not touch this type of investment.
  5. Melius highlights FCF while reiterating buy on Apple

    Nota Bene · 3 comments

    Measuring valuation in an era of AI.

    “Given Apple’s free cash flow and we are about to embark on one of its most lucrative product rollouts since the big screen iPhones in 2014 - there is a case for Apple’s stock regaining some ground,” Melius analysts wrote in a note to clients.

    Lately, Apple has announced the iPhone 17e and a refreshed iPad Air, a new MacBook Air, a MacBook Pro, new Studio Displays, the MacBook Neo, and an updated version of its over-the-ear headphones, the AirPods Max 2.

    Apple shares were modestly higher in premarket trading but have lost some 8% year-to-date. Over the past 12 months, shares have gained 12%.

    Source: Seeking Alpha

    NB: Free cash flow (FCF) is the amount by which a business's operating cash flow exceeds its working capital needs and expenditures on fixed assets (known as capital expenditures). It is that portion of cash flow that can be extracted from a company and distributed to creditors and securities holders without causing issues in its operations. As such, it is an indicator of a company's financial flexibility and is of interest to holders of the company's equity, debt, preferred stock and convertible securities, as well as potential lenders and investors. It has come recently into vogue when the bill for AI infrastructures has come due...

    The table above shows the P/E ratios vs. the EV/FCF ratios of the top 10 largest market caps in the world.

  6. The most brilliant move in corporate history?

    Research · 4 comments

    An allergy to centralized computing

    Based on Tweets by MilkRoadAI

    The 3rd? most valuable company on Earth watched as its rivals lit $650 billion on fire and did nothing. The biggest cash bonfire in history, by far, eagerly fed by all the usual suspects but one.

    It's either the dumbest or the most brilliant move in corporate history.

    Apple used to be the biggest capex spender, mainly because it paid for most of the property plant and equipment in the factories that made its phones and computers. The so-called tooling or equipment spending plus its leased store renovations and some data centers were costs no other tech giants had and so Apple was an outlier. It was, as I wrote at the time, equivalent to buying a few aircraft carriers every year.

    But that all changed with AI. Amazon is spending $200 billion this year on AI data centers. Google, $185 billion. Microsoft, $114 billion. Meta, $135 billion. Combined: $650 billion. [Not including OpenAI, Anthropic and SpaceX/XAI.] That is like buying the US Navy every year. And yet Apple's capital budget is still a modest $14 billion, oscillating with new hardware tooling cycles.

    Apple is refusing to transfer its cash flow to Nvidia. Curiously, it believes that its cash flow belongs to its shareholders, not to Nvidia's.

    The hyperscalers are now spending 94% of their operating cash flows on AI infrastructure. Amazon is projected to go negative free cash flow this year with as much as $28 billion in the red. Alphabet's free cash flow is expected to collapse 90% from $73 billion to $8 billion. These companies used to be the greatest cash machines ever built. Now they're borrowing money to keep the data center lights on.

    The Big Five raised $121 billion in bonds in 2025 alone. Morgan Stanley projects $1.5 trillion in tech debt over the coming years. For the first time in history, hyperscalers hold more debt than cash. Perhaps this is why their P/E ratios slumped from mid thirties to mid twenties.

    And what are they getting for that $650 billion? AI services generate roughly $35 billion in total revenue or 5% of what's being spent on infrastructure. There are dreams of more of course, but the business models of AI have yet to resonate, especially for consumers.

    Now here is where Apple's bet becomes genius. AI models are commoditizing faster than anyone predicted. Software and hardware both have tendencies to commodify. Protections exist but they have to do with integration and distribution. DeepSeek built a model for $6 million that matches systems costing $100 million. Open source models now power 80% of startups seeking VC funding. The moat these companies are spending hundreds of billions to build is evaporating.

    Apple understood this before anyone else. It didn't build its own AI model, it licensed Google's Gemini for about $1 billion a year. Why spend $100 billion building a factory when outsourcing costs a billion? And if a better model appears next year, Apple just switches vendors.

    But Apple is not sitting still. It just dropped the M5 chip with a 16 core Neural Engine and Neural Accelerators built into every GPU core. It runs 70 billion parameter AI models locally, eventually even on your phone. The M5 delivers 4x the AI performance of the M4 and Apple doesn't need $200 billion in data centers.

    Because Apple turned 2 billion devices into the data center.​ Every iPhone, Mac, iPad gets distributed AI at a scale no server farm can match. While its rivals burn cash, Apple is doing the opposite. $90.7 billion in stock buybacks last fiscal year.​ Its competitors? Combined buybacks collapsed 74% from their peak.​

    Apple didn't miss the AI revolution. It just bet that the winners won't be the ones who build the infrastructure. They'll be the ones who own the customer and no one else on Earth owns the best customers.

  7. Preview of the holiday quarter

    Research · 6 comments

    Every October, at the end of its fiscal year, Apple files its Form 10K or annual report. In this report the company includes a section titled "Capital Assets" which details expenditures for capital equipment. This is last year's entry:

    The Company’s capital expenditures were $14.9 billion during 2017. The Company anticipates utilizing approximately $16.0 billion for capital expenditures during 2018, which includes product tooling and manufacturing process equipment; data centers; corporate facilities and infrastructure, including information systems hardware, software and enhancements; and retail store facilities.

    Note that there are categories of spending detailed and that their order might indicate the degree of such spending, suggesting that product tooling and manufacturing equipment is likely to be the costliest category.

    After this report, during subsequent quarters the company may update this forecast of spending. In the last (third fiscal) quarter the entry was as follows:

    The Company’s capital expenditures were $11.1 billion during the first nine months of 2018 . The Company anticipates utilizing approximately $17.0 billion for capital expenditures during 2018, which includes product tooling and manufacturing process equipment; data centers; corporate facilities and infrastructure, including information systems hardware, software and enhancements; and retail store facilities.

    Note that the forecast of $16.0 billion was updated to $17.0 billion and the first 9 months' expenditures were $11.1. Since there is only one quarter remaining ((and since at the time the quarterly report is filed, only about 2 months remain in the quarter)) it's reasonable to assume that the company's forecasts are more likely to be precise and that therefore the difference between total expected spending and already spent, i.e.f $5.9 billion remains to be spent.

    The actual spending is not recorded quarterly but an approximate value is reported in the Cash Flow statement as "Payments for acquisition of property, plant and equipment". That can be tracked but it does not equal exactly the capital expenditure. For example, the quote above says expenditures were $11.1 billion through first 9 months but the total of all payments for acquisition of PP&E is $10.272 billion.

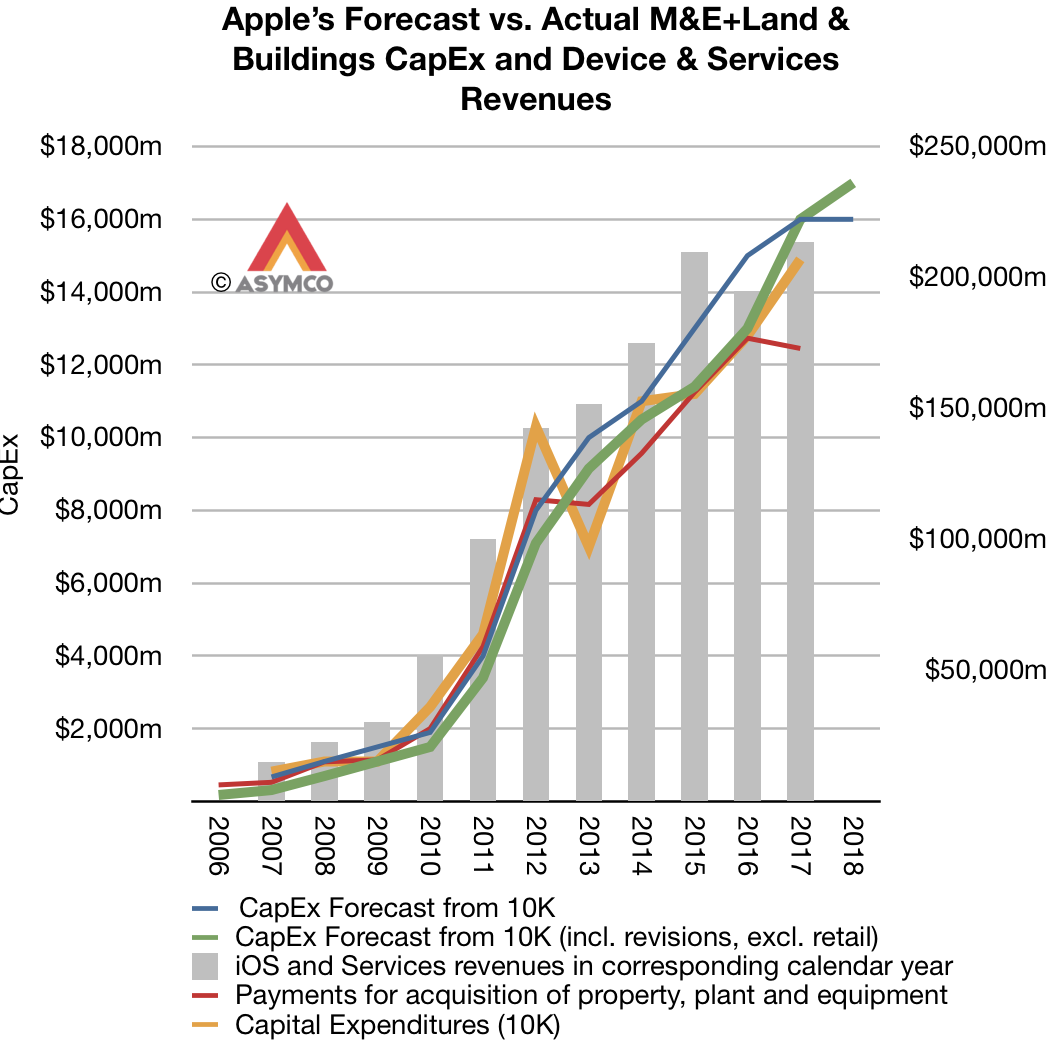
    Minor ((To the extent that $1 billion can be considered minor)) differences, aside, this forecast and actual spending and payments data is significant because it is highly correlated to Apple's overall business. Assuming that the spending on manufacturing equipment and information systems hardware (i.e. data centers) is in support of the iOS device sales and services we can try to show how sales correspond to spending with the following graph:

    Here sales are shown as a bar graph and the various spending forecasts and actual payments are shown as lines. Also note that the spending and sales are offset by one quarter. The fiscal year is used for spending and the calendar year for sales. The reason is that spending is presumed to lead sales by approximately one quarter.

    There are some notable discrepancies, especially with the 2012/2013 period when spending was brought forward a quarter thus showing a surplus to forecast in 2012 and a deficit in 2013. But apart from that, there is a broad correlation between spending and sales.

    This means that the CapEx forecast in October is a good indicator of sales in the following year.

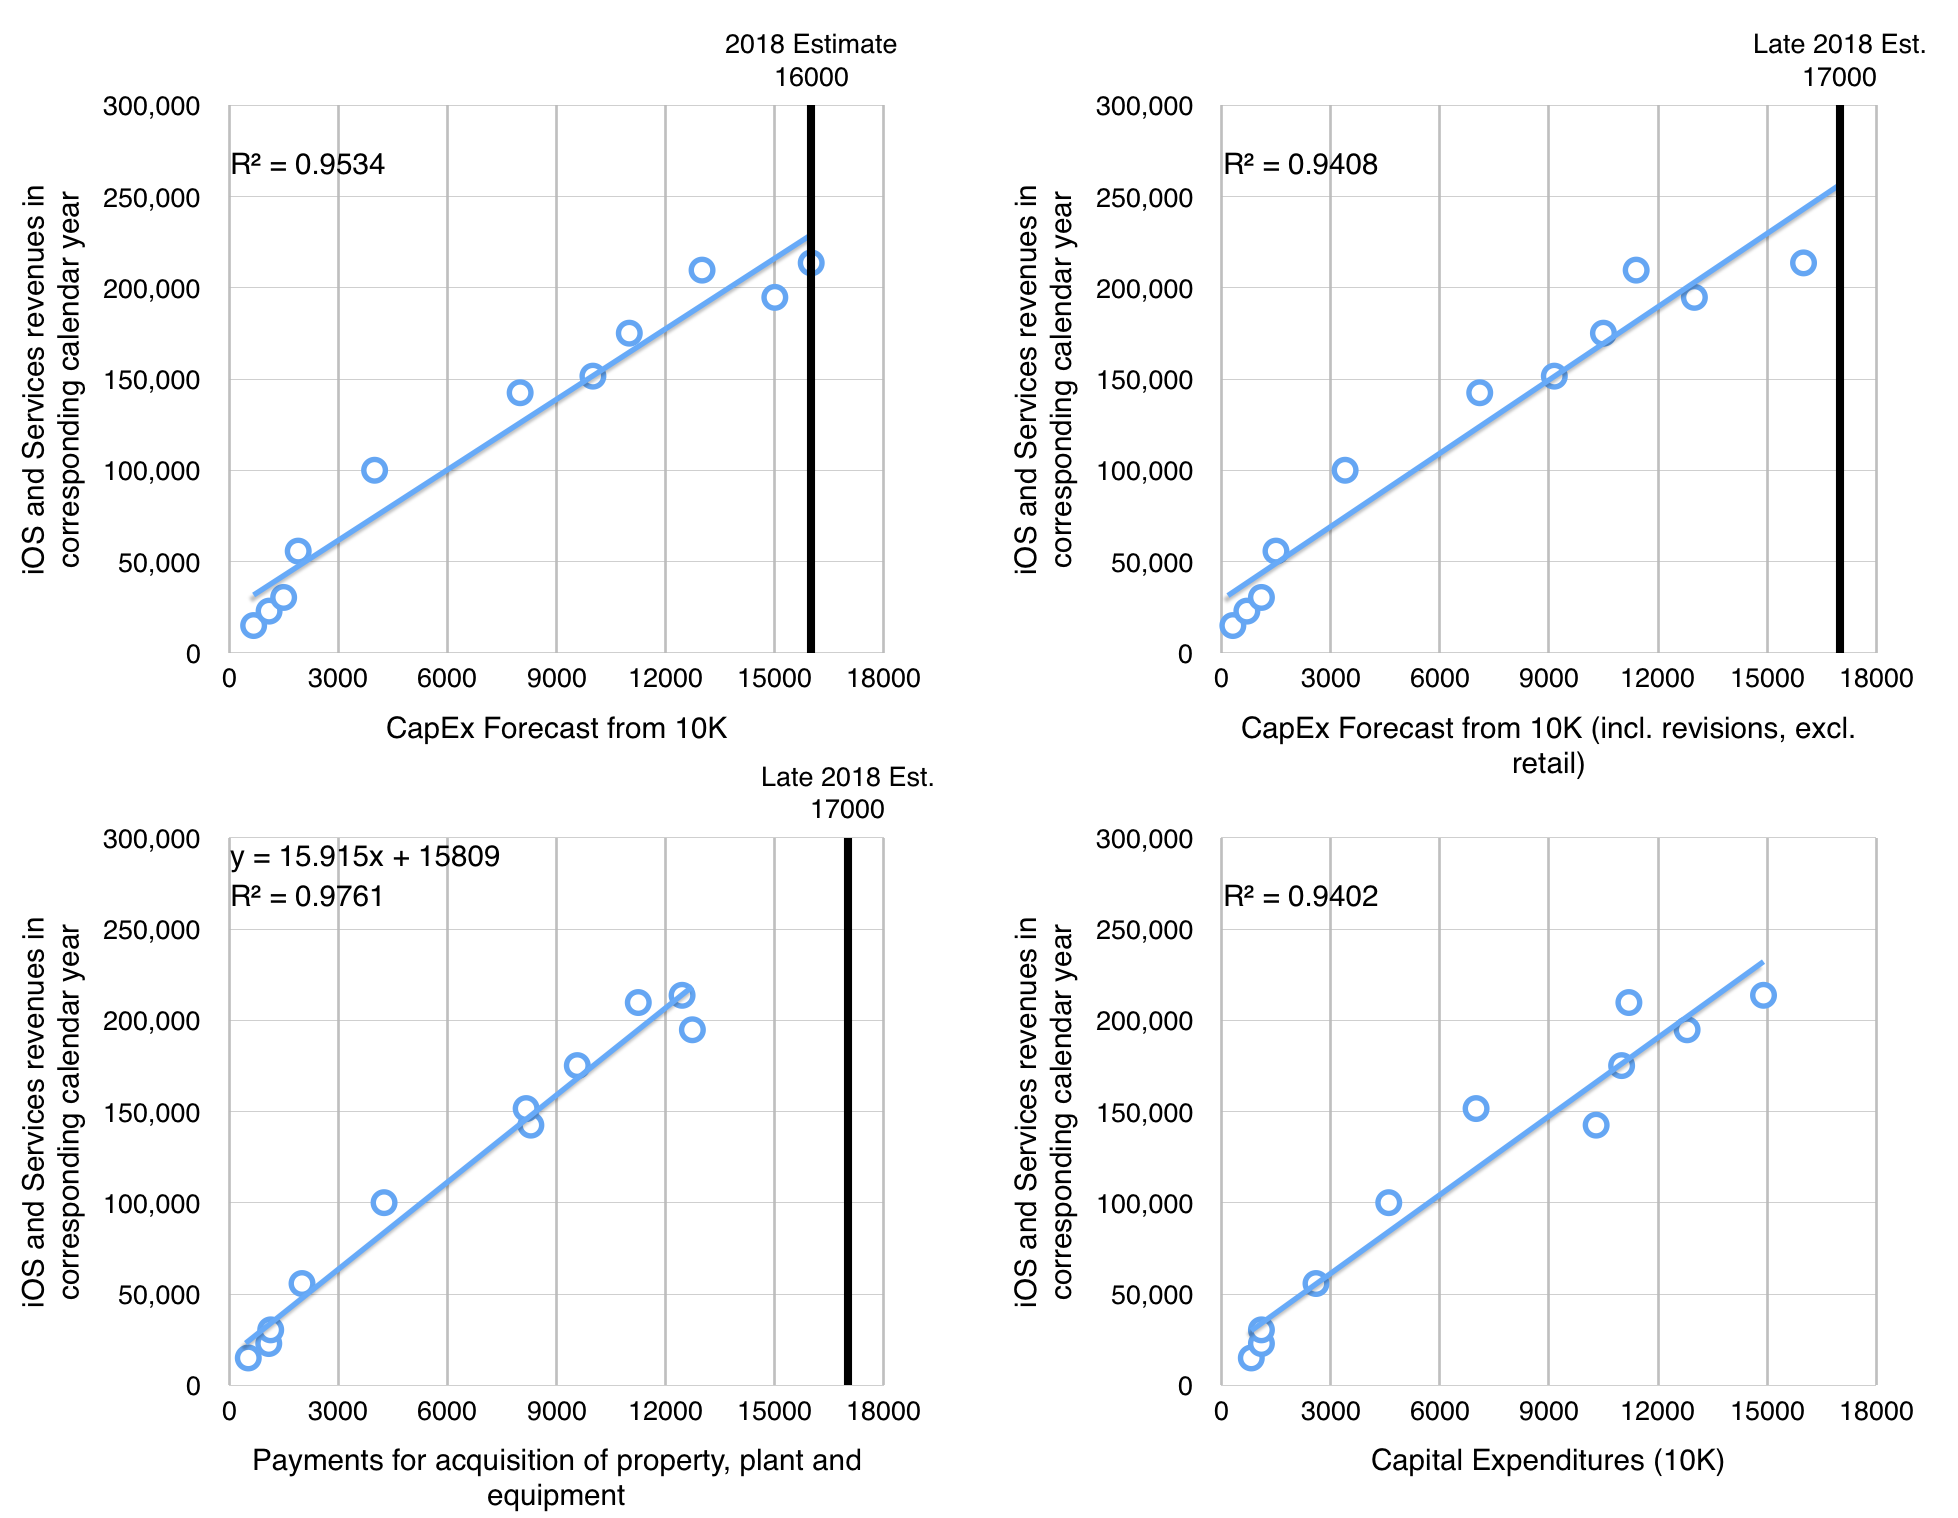
    In fact, the relationship is can be shown with four scatter plots, one for each of the published figure:

    I caution that this is a yearly forecast and it is revised through the year on a quarterly basis, sometimes up, sometimes down. It's therefore not a perfect indicator and of course the relationship between sales and spending is not perfectly predictable. Note that there are four types of spending that can be measured, two are forecasts (one year and revised) and two are actuals (cash flow payments and reported total expenditures)

    We can measure the best variable that fits the sales data through the coefficient of determination or R-squared. The best fit seems to be with Payments for acquisition of property, plant and equipment (R-squared of 0.976).

    This gives the formula for yearly sales as 15.915x + 15809 where x is the expected total spending. That spending to date has been $10.272 billion and it's probably going to exceed $16 billion for the year.

    Using $16 billion spending total, we can calculate iOS products and services for calendar 2018 of $270.45 billion.

    iOS and Services sales to date have been $103.2 billion with an estimate for next quarter of about 54.3 billion (based on guidance) and thus a total through Q3 of $157.5 billion. Subtracting this from the $270.45 billion expectation from the calculation above gives a fourth calendar quarter iOS revenue of $113 billion.

    Adding $7 billion for the Mac results in a total net sales of 120billion. This therefore is what I'd put forward as a reasonable target for CQ4.

    Note that this is equivalent to a growth of 36% from the 2017 fourth quarter.

    [UPDATE: Original version used total sales rather than iOS related products and services (i.e. excluding Mac). The text has been edited to reflect the correct figures.]

  8. The Apple Cash FAQ

    Research · 123 comments

    • How much cash does Apple have?

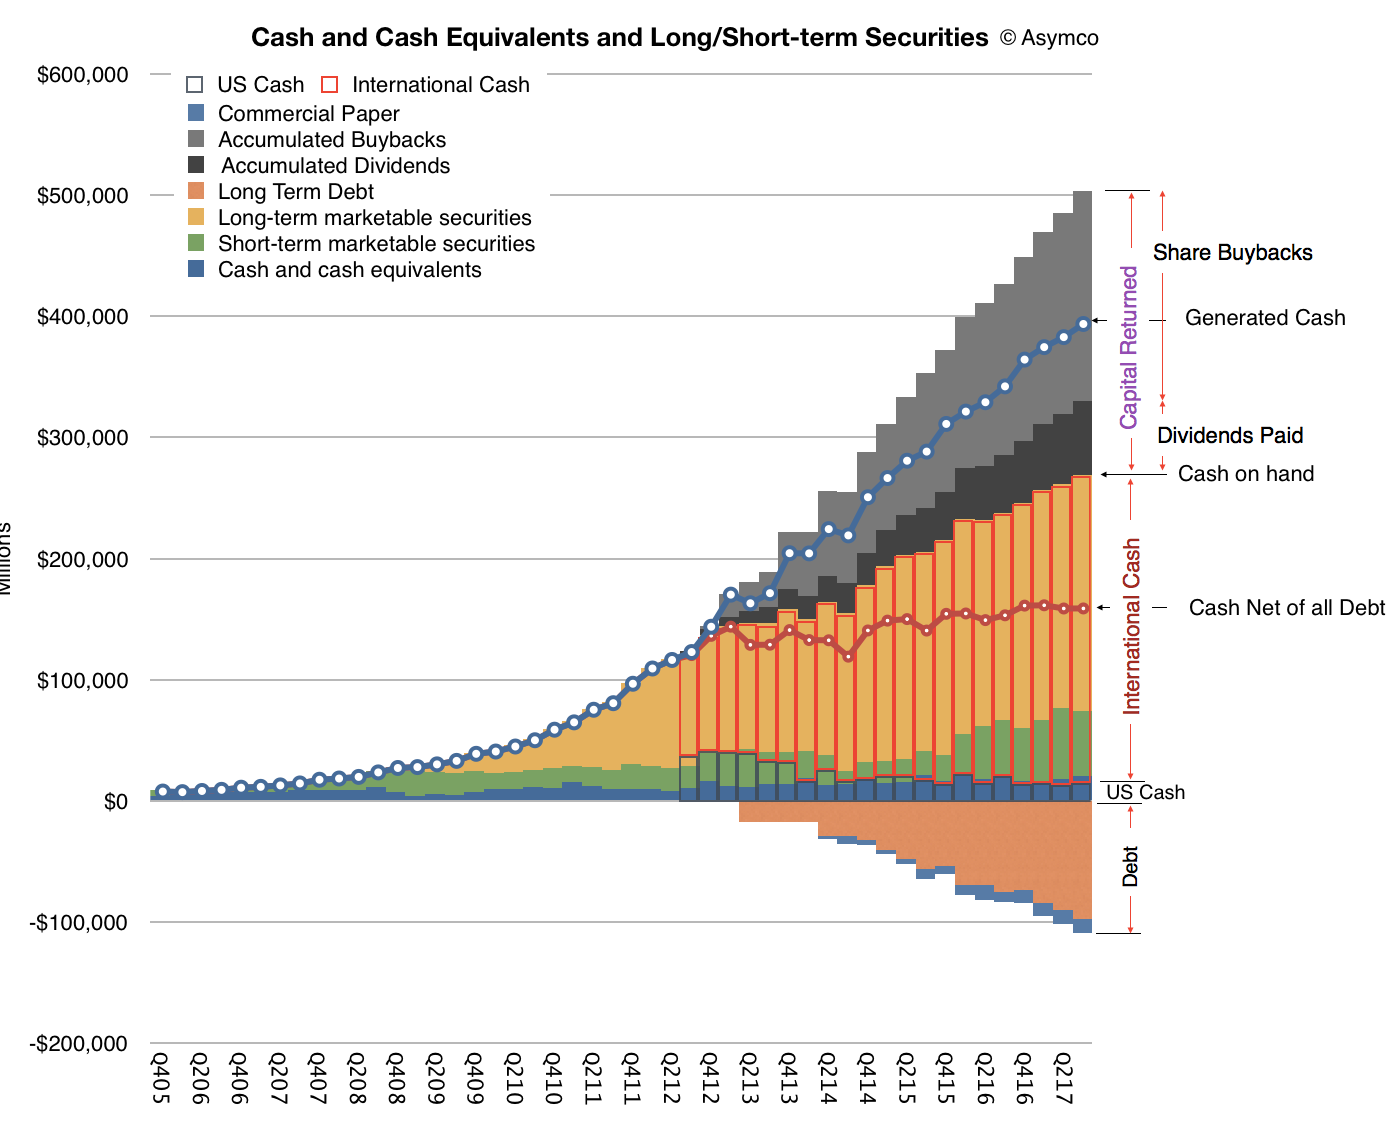
    To the nearest million, as of the end of September 2017, Apple's cash and investments totaled $268,895,000,000. Note that this includes investments in the form of short- and long-term marketable securities. Long-term marketable securities are not always accounted as "cash" because strictly cash is considered a liquid asset and some securities may not be sufficiently so. Nevertheless, most analysts would agree that Apple's securities are sufficiently liquid to qualify as cash. Note that for archaic reasons this cash is separated into US and non-US holdings with $17 billion located in the US.

    • Most businesses keep very little cash on their books. Why does Apple have so much cash?

    Indeed Apple's cash is extraordinary. It amounts to about 30% of its market capitalization. One reason is that Apple has taken many loans, totaling about $100 billion.

    • Whoa! Why would Apple need to take out loans? Does it have problems with cash flow? ((Companies often borrow because they need to plug gaps in profitability, best measured as "free cash flow".))

    Quite the contrary, Apple's operating cash flow is eye-watering. In the 2017 fiscal year (ending September) Apple generated $63,598,000,000 from operations. The loans are not needed to operate. They are used to pay shareholders.

    • Why does Apple need to pay shareholders?

    Because it's their money.

    • Wait, I thought you said this was Apple's cash.

    Apple is holding it for them but if it has more than it needs it's obligated to return it. You see, If you were to look for "cash" in financial statements you find it on the balance sheet as an asset. Since it is growing and since a balance sheet has to balance, there has to be a liability that grows in proportion to offset the cash asset. That liability is called Shareholder's Equity. This is a "debt" the company has to shareholders. If it pays out cash to shareholders then it zeros out an asset and a corresponding liability. The net is zero as far as Apple is concerned but shareholders get something in return for giving Apple money in the first place.

    • So hold on, it takes out loans to pay shareholders because it "owes them money" while it has too much money? This makes no sense.

    Yes, welcome to tax laws. Although it generates more money than it can use, and that money should thus be returned to shareholders, some of the money is collected outside the US. US (and US only as far as I know) tax laws have a "repatriation tax" that is levied on money coming into the country.  This has nothing to do with corporate taxes which are levied on earnings. So after paying shareholders with the cash it had in the US, Apple had to borrow money to pay shareholders money they had outside the US.

    • Why not just pay the repatriation tax?

    Because then shareholders would get less than 70% of their money. They would probably complain and blame the managers for being incompetent. Such blame usually comes with a lawsuit attached.

    • What about the new tax law that lowered the repatriation tax rate?

    Now Apple has no option but to pay the tax and repatriate the cash. It's still a tax. The amount will be about $38 billion or about 15%. Previous repatriation "holiday" levies were around 10%.

    • How exactly does the company give money to shareholders?

    The payments are called "dividends" and shareholders must treat them as income--a form of double taxation because these funds are after the company paid earnings tax and possibly repatriation tax. Apple does pay dividends regularly but because of tax inefficiency (i.e. because government policy discourages dividends) the company mainly buys its own shares and retires them.

    • Huh?

    Yes, it makes little sense but the math is simple. If the company buys its own shares and makes them disappear then existing shareholders will end up owning more of the company, making their shares more valuable. They can realize the gain if/when they sell the shares (and pay capital gains tax instead of dividend income tax on the already (double) taxed profits.)

    • Does that mean that it is going private?

    No. The owners of the company remain the same: whoever owns shares owns the company and they can be traded in public exchanges. In theory they could reduce the share count to a single share and there would presumably be a single shareholder who would own the company, making it "closely held" but the company's managers are still required to report and act as if it was public. Going private usually means a set of shareholders agree not to allow the shares to float on the open market and thus to also keep the affairs of the company out of public eye. It reduces liquidity and is generally harder for shareholders to exit their investment. This has nothing to do with reducing the number of shares in circulation--which is what Apple is doing.

    • But buying shares does not seem to affect the share price so the shareholders are not benefiting from the repurchasing. Isn't this a waste of cash? Aren't the shareholders being robbed?

    The share price is an argument between shareholders and potential shareholders on the value of the company. It should reflect reality but many times it doesn't. Over time however the math catches up with sentiment. In other words realization that there are fewer and fewer shares available compels people to not sell them, increasing the price. Short term investors tend not to pay attention to this but they are not the shareholders who Apple wishes to pay back anyway.

    • Why doesn't the company spend the money on other things? You said they return what they can't use. Why can't they use it?

    Simply, because it's more than can be spent wisely. The company considers its mission to be very narrow: add value in specific areas where they can create tremendous value uniquely and under conditions (technologies and business models) they can control. Many such projects don't require capital. Manufacturing, data centers and Apple stores require capital but R&D and sales not so much. Creating products is very cash efficient. For example, the iPhone--the most successful product of all time--cost almost nothing to develop; certainly nothing that required Apple to dip into its cash. Funding for the type of product development Apple does comes from existing cash flows and mostly consists of salaries for their employees.

    • What about acquisitions? Why not buy other companies?

    It buys companies but usually small ones which are essentially acquisitions of teams and their intellectual property. Apple does not buy "business models" or customers or cash flows which is what large companies are valued for. Operationally, it's also because Apple has a strong culture and it wishes to preserve it. Acquisitions dilute culture which is why integrations often fail. Statistically, large acquisitions are value destructive and the larger they are, the more likely they are to fail. Incidentally, when a company is acquired with cash that hole in the balance sheet is filled with something called "goodwill" which reflects some intangible value of the new asset. If and when the acquisition is deemed to have failed the goodwill is written off and so is shareholder equity. That's how shareholders are robbed.

    • What about keeping it? Doesn't having lots of cash make Apple more powerful?

    As individuals we think that having lots of cash makes us rich. For companies it's the opposite. Cash is a liability. If you come across a company that is cash rich and has nothing else, its enterprise value will be zero. Companies are valued on their future cash flows, meaning their ability to generate cash, not how much they managed to keep. In other words, cash is a measure of past success and investors are interested only in future value. That future value comes from the intelligent allocation of resources toward a valuable goal. A company rich in cash but poor in vision is likely to be taken private or broken up and shut down. Cash is an IOU to shareholders with a thank-you note for the support through the years.

  9. Who Solved the Capitalist's Dilemma?

    Research · 14 comments

    In The Capitalist's Dilemma, Clayton Christensen and Derek van Bever introduce a powerful new theory which explains the relative paucity of growth in developed economies. They draw a causal relationship between the mis-application of capital in pursuit of innovation and the failure to grow. ((and, indirectly, in the increase in inequality and hence the destabilization of socio-political institutions))

    In particular, they observe that capital is allocated toward the type of innovations which increase efficiency or performance and not toward those which create markets (and hence long term growth and jobs.) This itself is caused by a prioritization and rewarding of performance ratios rather than cash flows and that itself is due  to a perversion of the purpose of the firm. ((That being the creation of customers not shareholder returns))

    For this statement of causality to be confirmed we need to observe whether it predicts measurable phenomena. For instance, we need to see whether companies which create markets apply capital toward market-creating innovations and whether companies which create value through efficiencies or performance improvements hoard abundant capital.

    Over the entire global economy, the pattern of capital over-abundance is easy to see. The amount of cash or securities on balance sheets is extraordinary and unprecedented (estimated at $7 Trillion, doubling over a decade). However, growing cash is not a perfect indicator of inactivity. Cash is the by-product of earnings after investment. So if operating profits are growing and investment is growing, but not as fast, then it's possible to grow cash while still growing investment.

    The better measure is investment in capital equipment or, more specifically, purchases of plant, property and equipment. ((Operating expenditures can also be measured but they cannot grow inorganically due to most of the costs being related to skilled employment which has supply constraints.)) Indeed, on a global scale, capital expenditure as a percent of sales is at a 22-year low.

    CapEx is a good proxy for non-financial "investment". It's also a measure that can be easily obtained as companies report this activity in their Cash Flow Statements.

    So the best method for assessing the theory's predictive power is to look at market creators and measure their investment in PP&E. At the same time we need to look at market sustainers and measure their (probable) lack of investment in PP&E.

    So here is my first attempt:

    Screen Shot 2014-05-27 at 5-27-3.25.43 PM

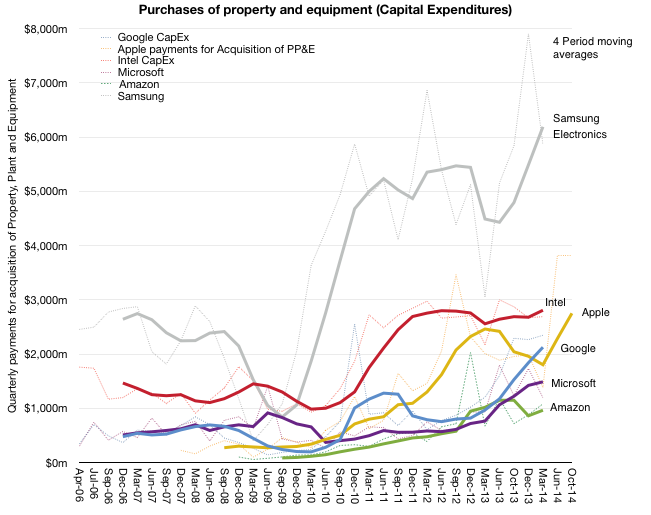
    It's an admittedly small sample of companies that are not that dissimilar. But within this group, over the time frame of about 9 years, we can see how capital expenditures are growing. ((Note that Apple's data extends to the end of their fiscal year and reflects their forecast given last October in the 10-K filing)) This sample shows that for a few companies, the amount spent on capital equipment grew dramatically. Especially since they are in businesses that might be thought of as not capital intensive.

    Consider Amazon: an Internet company if there ever was one. Their purchasing of capital equipment (in which they also classify software) went from 373 million in 2009 to $3.8 billion in last four quarters! The average spending was $84 million in the four quarters ending September 2009 and $964 million in the year ending March 2014. Amazon is investing in data centers and distribution centers and they are growing that asset base with an eye toward future growth.

    In contrast, consider Intel. Intel is in the most capital-intensive corner of the technology industry: semiconductors. They still manufacture their own so their investment in "fabs" continues. But Intel failed to create a market for mobile devices. The number of ARM processors shipped in 2013 was about 10 billion units while the number of Intel processors shipped was around 400 million.

    So despite being an innovator, Intel did not create a market. They still increased their CapEx but only by a factor of 2. Is this because Intel did not invest in market-creating innovations? Had they invested in market-creation, would they be increasing CapEx accordingly?

    Now look at Samsung. Samsung has grown CapEx by a similar factor to Intel (from pre-recession $2.5B/quarter to average of $5.5 during the last three years). Did Samsung create markets? Much of the expenditure went toward supplying components to itself and Apple (and others). In that regard, they did not create the market but filled it and optimized it.

    Then there's Google. Google increased CapEx from an average of $476 million/quarter in 2006 to $2.125 billion in the last four quarters. That's an increase of 347%. Google spends almost all CapEx on data centers and we can see a pattern where CapEx growth anticipates service growth. However, the growth is not as pronounced as Amazon's.

    Microsoft also grew CapEx. Their investment mirrors that of Google: data centers. Microsoft increased from an average of $508 million/quarter (very similar to Google) in 2006 to $1.5 billion today. That increase is about 200%, slower than Google but in the same trend. Did Microsoft create a market since 2006? In terms of cloud computing and software as a services, yes. Their spending growth reflects infrastructure that supports a new business model.

    Finally there's Apple. In this time frame Apple did create the iPhone and iPad and their growth went from less than $200 million/quarter in CapEx to over $2.5 billion/quarter. The increase is nearly 10x over 25 quarters.

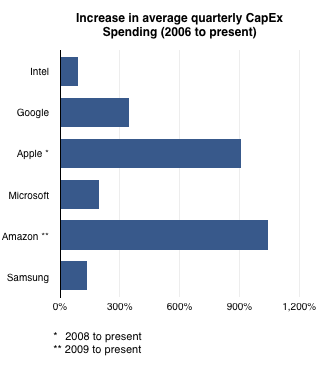
    To summarize, the following graph shows the increase in average quarterly spending (over a four quarter period) between 2006 and the present for these companies.

    Screen Shot 2014-05-27 at 5-27-3.10.40 PM

    The degree of "market creation" may be visible to the naked eye: Apple and Amazon did clearly create markets and they show highest CapEx growth while Intel and Samsung did not and they show the slowest CapEx growth. Google is continuing the expansion of a new market as is Microsoft and their CapEx growth is roughly proportional to these efforts.

    At least from this small sample the theory seems to hold. CapEx and market creation are at least correlated.  Much more analysis needs to be done, especially to discover the anomalies, but from the perspective of some of the most valuable and rapidly growing large companies, their commitment to capital expenditures is evident.


  10. In the weeds

    Research · 55 comments

    Although discussions related to how Apple will "use its cash" center on acquisitions of companies, Apple's has been busy acquiring, just not companies. It has been buying capital equipment. Capital meaning (in the original sense of the word[1]) the means of production.

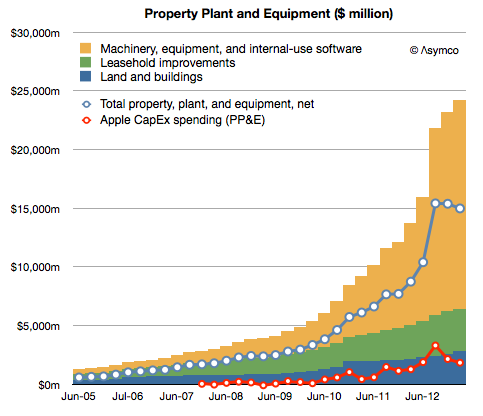
    Since the launch of the iPhone Apple has spent $21.1 billion on the acquisition of property, plant and equipment. The company has already stated that they will spend another $10 billion or so for the current fiscal year. This has been mostly machinery and equipment used in manufacturing.

    The result in asset value is shown below:

    Screen Shot 2013-05-30 at 5-30-6.29.53 PM

    [The Net value, shown as a blue line, is after accumulated depreciation. The red line represents spending as reported on the cash flow statement.)

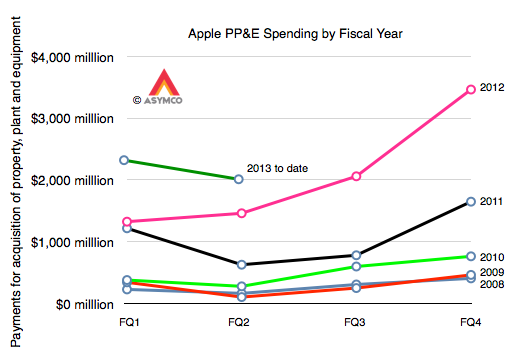
    The change in spending year/year (fiscal) is shown in the following graph:

    Screen Shot 2013-05-30 at 5-30-6.31.27 PM

    So these are very large numbers, even compared to other capital-intensive semiconductor manufacturers:

    Screen Shot 2013-05-30 at 5-30-6.48.22 PM

    Given this enormous spending one could imagine it's the subject of intense scrutiny. However the only question on the subject that I've ever seen was from Steve Milunovich of UBS to which Peter Oppenheimer, CFO offered an explanation:

    Steve Milunovich - UBS
    …second question would be on CapEx, you spent almost as much Intel does. I think you guys have said you’re not going to become vertically integrated per se but in a sense you are since [you buy] equipment for your partners, could you talk about the strategy here and how much of a differentiator this gives Apple in terms of your ability to ramp new products over time? And maybe a little bit more about how deep you will go in terms of semiconductor components for you, etc.?

    Peter Oppenheimer - Chief Financial Officer
    Sure. Steve it’s Peter. We expect to spend about $10 billion in CapEx this fiscal year that will be up little under $2 billion year-over-year. We expect to spend a little bit under $1 billion in the retail stores. And the other $9 billion is spent in a variety of areas. We are buying equipment that we will own that we will put in partners’ facilities. Our primary motivation there is for supply, but we get other benefits as well. We are also adding to our datacenter capabilities to support all the services that Tim spoke about in answering Ben’s question and in facilities and in infrastructure. So, that’s where the capital is going.

    I would say that this is not a very satisfying answer, which is why I thought it merits further questioning[2].

    Alas, no.

    Whereas there is a constant clamoring for Apple's to use its cash to "acquire" or "buy" something, anything, maybe people not looking hard enough. If you need the satisfaction that comes from knowing that money is being spent, a glance at the Cash Flow statement and Balance Sheet shows that Apple buys the equivalent of one Yahoo! every three years[3].

    The main difference with this type of acquisition is that there is less value destruction. Using the capital to ensure access to capacity, differentiation and hence a high margin is better than writing off the goodwill after a few years.

    --

    1. The term capitalism, in its modern sense, comes from the writings of Karl Marx
    2. I am prepared to be alone in this quest as it seems to merit no mention from others
    3. or 10 Tumblrs every year
  11. The new age of Capital Intensity

    Research · 117 comments

    In the post reviewing Samsung's Capital Structure I noted that its component divisions have historically taken 90% of capital investments and that the overall capital intensity for Samsung Electronics has increased in proportion to its component revenues.

    In another post regarding the capital structures of other technology companies with different business models I noted that Apple has changed its capital structure to a significant degree over the previous three years.

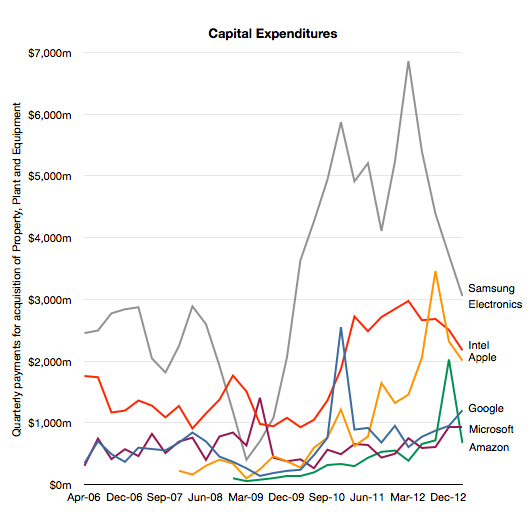
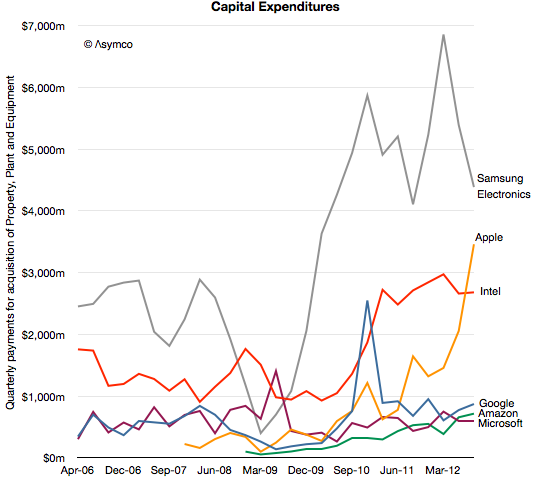
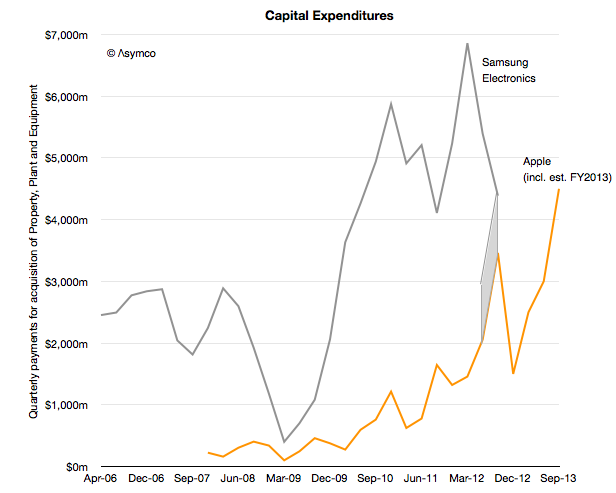
    In the following graph I combined these observations to show how capital expenditure patterns may be used to discern the underlying business model.

    I would group "cloud" or "platform" based companies like Google, Amazon and Microsoft as a cohort which, although spending significant amounts on capital equipment, do so mainly to support services. Their primary employment of capital is to sustain the infrastructure of data centers necessary to deliver the services underpinning their business models.

    I would group Intel and Samsung as "component" based companies which use capital to build production capacity that delivers, hopefully, a control point in the value chains they participate in. Note that I am assuming that Samsung Electronics' CapEx primarily targets semiconductors and displays as it did during the 2006 and 2007 period when data was available.

    Therefore, given the patterns over the last six years, it might be possible to classify a company's core business by just looking at its CapEx: The services group showing growth but relatively stable patterns and the components group showing more volatility, macroeconomic sensitivity and an overall higher level of spending, especially as a percent of sales.

    The question that pops up then is in what category does Apple fall?

    My observations for over a year have been that Apple is increasing its capital spending to such a degree that it is neither fish nor fowl. It operates data centers but presumably does not operate fabrication plants. And yet it spends more than Intel and Google combined.

    Contrasting Apple and Samsung Electronics tells an even more interesting story. In the following graph I've added two additional items of information: First, although CapEx spending is recorded in the cash flow statement, Apple reported in its yearly (10K) report that it spent an additional $2 billion for equipment which did not pass through cash flow.

    If we were to add $1 billion to each of the previous two quarters, the graph would look like this:

    The second piece of information is that Apple projected its spending for the following fiscal year. I've added that spending in a pattern matching the last fiscal year.

    Apple is still spending less than Samsung. In its fiscal year 2012 Apple spent about $10 billion while during the same time frame Samsung spent nearly $22 billion. However, Apple has begun to bump against Samsung's spending level on a quarterly basis.

    I consider this extraordinary evidence of an extraordinary shift in strategy.

    For a year we've been debating here to what degree Apple has a "capital intensive" business and what exactly could it be spending capital on. One early hypothesis has been that it's on data centers or on real estate for spaceship campuses. These can be easily dismissed on the knowledge that they can't cost that much (and that the spending happens gradually). Another hypothesis is that the tooling for milled aluminum cases and other mechanical components is expensive and Apple has to buy a lot of it. But, again, the level of expenditure is in the league of Intel and Samsung which make vast quantities of semiconductors in very expensive plants. It's hard to imagine milling machines being cost equivalent to chip foundries.

    The comparison with Samsung, whose vast capital commitments are legendary and are its primary strategic asset puts Apple in a new light. Perhaps we can't yet call Apple a semiconductor company or even a fabricator but they are putting their "money where their mouth isn't". We can infer that it's not going where the company currently operates. The capital is being deployed almost silently and, though vast in scale, barely gets a mention from analysts. Not even a single question has been raised at any earnings call about this spending.

    So what tale does this capital tell?

    One interpretation is to apply the value chain disruption theory and ask whether Apple is acting to counter a potential disruption. In other words, that this is a specific threat response from an incumbent. There is some logic to this because  the antagonism between Samsung and Apple is so strong that it might justify a reaction of this kind.

    However, I believe that there is a more measured process at work over a long period of time. The one distinguishing advantage and attribute that Apple has  is its preference for integration. This preference is not a secret and Tim Cook repeats it often. The integration is evident with their move into retail and component design, in other words in both directions along a value chain. So my hypothesis is that this is part and parcel of an ongoing re-alignment of their role in the value chain.

    This second explanation suggests that Apple simply wants to control all the areas which affect the value they produce. First because they feel that there are areas that are not good enough and the product/experience cannot be good enough if its constituent parts are not good enough. Second because without control there are constraints to what it can do strategically.

    Whatever the reason, I read the evidence of increasing commitment and engagement in parts of the value chain as part of a continuous evolution of Apple's role. Furthermore, it's something that should be seen as a signal of a new era in how technology companies operate. We see hints of "vertical integration" with Microsoft building hardware, and Google buying Motorola and Amazon selling devices. Apple did all these things and now it casts an eye over the next frontier: components.

    ---

    If you want to learn more about the future of the technology industries and the evolution of value chains, consider participating in Asymconf.