Asymco

Asymmetric Intelligence

share

  1. In phone sales, RIM plus Apple equals Nokia

    Research

    Following up from the last article on the global phone units sold over the last three years (Visualizing the winners and losers of three years of smartphone share growth), we take a look at the sales in dollar terms over the same period.

    Remember that in the article on units, the pure-play smartphone entrants HTC, RIM and Apple grew from a combined unit share of 1.3% in Q2 2007 to a combined unit share of 7.7% in Q2 2010.  That's a 6 fold increase in volume share. Quite remarkable for companies lacking the vast resources and industry connections of the incumbents.

    However, when we look at their performance in value (dollar sales) vs. units sold, the performance of the entrants begins to look miraculous.

    The sales figures can be obtained from the company reports, though I caution that not all vendors publish data and data published is in local currencies. Fluctuations in exchange rates may lead to differences in reports of sales from different sources.  For the sake of consistency, I omit all "other" vendors and focus on the top seven: Nokia, Samsung, Motorola, LG, Sony Ericsson, RIM and Apple.

    First, the cohort's overall performance is shown in the following graph:
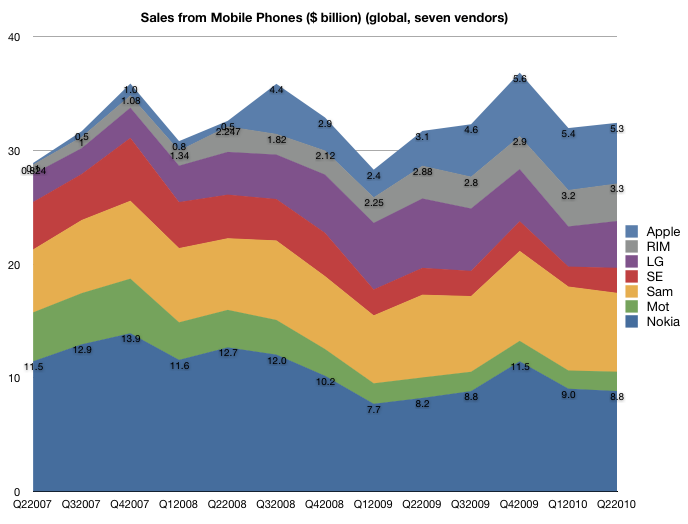
    I again annotated Nokia and RIM and Apple with actual sales (USD) figures for some perspective.

    The first thing to note here is that the whole industry sees a low rate of growth (unlike in the units picture). Total sales in Q2 2007 were $29 billion and total sales in Q2 2010 were about $32 billion. A mere 12% growth over three years and only 4% compounded over three years. Total units in Q2 2007 were 255 million and total units in Q2 2010 were 318 million, or 24% over three years and 6.2% compounded. This means industry-wide sales growth is half the units growth.

    The second thing to note is that the Apple+RIM group grew from 3.3% share of cohort to 26.6%.  That means that more than 1 in 4 dollars sent to these 7 companies was spent on Blackberries and iPhones!
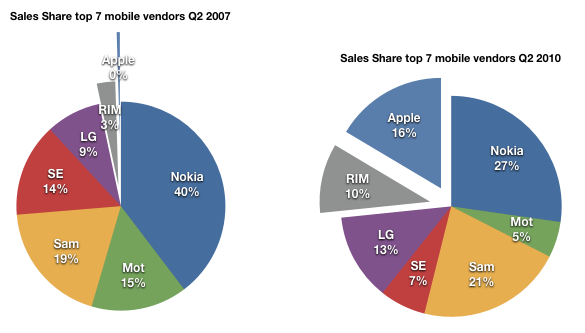
    Jointly, Apple and RIM took $8.6 billion and Nokia took $8.8 billion.  Compare that with three years ago when Nokia took 40% of the income and RIM + Apple took 3%.

    So whereas the entrants increased units share by 6x in this time period, at least in this large subset of the market, they increased revenue share by 8x.
  2. Visualizing the winners and losers of three years of smartphone share growth

    Research · 2 comments

    Many consider June 2007 to have been a pivotal moment in the history of mobile phones. Apple's entry with the iPhone has re-defined the market in many ways. However, there was a smartphone market before then. About 28 million smartphones shipped the quarter when Apple launched out of an overall phone market of 265 million. Apple's entry with 270k phones was a drop in the bucket.

    I thought it would be instructive to chart what happened between that quarter, exactly three years ago and today. I collected the data from IDC, Gartner and Canalys and company reports to paint a few pictures.

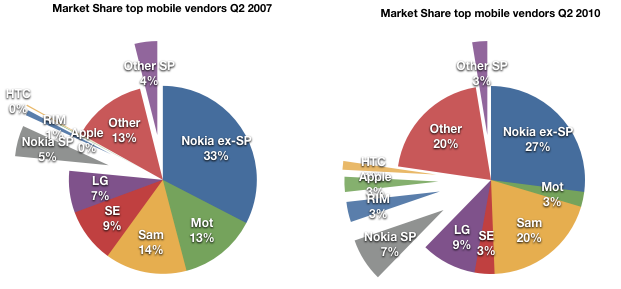
    First, the market shares (by units) of the top mobile vendors, Q207 vs. Q210. I highlighted the smartphone vendors by separating their wedges from the pie. Note that I also separated Nokia's smartphones from Nokia's regular phones as two separated wedges--Nokia ex-SP for no smartphones and Nokia SP as their "converged" units. I did the same with "other".

    The first thing to note (beside the large increase in smartphone share) is that "other" non-smartphones are a huge part of the pie. At 20%, the share of "other" is now equal to the share of Samsung. Other consists of a group of mostly low cost Chinese vendors. The growth of the low end "other" went from 35 million units in Q207 to 65 million in the last quarter. It's this competition that is driving profit out of the core businesses of Nokia, Samsung and LG and forcing a flight to smartphones (more about this later).

    The second thing to notice is that Motorola and Sony-Ericsson are highly visible victims of the last three years. Sony Ericsson shipped 25 million devices in Q207 and only 11 million three years later going from 9% share to 3%, on par with RIM and Apple. Motorola did even worse, shipping 35.5 million in Q207 and a mere 8.3 million last quarter, losing 10 out its 13 points of share.

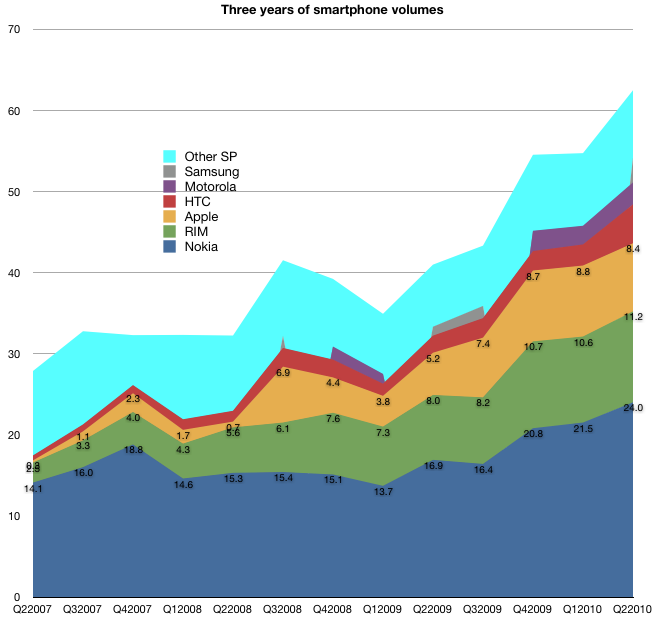
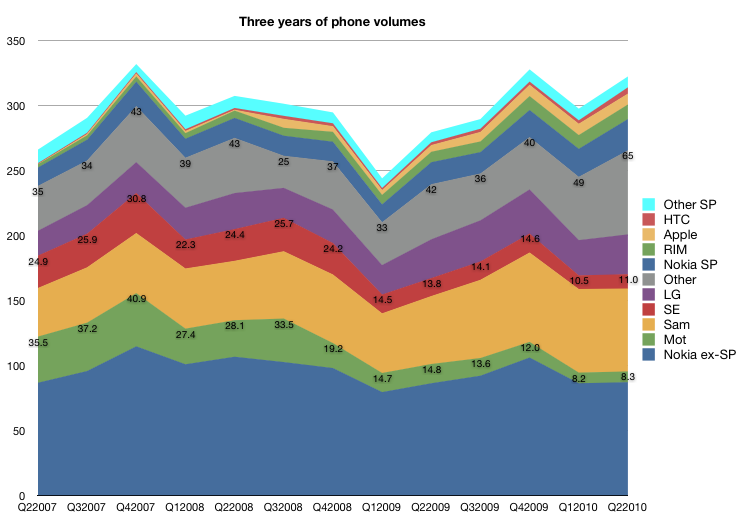
    Viewing the overall units market, one can see the gouge in units that the recession took out. The following graph shows three years of volumes by the top vendors with the smartphones separated at the top (Nokia SP, RIM, Apple, HTC and Other SP--everything above the grey band are smartphones).

    However, separating out the smartphones, one can see their volume increased with barely a ripple during the recession. Although Nokia retains the top share spot, the entrants have jointly grown much faster.  I have annotated a few of the competitors' volumes with the actual values.

    One thing to note is that "other smartphones" has traditionally consisted of Windows Mobile licensees but that is quickly shifting now to Android. I also had only fragments of data for Samsung and Motorola, so their bands are incomplete.  However, one could note how minimal their participation has been in the market.  LG has been practically absent from this market.  For these latecomers to smartphones, it's clear what Android offers: a chance to stay in the game.

  3. Why Apple's cash is worth more than Microsoft's cash

    Research · 11 comments

    My recent exposé of Apple's cash (and cash equivalents and long-term securities and short-term securities) drew quite a bit of attention, which is good. Because it needs to be demystified. However, the story does not end there. Part of the problem of cash is that the liquid stuff can often itself change in perceived value due to mis-management.

    Cash has to be valued on the basis of what's to become of it. So what can become of it?

    The value in liquid assets can be returned to shareholders in the form of a dividend, which means double taxation on profits; not the best idea usually. Or it can be returned in the form of share re-purchase which tends to have only a temporary effect on share prices, again not a great return. The value can also be increased by means of investment in projects that return higher than what investors expect their cost of capital to be. This is the best option but investment is difficult when the amount involved is so big that no project or set of projects could possibly cost enough to employ the capital. Finally, the value can be completely destroyed through large acquisitions.

    I say destroyed because the history of large acquisitions is almost universally known to be value destructive (1). The urge to M&A is why cash on the balance sheet for large companies is usually discounted and share prices "get no credit for it." This is plaguing Apple with a P/E ex-cash in the teens.

    Is this fair?

    Companies faced with low growth are more likely to blow their cash on desperate acquisitions than those with high growth, but the best way to judge the probabiliy of cash evaporation is by looking at management track records.

    Which leads us to Microsoft.  Their pursuit of Yahoo shows how desperate they had been in trying to catch Google and how poorly that would have turned out. Having failed only because Yang refused to sell, Microsoft would have gone through a large part of its cash and even raised debt to finance a dud.  With this propensity, it's no wonder that Microsoft's cash is considered an endangered quantity.

    Microsoft used to have the largest cash position in tech. They still have $44.5 billion--a mere billion or so less than Apple. Some of the value already evaporated on dividends and medium sized acquisitions ($500 million for Danger that ended up as Kin(dling)). The chances that they'll blow billions again on desperate means to chase competitiveness are high. I would say it's a certainty.

    On the other hand we have a high growth company like Apple that has not traditionally spent money on business acquisition. (They do spend on asset acquisitions--IP, code, developers but not on new business models.) Thus, on reputation alone, Apple's cash can be considered "safer" and hence worth more than Microsoft's.

    Whether Apple can expose that cash to risk that enhances its value is another matter, but their CEO is on the record stating that "it's not burning a hole in their pocket" and the CFO repeats every quarter he is intent on its preservation.

    This, in my opinion, makes the difference between Apple's $45 billion and Microsoft's $44 billion a lot more than $1 billion.

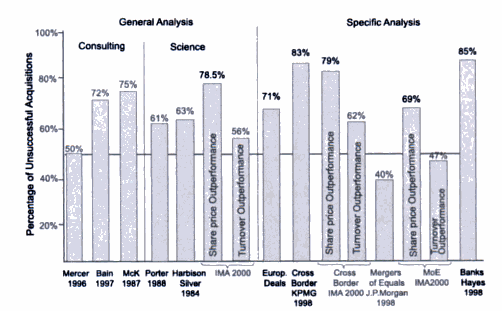
    (1) Various studies have shown that at least 50% of acquisitions have been rated as failures. See failure rates by various studies charted below. Source: Prof. Dr. Thomas Straub (2007) "Reasons for frequent failure in Mergers and Acquisitions"

  4. 70 percent of college freshmen are entering school with Macs [Updated 2]

    Research · 2 comments

    Increasingly, companies are giving their employees a choice to either use Microsoft Windows PCs or Apple Inc.'s Macs, the analyst said. And, increasingly, employees are choosing Mac over Windows. To boot, Chowdhry said 70 percent of college freshman are entering school with Macs, up about 10 percent to 15 percent from a year ago.

    via Microsoft shares retreat after downgrade.

    Remarkable indeed.  I remember when in 2007 40% Macs was headline news at Princeton, having quadrupled from 10% in 2003.

    [Update] Chowdry’s estimate seems an exaggeration but Mac share on campus seems to be growing. The most current data shows a probable 50% penetration in private colleges (my estimation is 70% is accurate for Ivy League schools) but a probable 20% penetration at public schools.  Still way above retail share in the US (10%) and way above corporate share of practically naught.

    [Update 2] According to survey data from Student Monitor, among those who planned to purchase a new computer, 87% planned to buy a laptop. And among those students 47% planned to buy a Mac.
    47 percent of 87 percent is a lot more believable. The chart from Fortune Tech shows that intent to buy for Apple went from 14% to 47% since 2005.

    More data, some courtesy of Macobserver readers:

    Macs at Harvard:

    • 2005: 32% (of total computer purchases)

    Mac share at Princeton (freshman class):

    • 2003: 10%
    • 2007: 40%

    George Fox University provides a laptop as part of the tuition.  Here are their numbers for Mac usage:

    • 2006 1% (Actively discouraging Macs)
    • 2007 40% (Change in IT support policies)
    • 2008 100% (Only option offered)

    The U.S. Coast Guard Academy.

    • 2008: 0% (Dell)
    • 2009: 25% (15” Macbook Pro issued, incoming freshman subsidize half the cost and 100% of any optional upgrades including printer
    • 2010: 50% (plus juniors and seniors allowed to replace older Dell with Mac if desired, not sure the financial arrangement).

    University of Virginia (survey data):

    • 2001: 3%
    • 2002: 4%
    • 2003: 4%
    • 2004: 8%
    • 2005: 13%
    • 2006: 20%
    • 2007: 26%
    • 2008: 37%
    • 2009: 43%

    UC Davis:

    • 2006: 7%
    • 2009: 23%
  5. Global mobile phone sales, the full picture

    Research

    After piecing together the global smartphone shares, it's time to take a look at global mobile phone shares. That's all phones from all vendors that matter.

    Unfortunately, just like there are only fragments available from Canalys about smartphones, there are only partial lists from IDC (IDC - Press Release - prUS22441510).  Missing are numbers from Apple, Motorola and HTC.  But fear not, those can be obtained from company earnings reports.

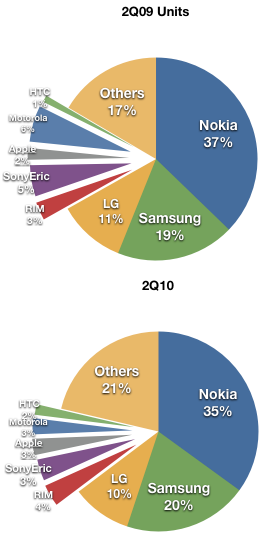
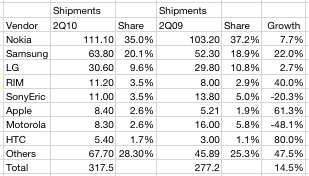
    So here is the full picture for 2Q10 vs. 2Q09

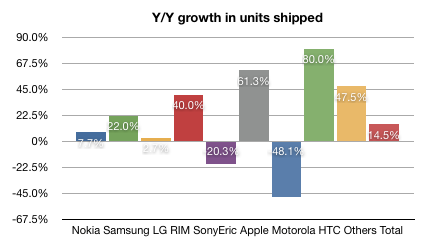
    The year-on-year growth for the vendors above is:

    The source data is:

    Observations:

    • The pure play smartphone vendors (HTC, Apple and RIM) are growing rapidly and capturing most of the profits.
    • LG and Samsung are taking share from Nokia but losing margins.
    • "others" are doing well at the low end.
    • Sony Ericsson and Motorola are transitioning from mass market vendors of commodity voice products to niche vendors of Android commodity data products.
  6. Canalys: Android global share rises to 16% of smartphones in Q1 [Updated]

    Research · 26 comments

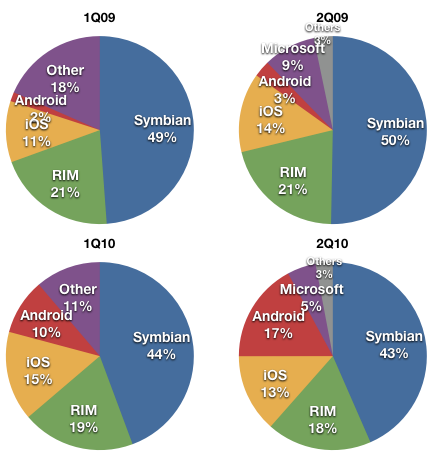
    According to Canalys:

    Usual disclaimers apply:

    • Only sell-through (i.e. not exact numbers that companies report as sold, i.e. excluding inventory in the channel)
    • Other includes Symbian devices not sold by Nokia, Microsoft Windows Mobile and various Linux, WebOS
    • iOS includes only phones, no iPads, no iPod touch, similarly Android includes only phones
    • Some of these numbers are approximate as they are based on partial data (Canalys does not publish complete share data and some must be interpolated)

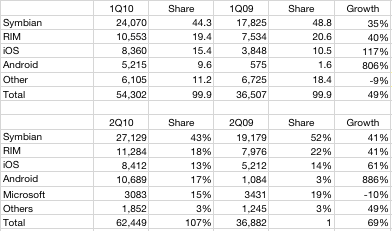
    Data used to build charts:

    Overall the market grew 64% last Q, with Apple maintaining share y/y even though transitioning to a new model and draining channel during several weeks.  Android continued to experience over 8x growth which is phenomenal. Share was taken mostly from incumbent Nokia (-7), Microsoft (-4) and RIM (-3), though bear in mind that the whole pie grew by nearly 70%.

    [Updated]

    Canalys OS share data has become available and I've updated the charts and table.

  7. Double dip, with sprinkles on top

    Research · 5 comments

    Apple just had its best quarter ever with net income rising 78 percent to $3.51 per share. Revenue rose 61 percent, to $15.7 billion.

    On average, Wall Street analysts had expected Apple to report net income of $3.12 a share on revenue of $14.75 billion.

    If this is a double dip recession, then I'll take triple dip with sprinkles on top.

  8. Sony Ericsson units down 20 percent

    Research

    Sony Ericsson shipped 11 million phones at an average selling price of EUR160 in the second quarter, compared with 13.8 million units at an average price of EUR122 a year earlier. Sales rose to EUR1.76 billion from EUR1.68 billion, against expectations of EUR1.79 billion.

    The company's estimated share of the global handset market remained flat from the previous quarter at around 4%.

    The company reported net profit of EUR12 million for the three months to June 30, compared with a EUR213 million net loss the year before, missing analysts' expectations for a EUR50 million profit but sustaining the turnaround that started in the first quarter.

    via Sony Ericsson Swings To 2Q Profit.

    Sony Ericsson still sells more phones than Apple.

    See also:

    asymco | Sony Ericsson ships 14.6 million phones.

    asymco | Sony Ericsson and RIM reach market share parity.

  9. Gartner's Nick Jones on Symbian: Abandon ship

    Research · 2 comments

    Market share is an existential threat to Symbian, it imperils the very existence of the platform. And the main reason Symbian is losing share is the user experience which isn’t competitive with Apple or Android. Based on the early previews I’ve seen Symbian 3 looks to have polished a few of the rough edges, but doesn’t fix the problem. So if the weak UI is threatening Symbian’s very survival the Foundation ought to be seriously worried, right? Wrong. I just looked on the Foundation web site and blogs at the roadmap and features for future releases. What I see is too much effort on stuff that really doesn’t matter. For example: Audio policy packages for Symbian, WIFi direct, support for an “open cloud manifesto”, an accredited Symbian developer program for China, better multitasking, multiple personalised home screens, HDMI connection to external TVs, better web runtime support, better internal architecture and so on.

    Forget elegant architecture, forget better multitasking, forget Chinese developers, forget release schedules that don’t deliver S4 devices with a new user experience until 2011. None of these matter. People will never use the features if they don’t buy the phone. The situation is now serious enough that any developer who isn’t working on something directly related to a new UI is wasting their time. The S4 UI is a “bet the platform” project. For any organisation to be in a situation where its survival depends on one project is very dangerous, especially when their track record in the area isn’t outstanding. I think the Foundation needs a contingency plan in case the planned S4 interface isn’t radical enough or good enough. Maybe redirect some developers and start a couple of skunkworks projects to create new competing UIs for S4, or perhaps announce a competition with a $1M prize for a new Symbian UI to encourage some radical ideas.

    I think the Symbian foundation is just re-arranging the deck chairs on the Titanic and ignoring the Android iceberg ahead.

  10. RIMM near 52 week low

    Research · 1 comment

    RIMM shares dropped more than 5% after hours after company reported "light" units and a 20% rise in profit with a 24% rise in revenue.

    RIMM sold 11.2 million units (of which 4.9 million were new subscribers and the rest replacement units--a deterioration in replacement rate). This represents 43% growth. The unit growth is nearly double the revenue rise implying a lower ASP ($300--half the iPhone) and margin (45.4%).

    RIM passed another milestone: 100 millionth BlackBerry was sold during the quarter. We've noted before that Apple will also pass its 100 millionth iOS device this month. RIM sold 20 million units as of October 2007, right on the heels of the iPhone launch. That means that iOS grew 100 million to BlackBerry OS growing 80 million in the same time frame.

    So why are shares at a P/E of 13? 20% EPS growth would be respectable numbers, but the smartphone market is growing faster than that. The implication is that RIMM is losing share and everyone is expecting that loss to accelerate.

    Simona Jankowski from Goldman Sachs repeats her Sell rating. “RIM has now missed top-line expectations for three of the last four quarters, in our view demonstrating the building competitive pressures on its business from the iPhone and more recently from Android,” she writes. “We estimate that net subscriber additions in North America declined on a sequential basis, which we attribute primarily to the success of Android-based phones, such as the Motorola Droid and the HTC Incredible at Verizon.”

    Research In Motion Limited (USA): NASDAQ:RIMM quotes & news - Google Finance.

  11. YLE: Nokia's smartphone share crumbles in Finland

    Research

    Roughly translated:

    Nokia is rapidly losing share in the smartphone market in Finland. The iPhone is becoming a large part of the market.  Sales grew in the first quarter but a growing slice of revenues is going to Nokia's competition.  iPhone share of the Finnish smartphone market has not been previously disclosed but Sonera Sales Director Juha Koivuniuemi reveals it to be more than 20 percent.

    Nokian asema murenee huippupuhelimissa myös Suomessa | Talous ja politiikka | YLE Uutiset | yle.fi.

    I should mention that I had previously estimated iPhone share at 17% in January.

    Reminds me of another phenomenon: the iPhone in Japan.